1.VI Financiamiento Externo.pdf
Anuncio
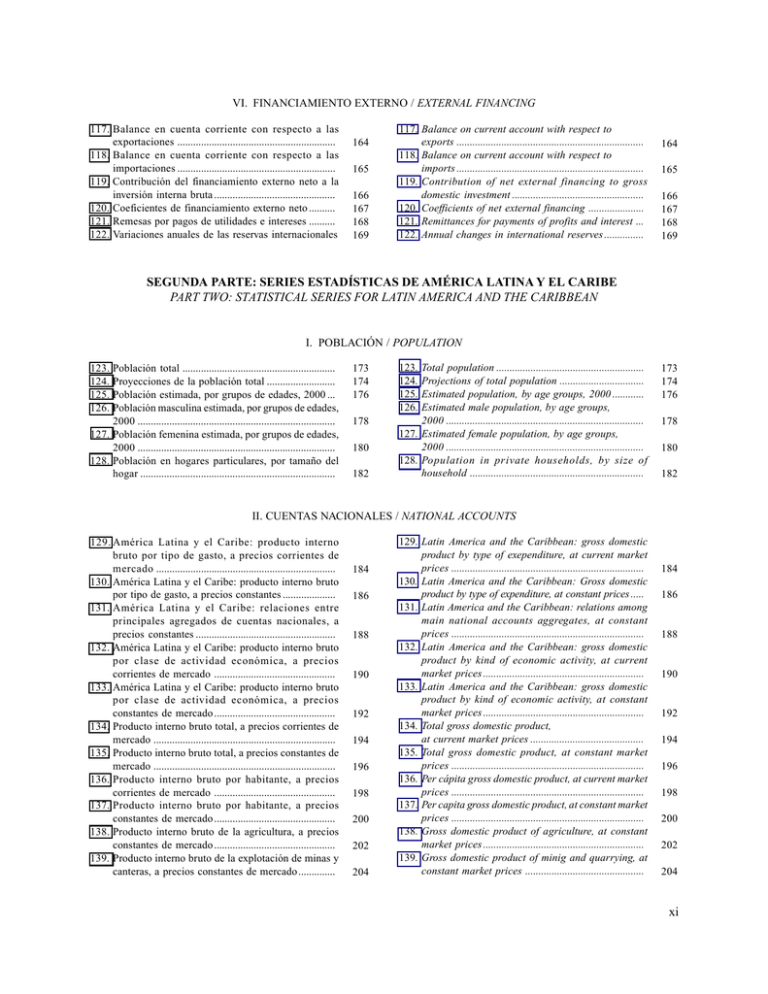
VI. FINANCIAMIENTO EXTERNO / EXTERNAL FINANCING 117. Balance en cuenta corriente con respecto a las exportaciones ............................................................ 118. Balance en cuenta corriente con respecto a las importaciones ............................................................ 119. Contribución del financiamiento externo neto a la inversión interna bruta .............................................. 120. Coeficientes de financiamiento externo neto .......... 121. Remesas por pagos de utilidades e intereses .......... 122. Variaciones anuales de las reservas internacionales 164 165 166 167 168 169 117. Balance on current account with respect to exports ....................................................................... 118. Balance on current account with respect to imports ....................................................................... 119. Contribution of net external financing to gross domestic investment .................................................. 120. Coefficients of net external financing ..................... 121. Remittances for payments of profits and interest ... 122. Annual changes in international reserves ............... 164 165 166 167 168 169 SEGUNDA PARTE: SERIES ESTADÍSTICAS DE AMÉRICA LATINA Y EL CARIBE PART TWO: STATISTICAL SERIES FOR LATIN AMERICA AND THE CARIBBEAN I. POBLACIÓN / POPULATION 123. 124. 125. 126. Población total .......................................................... Proyecciones de la población total .......................... Población estimada, por grupos de edades, 2000 ... Población masculina estimada, por grupos de edades, 2000 ........................................................................... 127. Población femenina estimada, por grupos de edades, 2000 ........................................................................... 128. Población en hogares particulares, por tamaño del hogar .......................................................................... 173 174 176 178 180 182 123. 124. 125. 126. Total population ........................................................ Projections of total population ................................ Estimated population, by age groups, 2000 ............ Estimated male population, by age groups, 2000 ........................................................................... 127. Estimated female population, by age groups, 2000 ........................................................................... 128. Population in private households, by size of household .................................................................. 173 174 176 178 180 182 II. CUENTAS NACIONALES / NATIONAL ACCOUNTS 129. América Latina y el Caribe: producto interno bruto por tipo de gasto, a precios corrientes de mercado .................................................................... 130. América Latina y el Caribe: producto interno bruto por tipo de gasto, a precios constantes .................... 131. América Latina y el Caribe: relaciones entre principales agregados de cuentas nacionales, a precios constantes ..................................................... 132. América Latina y el Caribe: producto interno bruto por clase de actividad económica, a precios corrientes de mercado .............................................. 133. América Latina y el Caribe: producto interno bruto por clase de actividad económica, a precios constantes de mercado .............................................. 134. Producto interno bruto total, a precios corrientes de mercado ..................................................................... 135. Producto interno bruto total, a precios constantes de mercado ..................................................................... 136. Producto interno bruto por habitante, a precios corrientes de mercado .............................................. 137. Producto interno bruto por habitante, a precios constantes de mercado .............................................. 138. Producto interno bruto de la agricultura, a precios constantes de mercado .............................................. 139. Producto interno bruto de la explotación de minas y canteras, a precios constantes de mercado .............. 184 186 188 190 192 194 196 198 200 202 204 129. Latin America and the Caribbean: gross domestic product by type of exependiture, at current market prices ......................................................................... 130. Latin America and the Caribbean: Gross domestic product by type of expenditure, at constant prices ..... 131. Latin America and the Caribbean: relations among main national accounts aggregates, at constant prices ......................................................................... 132. Latin America and the Caribbean: gross domestic product by kind of economic activity, at current market prices ............................................................. 133. Latin America and the Caribbean: gross domestic product by kind of economic activity, at constant market prices ............................................................. 134. Total gross domestic product, at current market prices ........................................... 135. Total gross domestic product, at constant market prices ......................................................................... 136. Per cápita gross domestic product, at current market prices ......................................................................... 137. Per capita gross domestic product, at constant market prices ......................................................................... 138. Gross domestic product of agriculture, at constant market prices ............................................................. 139. Gross domestic product of minig and quarrying, at constant market prices ............................................. 184 186 188 190 192 194 196 198 200 202 204 xi VI. FINANCIAMIENTO EXTERNO / EXTERNAL FINANCING 117. BALANCE EN CUENTA CORRIENTE CON RESPECTO A LAS EXPORTACIONES ab BALANCE ON CURRENT ACCOUNT WITH RESPECT TO EXPORTS ab (Porcentajes del valor fob de las exportaciones totales de bienes y servicios / Percentages of FOB value of total exports of goods and services) País / Country 1980 1985 1990 1995 1996 1997 1998 1999 2000 Argentina Bahamas Barbados Bolivia Brasil / Brazil Chile Colombia Costa Rica Ecuador El Salvador Guatemala Guyana Haití / Haiti Honduras Jamaica México / Mexico Nicaragua Panamá / Panama Paraguay Perú / Peru República Dominicana / Dominican Republic Suriname Trinidad y Tabago / Trinidad and Tobago Uruguay Venezuela Total c 48.2 1.3 3.8 0.6 58.7 33.0 3.9 55.6 22.2 - 2.8 9.4 31.4 33.1 33.6 10.0 46.1 83.1 9.6 49.1 2.2 9.5 0.1 - 6.4 39.7 1.0 31.4 40.2 24.0 - 2.3 20.9 21.2 36.9 28.1 33.9 23.2 - 2.5 223.8 - 2.3 40.7 - 2.7 - 30.8 2.1 1.2 22.5 10.9 4.7 - 6.2 25.2 11.0 26.8 14.9 ... 6.9 18.1 14.1 15.3 130.5 - 4.6 9.2 34.4 20.9 8.3 - 3.8 26.5 34.5 6.9 37.4 8.0 14.0 12.8 18.2 21.4 5.0 10.2 2.9 1.8 128.3 4.9 1.9 61.2 24.3 14.2 - 5.7 25.3 44.3 18.4 36.1 5.5 - 1.9 7.7 14.1 ... 14.0 10.1 - 3.3 2.2 136.8 4.1 8.0 46.9 40.0 25.0 - 0.5 39.1 51.5 17.9 41.3 9.0 11.7 2.3 20.0 ... 16.4 8.4 9.1 6.1 116.3 6.8 16.3 36.6 47.1 31.4 4.4 49.2 56.7 21.9 39.0 7.6 43.3 2.6 28.8 ... - 7.2 6.1 7.5 12.5 98.7 14.6 3.8 48.4 43.4 30.7 9.8 37.3 46.0 0.4 - 1.4 8.5 - 18.0 7.5 29.5 ... - 3.8 8.7 6.1 9.7 130.2 18.6 2.7 23.8 29.0 17.0 ... 31.9 38.2 4.5 - 1.9 9.8 - 15.8 13.0 23.4 ... 14.7 8.1 7.7 9.8 97.5 12.2 11.3 19.2 56.6 - 2.9 8.1 2.7 15.3 - 7.7 3.2 - 12.1 3.4 12.7 2.3 13.7 4.5 36.7 5.4 6.9 11.5 - 6.6 - 11.4 46.5 - 23.7 28.0 2.0 7.8 - 21.8 2.4 - 20.1 - 8.6 - 44.0 1.3 - 10.5 6.1 - 9.7 13.9 - 3.7 6.1 - 35.3 13.1 20.5 6.8 - 13.8 19.9 22.0 11.5 17.1 27.0 ... 15.6 - 16.1 16.1 ... 14.2 - 38.1 11.4 a a b b El signo menos (-) indica superávit en cuenta corriente. Según valores del Balance de pagos. c Se refiere a los 17 países de habla hispana, más Brasil y Haití. 164 The minus sign (-) indicates a current account surplus. According to Balance of payments values. c Refers to 17 Spanish-speaking countries plus Brazil and Haiti. VI. FINANCIAMIENTO EXTERNO / EXTERNAL FINANCING 118. BALANCE EN CUENTA CORRIENTE CON RESPECTO A LAS IMPORTACIONES ab BALANCE ON CURRENT ACCOUNT WITH RESPECT TO IMPORTS ab (Porcentajes del valor fob de las importaciones totales de bienes y servicios / Percentages of FOB value of total imports of goods and services) País / Country 1980 1985 1990 1995 1996 1997 1998 1999 2000 Argentina Bahamas Barbados Bolivia Brasil / Brazil Chile Colombia Costa Rica Ecuador El Salvador Guatemala Guyana Haití / Haiti Honduras Jamaica México / Mexico Nicaragua Panamá / Panama Paraguay Perú / Peru República Dominicana / Dominican Republic Suriname Trinidad y Tabago / Trinidad and Tobago Uruguay Venezuela Total c 36.2 1.3 3.6 0.8 46.1 27.9 3.8 40.0 21.8 - 2.9 8.3 26.0 21.0 28.1 9.7 37.8 45.4 9.7 33.0 2.5 16.7 0.1 - 7.1 40.3 1.7 35.3 35.5 22.7 - 3.4 15.9 19.6 30.9 17.0 28.4 19.3 - 3.3 83.5 - 2.3 30.0 - 3.7 - 66.5 2.2 1.2 20.2 13.6 5.3 - 7.9 21.1 14.3 16.1 12.9 ... 4.3 16.5 13.1 14.4 72.9 - 4.8 8.2 34.7 20.0 8.1 - 4.0 20.9 28.7 7.4 28.7 7.6 13.9 7.2 13.7 19.0 1.6 9.2 2.6 1.9 71.4 4.8 1.8 42.7 22.8 13.1 - 6.2 19.4 35.2 17.2 28.9 5.2 - 2.3 4.8 11.1 ... 5.6 9.1 - 2.9 2.3 68.0 4.0 7.0 34.3 33.0 21.0 - 0.6 26.8 40.6 16.7 32.0 8.4 11.7 1.6 15.2 ... 6.9 7.4 7.7 6.1 57.6 6.6 13.4 28.2 37.9 25.5 4.2 30.3 44.2 19.2 30.2 7.4 32.3 1.8 19.8 ... - 3.3 5.2 6.4 11.7 49.2 13.3 3.5 34.4 36.8 24.3 8.9 24.6 40.0 0.4 - 1.4 9.7 - 23.1 5.1 20.4 ... - 1.7 6.5 5.3 9.2 53.7 16.9 2.4 20.5 27.4 15.2 ... 22.3 33.9 4.7 - 2.1 10.3 - 18.9 8.4 16.6 ... 5.8 6.1 6.3 9.3 46.4 11.4 9.5 17.2 37.5 - 2.7 6.9 2.6 12.5 - 8.0 3.0 - 13.8 3.1 11.2 2.1 12.1 3.8 27.0 4.6 6.5 9.5 - 7.0 - 14.7 33.1 - 31.2 25.0 2.3 9.7 - 34.9 3.2 - 32.2 - 11.2 - 87.6 1.6 - 13.9 6.0 - 11.9 13.3 - 4.8 5.9 - 60.3 12.7 19.0 6.6 - 18.1 18.1 19.8 10.6 16.1 23.2 ... 13.8 - 20.9 15.2 ... 12.5 - 66.0 11.0 a a b b El signo menos (-) indica superávit en cuenta corriente. Según valores del Balance de pagos. c Se refiere a los 17 países de habla hispana, más Brasil y Haití. c The minus sign (-) indicates a current account surplus. According to Balance of payments values. Refers to 17 Spanish-speaking countries plus Brazil and Haiti. 165 VI. FINANCIAMIENTO EXTERNO / EXTERNAL FINANCING 119. CONTRIBUCIÓN DEL FINANCIAMIENTO EXTERNO NETO A LA INVERSIÓN INTERNA BRUTA CONTRIBUTION OF NET EXTERNAL FINANCING TO GROSS DOMESTIC INVESTMENT (Porcentajes de la inversión interna bruta a precios constantes / Percentages of gross domestic investment at constant prices) País / Country Argentina Bolivia Brasil / Brazil Chile Colombia Costa Rica Cuba Ecuador El Salvador Guatemala Haití / Haiti Honduras México / Mexico Nicaragua Panamá / Panama Paraguay Perú / Peru República Dominicana / Dominican Republic Uruguay Venezuela Total 166 Sobre la base de cifras en dólares a precios de 1990 Based on figures in dollars at 1990 prices Sobre la base de cifras en dólares a precios de 1995 Based on figures in dollars at 1995 prices 1980 1985 1990 1990 1995 1997 1998 1999 2000 12.2 0.8 13.1 50.2 3.3 42.6 ... 19.8 - 6.7 15.9 47.1 46.0 18.8 96.6 34.4 29.8 1.2 4.3 40.3 0.4 41.7 28.5 27.4 ... - 3.1 38.8 32.8 32.5 48.6 - 1.5 111.0 - 13.8 29.2 - 1.9 - 23.0 33.5 4.4 6.4 - 7.3 31.7 ... 17.1 39.2 22.4 8.8 24.2 12.3 119.3 - 23.3 14.3 18.1 - 24.6 26.2 4.1 5.8 - 10.4 39.1 39.2 34.9 24.8 19.7 - 13.8 32.4 10.8 197.2 - 1.1 17.0 20.6 12.2 29.9 13.4 8.0 28.5 19.7 34.7 23.3 11.1 23.2 - 1.9 13.8 2.2 176.6 19.2 58.7 32.3 23.8 33.6 21.4 19.1 36.6 25.7 22.1 20.2 - 0.3 29.7 13.5 11.1 6.7 155.5 31.9 68.1 22.9 27.5 44.3 22.0 21.7 36.0 23.3 19.7 48.3 10.7 34.4 - 12.8 8.1 13.5 133.8 55.8 67.3 26.9 26.7 42.6 17.4 0.6 13.6 26.4 25.5 - 49.7 11.8 36.4 - 36.7 10.2 11.6 119.8 60.4 47.0 15.9 21.4 41.0 16.1 5.8 28.0 31.8 28.8 - 22.7 19.9 31.2 13.1 18.6 13.0 111.7 60.5 51.7 13.5 64.1 30.6 - 40.2 12.8 11.1 10.5 - 46.0 1.3 17.2 - 18.7 - 166.7 1.0 20.5 - 14.3 - 152.5 1.8 7.0 7.8 - 15.7 12.1 4.9 9.9 - 23.5 17.1 8.4 15.4 22.2 21.8 9.6 20.2 - 29.9 15.0 20.9 20.6 - 95.9 12.6 VI. FINANCIAMIENTO EXTERNO / EXTERNAL FINANCING 120. COEFICIENTES DE FINANCIAMIENTO EXTERNO NETO COEFFICIENTS OF NET EXTERNAL FINANCING (Porcentajes del ingreso nacional bruto real disponible a precios constantes / Percentages of real gross national disposable income at constant prices) País / Country Argentina Bolivia Brasil / Brazil Chile Colombia Costa Rica Cuba Ecuador El Salvador Guatemala Haití / Haiti Honduras México / Mexico Nicaragua Panamá / Panama Paraguay Perú / Peru República Dominicana / Dominican Republic Uruguay Venezuela Total Sobre la base de cifras en dólares a precios de 1990 Based on figures in dollars at 1990 prices Sobre la base de cifras en dólares a precios de 1995 Based on figures in dollars at 1995 prices 1980 1985 1990 1990 1995 1997 1998 1999 2000 3.5 0.1 3.7 9.8 0.8 14.0 ... 6.5 - 0.8 2.6 6.7 13.3 6.5 17.9 9.5 8.4 0.3 0.8 7.9 0.1 8.2 6.2 6.7 ... - 0.7 4.2 4.1 5.5 10.7 - 0.4 30.8 - 1.8 6.1 - 0.3 - 3.3 4.3 0.9 1.7 - 1.4 8.8 ... 3.4 5.0 3.0 1.2 5.7 2.9 18.9 - 4.0 3.2 4.0 - 3.1 3.5 0.8 1.2 - 1.7 7.7 9.2 6.1 3.0 2.4 - 1.6 7.1 2.6 45.4 - 0.2 4.0 3.7 2.2 4.5 3.0 2.1 7.4 3.6 2.4 4.6 2.0 3.4 - 0.2 4.3 0.4 51.0 6.0 13.5 8.2 4.9 7.1 5.1 5.5 8.0 4.9 1.9 3.9 - 0.0 4.2 1.5 3.3 1.9 48.5 9.4 15.1 5.7 5.8 11.4 5.4 6.4 7.3 5.2 1.9 10.6 1.9 6.3 - 1.4 2.3 4.0 41.5 17.9 14.4 6.7 5.2 8.8 4.0 0.1 1.8 5.3 2.4 - 5.9 1.9 6.3 - 4.2 3.0 3.4 48.2 22.2 9.7 3.5 3.8 8.2 3.6 1.4 4.1 5.7 2.8 - 3.7 3.3 5.1 1.6 5.6 3.8 38.0 19.8 10.7 2.9 17.9 6.7 - 8.7 3.7 2.2 1.3 - 8.6 0.3 4.2 - 2.1 - 17.4 0.2 4.7 - 1.4 - 15.3 0.3 1.5 1.2 - 2.9 2.6 1.1 1.5 - 4.8 4.1 2.2 2.4 5.0 5.4 2.7 3.0 - 5.5 3.4 5.8 2.8 - 16.3 2.9 167 VI. FINANCIAMIENTO EXTERNO / EXTERNAL FINANCING 121. REMESAS POR PAGOS DE UTILIDADES E INTERESES a REMITTANCES FOR PAYMENTS OF PROFITS AND INTEREST a (Porcentajes del valor fob de las exportaciones totales de bienes y servicios / Percentages of FOB value of total exports of goods and services) País / Country 1980 1985 1990 1995 1996 1997 1998 1999 2000 Argentina Bahamas Barbados Bolivia Brasil / Brazil Chile Colombia Costa Rica Ecuador El Salvador Guatemala Guyana Haití / Haiti Honduras Jamaica México / Mexico Nicaragua Panamá / Panama Paraguay Perú / Peru República Dominicana / Dominican Republic Suriname Trinidad y Tabago / Trinidad and Tobago Uruguay Venezuela Total b 28.5 2.6 3.4 27.1 38.5 21.9 14.6 19.7 24.3 9.8 8.5 10.9 5.7 18.9 19.8 33.8 28.8 141.1 23.4 24.0 55.5 10.1 5.8 54.2 46.1 50.2 39.6 27.4 32.9 15.3 17.3 15.4 7.4 22.3 31.4 35.3 79.8 97.8 17.3 31.9 42.3 22.7 8.7 29.5 36.3 21.7 30.6 18.5 37.9 16.6 13.8 ... 7.9 24.9 24.2 23.7 58.3 31.6 6.4 46.8 36.4 11.9 8.6 20.5 27.7 18.5 18.5 8.4 19.7 5.9 7.6 20.6 11.9 16.8 15.2 18.4 62.0 26.4 3.4 38.4 35.1 12.6 8.8 18.2 33.4 18.2 21.1 6.8 19.9 6.1 10.0 ... 3.2 15.0 10.9 16.4 52.0 23.6 3.9 30.8 38.0 13.7 8.3 20.9 36.6 18.4 22.6 8.1 19.6 7.9 10.0 ... 3.6 11.6 12.9 14.3 35.0 22.0 6.1 26.2 43.6 17.8 9.3 21.5 38.6 16.4 19.7 9.5 26.5 8.8 7.4 ... 2.4 10.8 13.6 14.2 25.4 28.2 6.2 30.2 48.8 16.8 10.7 27.0 41.3 15.4 17.6 24.6 26.3 12.4 8.9 ... 2.4 10.3 14.3 12.0 27.1 31.8 5.5 28.8 48.1 15.0 ... 25.1 33.4 18.2 21.9 19.4 25.2 10.8 8.8 ... 1.8 8.7 14.8 11.2 24.5 28.6 6.7 27.5 25.1 7.4 18.7 0.9 18.3 2.2 15.7 1.0 13.8 0.9 13.3 2.0 14.1 1.7 14.9 1.8 15.0 1.5 17.1 11.0 9.7 29.3 22.7 34.1 27.1 40.4 19.1 26.9 18.2 26.1 16.7 18.0 18.4 20.1 19.6 16.9 13.1 19.9 14.9 17.5 18.0 20.5 13.8 19.5 22.2 21.5 ... 22.4 16.5 20.6 ... 22.7 11.5 18.4 a b Según valores del Balance de pagos. Se refiere a los 17 países de habla hispana, más Brasil y Haití. 168 a b According to Balance of payments values. Refers to 17 Spanish-speaking countries plus Brazil and Haiti. VI. FINANCIAMIENTO EXTERNO / EXTERNAL FINANCING 122. VARIACIONES ANUALES DE LAS RESERVAS INTERNACIONALES abc ANNUAL CHANGES IN INTERNATIONAL RESERVES abc (Millones de dólares / Millions of dollars) País / Country Argentina Bahamas Barbados Bolivia Brasil / Brazil Chile Colombia Costa Rica Ecuador El Salvador Guatemala Guyana Haití / Haiti Honduras Jamaica México / Mexico Nicaragua Panamá / Panama Paraguay Perú / Peru República Dominicana / Dominican Republic Suriname Trinidad y Tabago / Trinidad and Tobago Uruguay Venezuela Total d a b c d 1980 1985 1990 1995 ... ... ... - 96.1 ... ... ... ... ... ... ... ... ... ... ... ... ... ... ... ... ... ... ... - 58.0 ... ... ... ... ... ... ... ... ... ... ... ... ... ... ... ... ... ... ... 5.0 ... 2 121.0 ... - 197.2 ... ... - 41.8 ... - 39.0 20.1 ... ... 1.6 355.7 219.3 175.7 - 102.0 ... ... 147.4 ... 740.5 - 4.5 179.6 - 155.0 146.6 - 157.3 ... 175.6 136.4 ... 9 648.0 - 11.5 75.2 60.2 929.0 ... ... ... ... ... ... 131.0 ... - 15.2 ... ... ... ... - 96.1 ... ... ... - 58.0 ... ... ... 2 620.4 ... 218.0 ... 12 157.2 213.0 140.6 6 274.0 26 803.9 Incluye Oro monetario, Derechos especiales de giro, Posición de reserva en el Fondo Monetario Internacional, Activos en divisas y Otros Activos. Se refiere a los 17 países de habla hispana, más Brasil y Haití. Según valores del Balance de pagos. El signo menos (-) indica disminución. 1996 1997 1998 1999 2000 3 882.0 3 273.0 3 438.0 1 200.9 - 439.7 ... 56.5 119.2 ... ... ... 6.9 ... ... ... 310.1 76.1 133.2 32.0 - 38.8 8 666.0 - 7 907.0 - 7 970.0 - 7 822.0 - 2 262.0 1 107.4 3 185.2 - 2 139.6 - 748.4 234.2 1 726.6 277.4 - 1 390.1 - 319.0 869.6 - 77.5 216.0 - 149.6 480.1 - 153.7 274.0 262.0 - 395.0 - 422.0 308.0 164.9 362.6 303.2 207.8 - 119.6 176.4 315.1 242.6 - 125.4 654.4 ... ... ... ... ... - 48.6 50.2 29.1 33.6 - 57.1 174.3 295.1 230.0 473.9 117.9 201.7 - 205.0 26.9 ... ... 1 806.0 10 511.5 2 138.4 592.2 2 824.2 53.1 173.2 - 30.5 156.3 - 16.2 297.2 609.7 - 103.4 184.4 - 109.2 - 39.4 - 205.8 23.4 104.4 - 218.3 1 932.0 1 733.0 - 1 006.1 - 774.5 - 189.8 39.5 ... 98.2 ... 193.7 ... - 69.5 ... 175.3 76.0 ... 390.4 521.0 13.2 2 624.0 - 3 380.0 593.0 16 281.1 - 9 407.2 - 5 945.8 ... 171.0 5 314.0 6 819.4 a Includes Monetary gold, Special Drawing Right, Reserve position in the Internacional Monetary Fund, Foreign exchange assets and Other assets. b Refers to 17 Spanish-speaking countries plus Brazil and Haiti. c According to Balance of payments values. d The minus sign (-) indicates a decrease. 169 170
