SOJA - Exp al 21/01 - Ind. 14/01 2013/14 2012/13
Anuncio
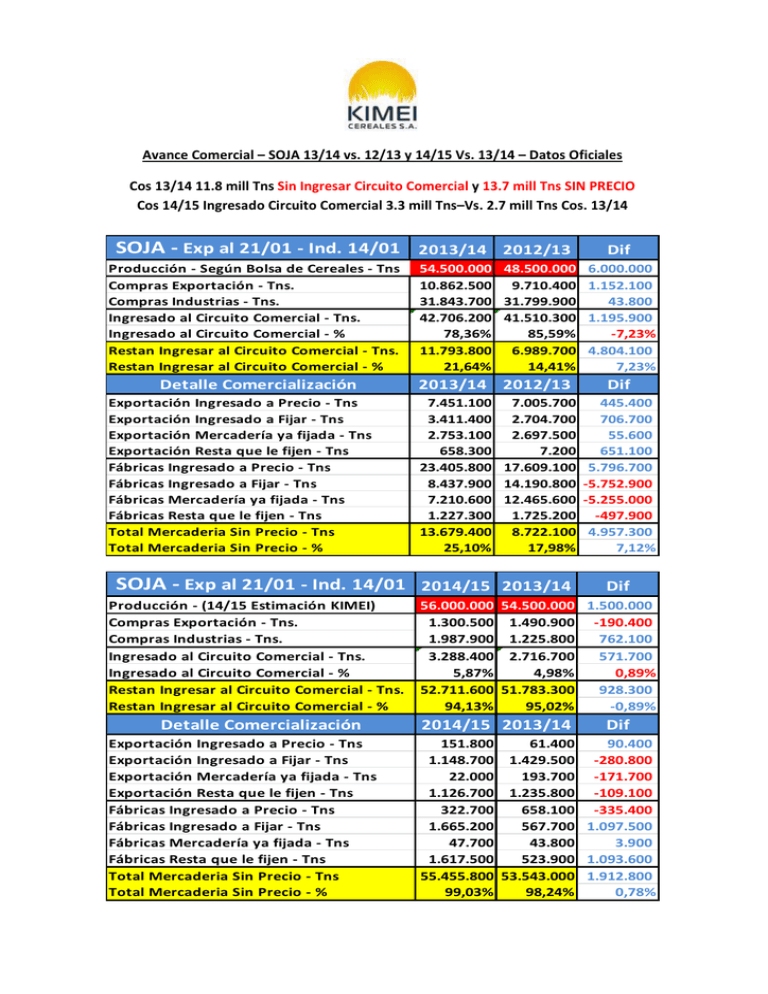
Avance Comercial – SOJA 13/14 vs. 12/13 y 14/15 Vs. 13/14 – Datos Oficiales Cos 13/14 11.8 mill Tns Sin Ingresar Circuito Comercial y 13.7 mill Tns SIN PRECIO Cos 14/15 Ingresado Circuito Comercial 3.3 mill Tns–Vs. 2.7 mill Tns Cos. 13/14 SOJA - Exp al 21/01 - Ind. 14/01 Producción - Según Bolsa de Cereales - Tns Compras Exportación - Tns. Compras Industrias - Tns. Ingresado al Circuito Comercial - Tns. Ingresado al Circuito Comercial - % Restan Ingresar al Circuito Comercial - Tns. Restan Ingresar al Circuito Comercial - % Detalle Comercialización Exportación Ingresado a Precio - Tns Exportación Ingresado a Fijar - Tns Exportación Mercadería ya fijada - Tns Exportación Resta que le fijen - Tns Fábricas Ingresado a Precio - Tns Fábricas Ingresado a Fijar - Tns Fábricas Mercadería ya fijada - Tns Fábricas Resta que le fijen - Tns Total Mercaderia Sin Precio - Tns Total Mercaderia Sin Precio - % SOJA - Exp al 21/01 - Ind. 14/01 Producción - (14/15 Estimación KIMEI) Compras Exportación - Tns. Compras Industrias - Tns. Ingresado al Circuito Comercial - Tns. Ingresado al Circuito Comercial - % Restan Ingresar al Circuito Comercial - Tns. Restan Ingresar al Circuito Comercial - % Detalle Comercialización Exportación Ingresado a Precio - Tns Exportación Ingresado a Fijar - Tns Exportación Mercadería ya fijada - Tns Exportación Resta que le fijen - Tns Fábricas Ingresado a Precio - Tns Fábricas Ingresado a Fijar - Tns Fábricas Mercadería ya fijada - Tns Fábricas Resta que le fijen - Tns Total Mercaderia Sin Precio - Tns Total Mercaderia Sin Precio - % 2013/14 2012/13 Dif 54.500.000 48.500.000 6.000.000 10.862.500 9.710.400 1.152.100 31.843.700 31.799.900 43.800 42.706.200 41.510.300 1.195.900 78,36% 85,59% -7,23% 11.793.800 6.989.700 4.804.100 21,64% 14,41% 7,23% 2013/14 2012/13 Dif 7.451.100 7.005.700 445.400 3.411.400 2.704.700 706.700 2.753.100 2.697.500 55.600 658.300 7.200 651.100 23.405.800 17.609.100 5.796.700 8.437.900 14.190.800 -5.752.900 7.210.600 12.465.600 -5.255.000 1.227.300 1.725.200 -497.900 13.679.400 8.722.100 4.957.300 25,10% 17,98% 7,12% 2014/15 2013/14 Dif 56.000.000 54.500.000 1.500.000 1.300.500 1.490.900 -190.400 1.987.900 1.225.800 762.100 3.288.400 2.716.700 571.700 5,87% 4,98% 0,89% 52.711.600 51.783.300 928.300 94,13% 95,02% -0,89% 2014/15 2013/14 Dif 151.800 61.400 90.400 1.148.700 1.429.500 -280.800 22.000 193.700 -171.700 1.126.700 1.235.800 -109.100 322.700 658.100 -335.400 1.665.200 567.700 1.097.500 47.700 43.800 3.900 1.617.500 523.900 1.093.600 55.455.800 53.543.000 1.912.800 99,03% 98,24% 0,78%
