The Climate and Weather of the West Coast
Anuncio

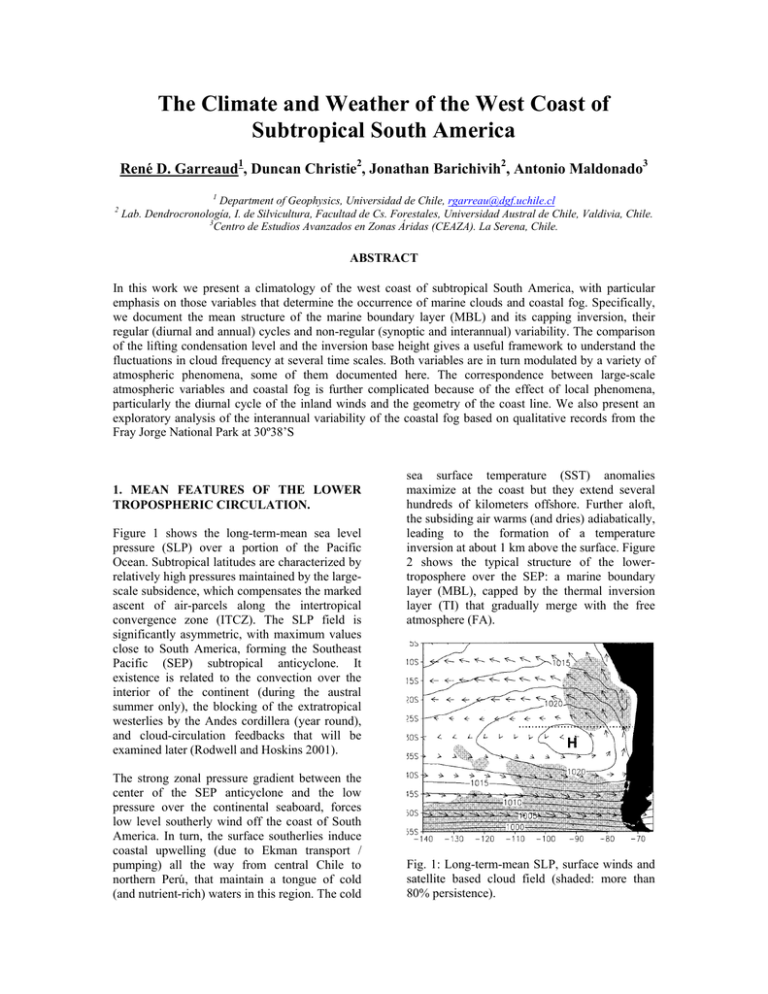
The Climate and Weather of the West Coast of Subtropical South America René D. Garreaud1, Duncan Christie2, Jonathan Barichivih2, Antonio Maldonado3 1 2 Department of Geophysics, Universidad de Chile, rgarreau@dgf.uchile.cl Lab. Dendrocronología, I. de Silvicultura, Facultad de Cs. Forestales, Universidad Austral de Chile, Valdivia, Chile. 3 Centro de Estudios Avanzados en Zonas Áridas (CEAZA). La Serena, Chile. ABSTRACT In this work we present a climatology of the west coast of subtropical South America, with particular emphasis on those variables that determine the occurrence of marine clouds and coastal fog. Specifically, we document the mean structure of the marine boundary layer (MBL) and its capping inversion, their regular (diurnal and annual) cycles and non-regular (synoptic and interannual) variability. The comparison of the lifting condensation level and the inversion base height gives a useful framework to understand the fluctuations in cloud frequency at several time scales. Both variables are in turn modulated by a variety of atmospheric phenomena, some of them documented here. The correspondence between large-scale atmospheric variables and coastal fog is further complicated because of the effect of local phenomena, particularly the diurnal cycle of the inland winds and the geometry of the coast line. We also present an exploratory analysis of the interannual variability of the coastal fog based on qualitative records from the Fray Jorge National Park at 30º38’S 1. MEAN FEATURES OF THE LOWER TROPOSPHERIC CIRCULATION. Figure 1 shows the long-term-mean sea level pressure (SLP) over a portion of the Pacific Ocean. Subtropical latitudes are characterized by relatively high pressures maintained by the largescale subsidence, which compensates the marked ascent of air-parcels along the intertropical convergence zone (ITCZ). The SLP field is significantly asymmetric, with maximum values close to South America, forming the Southeast Pacific (SEP) subtropical anticyclone. It existence is related to the convection over the interior of the continent (during the austral summer only), the blocking of the extratropical westerlies by the Andes cordillera (year round), and cloud-circulation feedbacks that will be examined later (Rodwell and Hoskins 2001). The strong zonal pressure gradient between the center of the SEP anticyclone and the low pressure over the continental seaboard, forces low level southerly wind off the coast of South America. In turn, the surface southerlies induce coastal upwelling (due to Ekman transport / pumping) all the way from central Chile to northern Perú, that maintain a tongue of cold (and nutrient-rich) waters in this region. The cold sea surface temperature (SST) anomalies maximize at the coast but they extend several hundreds of kilometers offshore. Further aloft, the subsiding air warms (and dries) adiabatically, leading to the formation of a temperature inversion at about 1 km above the surface. Figure 2 shows the typical structure of the lowertroposphere over the SEP: a marine boundary layer (MBL), capped by the thermal inversion layer (TI) that gradually merge with the free atmosphere (FA). Fig. 1: Long-term-mean SLP, surface winds and satellite based cloud field (shaded: more than 80% persistence). The depth of the MBL (or alternatively, the height of the inversion base) is largely determined by two competing processes: turbulence within the MBL and the large-scale subsidence. Eddies originated within the MBL (where the atmosphere is close to neutrality for vertical motion) tend to increase the MBL depth by incorporating air from the TI (entrainment of warm dry air). On the other hand, subsidence tends to depress the MBL depth. 1200 km offshore Coast FA TI MBL Fig. 2: Profiles of potential temperature at 27°S from the coast to Easter Island. At a given latitude, one would expect a gradual increase of the MBL depth offshore because the MBL turbulence is more energetic over warmer waters and the subsidence decrease away from the coast. Such is indeed the case, as shown in Fig. 2 by radiosonde data obtained from a cruise from at 27°S Caldera to Easter Island (Garreaud et al. 2001). Similarly, the MBL depth increases northward along the Chilean coast, as determined by a climatology of the Quintero (33°S) and Antofagasta radiosonde data (Rutllant 1994). 2. LOW-CLOUDS DYNAMICS Eddies within the MBL are, in principle, forced by the surface wind shear and slightly warmer SST with respect to the air just above. As the moist air parcels move upward, they can become saturated and form a cloud. Because the eddies can hardly penetrate the TI, the cloud is limited by the inversion base and tends to spread in the horizontal direction, forming a deck of low clouds referred to as Stratocumulus (SCu). The SCu loose energy at their top in the form of infrared radiation (the air aloft is very dry, favoring such emission) which acts to create a cold near the inversion base that further promote the turbulence within the MBL. Indeed, MBL turbulence in presence of clouds is largely driven by infrared cooling. The low-clouds off the west coast of South America (Fig. 1) constitute the largest deck of SCu over the subtropical oceans (e.g., Klein and Hartmann 1993) and play an important role on global and regional climate. The SCu are highly reflective of the solar radiation that in concert with the infrared emission cools the lower troposphere. This extra-cooling over the SEP is compensated by extra-subsidence, instigating a feedback that reinforce the subtropical anticyclone and the cloud deck itself. The SCu over the SEP reach their maximum frequency of occurrence near the South American coast and gradually decay offshore. Inspection of visible satellite imagery further reveals that the low-clouds are very uniform and compact near the coast, and become patchier offshore. Both observations are consistent with the MBL/TI structure. Near the coast, the TI is very strong, the SST is cold and the MBL is shallow, limiting the entrainment of the dry air into the MBL (in other words, all the moisture is keep within the MBL), favoring overcast conditions. Far from the coast, the TI is weaker and the SST is higher, producing more energetic eddies that can entrain dry air into the MBL (thus, locally breaking the cloud deck). Further, as the MBL growths it is possible that the cloud layer becomes decoupled from the surface layer (its source of moisture), specially during daytime. Actually, the SEP exhibits a very pronounced dawn-to-afternoon decrease in SCu amount (e.g., Garreaud and Muñoz 2004). Under the assumption that the MBL is well mixed, the cloud base can be determined from surface observations by calculating the Lifting Condensation Level (LCL). The LCL increases with higher surface temperature. The cloud top is approximately equal to the inversion base height (Zi). Using these two values, and other observations we construct a pseudo-climatology of the marine SCu “position” for the Chilean coast as shown in Fig. 3. What about the cloud frequency? In one extreme, we know that there is no clouds if LCL > Zi. That condition will be meet if the surface is too warm or the MBL is too shallow, but in “normal” conditions, cloudiness tends to reduce as Zi increases (because of potential cloud decoupling). The problem is that for most parts of the ocean/coast we don’t know Zi. A useful, alternative variable is the so called Lower Tropospheric Stability (LTS) defined as the difference in potential temperature at the 700 hPa (about 3 km ASL) and the surface. LTS is a rough measurement of the inversion strength, and thus, larger LTS goes with more clouds as in those cases the moisture is more “confined” to the MBL. Fig. 3: Shaded area indicates maximum height within 10 km of the coast line. Filled circles: inversion base average height. Open circles: cloud base height. Blue dot-dashed line is the lifting condensation level. Let us focus now in the climatological annual cycle of the SCu deck over the SEP as derived from satellite data. The SCu deck reaches its maximum frequency and spatial extent during austral spring (SON) just off the coast of central Perú. During summer, the deck reaches its southernmost position (25°S north-central Chile) but slightly weaker in frequency. As expected, at any location, the mean annual cycle of cloudiness tightly follows the annual cycle of the LTM. For instance, off central Perú, the maximum during SON is concurrent with the minimum SST there (the 700 hPa air temperature doesn’t varies much in that region) and thus the maximum LTS. Around 30°S, the maximum cloudiness occurs during summer, when the 700 air temperature reaches a maximum producing the maximum LTS. 3. LOCAL EFECTS The aforementioned climatology applies to the marine SCu clouds near the coast (perhaps 30 km offshore) but not at the coast. The coastal cloudiness is much more difficult to describe and interpret, because local-scale effects are very important but hardly quantified. To portrait the complexity in the relation between marine clouds, coastal clouds and fog, let us consider their annual cycle at 30°S. As noted before, the nearby marine SCu reaches their maximum in DEF, the cloudiness at La Serena airport reaches a maximum in late winter (JAS) (Quintana 2006, personal communication), and the fog visual observations at Fray Jorge National Park peak in late spring (OND). A key element needed to reconcile that seemingly disparate annual cycles, is the diurnal cycle. Inspection of visible satellite imagery indicates a coastal clearing (20-50 km) is a frequent phenomena most of the afternoon along north-central Chile, especially during the austral summer months. In presence of inland topography (as the case of north-central Chile), vigorous upslope winds leads to divergence at the coast, and the subsequent enhancement of the subsidence at and near the coast (Rutllant et al. 2003). It has been proposed that the clearing occurs in connection with a depression of the MBL near the coast such that LCL > Zi. Another important local effect is the suction of MBL air inland at the mouth of river basins, particularly when they form a narrow gap in the coastal range. During daytime, the marked air temperature contrast between the nearby ocean and the continent produces a pressure gradient that induces a low level gap flow, and therefore, favorable conditions for the intrusions of marine clouds inland. Such seems the case at the mouth of the Limari river, explaining at least partially the large frequency of fog in the Talinay and Fray-Jorge areas. Finally, the geometry of the coastal line also exerts a significant control of the MBL structure and their capping clouds. Downstream (in our case, to the north) of the major capes (as Point Lengua de Vaca at 30°S), the low level flow experience a horizontal “expansion fan”, and consequently the MBL depressed there. Given some conditions, the MBL become so shallow that the local LCL lies above the inversion base, producing a mesoscale area of clear skies. 4. SYNOPTIC SCALE VARIABILITY Rapid transitions from cloudy to clear to cloudy conditions that are often seen off the coast of central Chile (e.g. Fig. 4) and they are ultimately forced by the passage of midlatitude weather systems farther south. The cloud free area extends several hundreds of Km offshore. The clearing of the SCu occurs in connection with the development of a coastal low in central Chile (Garreaud et al. 2000; Garreaud and Rutllant 2003). One would expect a very low probability of coastal fog occurrence during the developing stage of a coastal low. associated with high fog-index values (more than 60 foggy-days per quarter). On the basis of observations at the coast and modeling results, the clearing of the SCu has been associated with enhanced subsidence and advection of continental air during the first stage of coastal lows. After the coastal low culminates, there is a rapid advance of the coastal stratus from northern to central Chile. In this stage, there are a few cases in which the MBL near the coast become deeper than normal leading to an intrusion of cool, moist air and low clouds inland, increasing the likelihood of coastal fog. Of course, NIÑO 3.4 SSTA has no direct effect on fog at Fray Jorge. Our working hypothesis is that La Niña years are associated with a stronger SEP anticyclone, stronger coastal southerlies, colder coastal SST and eventually larger LTS, promoting favorable conditions for more marine SCu clouds and coastal fog. 3.00 Fog N 3.4 SST 2.00 SD 1.00 0.00 -1.00 -2.00 R = - 0.52 (n = 21) -3.00 1985 1987 1989 1991 1993 1995 1997 1999 2001 2003 2005 Fig. 5. Monthly fog-index averaged during SON and the contemporaneous SST anomalies (SSTA) at region NIÑO 3.4. 5. REFERENCES Garreaud, R., J. Rutllant, J. Quintana, J. Carrasco and P. Minnis, 2001: CIMAR-5: A snapshot of the lower troposphere over the Southeast subtropical Pacific. Bull. Amer. Meteor. Soc. 82, 2193-2207 Garreaud, R., J. Rutllant and H. Fuenzalida, 2002: Coastal lows in north-central Chile. Mon. Wea. Rev., 130, 75-88. Fig. 4: Sequence of GOE-8 visible imagery. 5. INTERANNUAL VARIABILITY We just began an exploratory analysis of the interannual variability of the coastal fog based on qualitative records at Fray Jorge National Park (presence/absence of fog as determined daily by park rangers). Figure 5 shows the monthly fogindex averaged during SON and the contemporaneous SST anomalies (SSTA) at region NIÑO 3.4. There is a weak but significant inverse relation with NIÑO 3.4 SSTA, such that El Niño years tends to be associated with low fog-index values (less than 30 foggy-days per quarter), while La Niña years tends to be Garreaud, R., R. Munoz, 2004: The diurnal cycle of circulation and cloudiness over the subtropical southeast Pacific: A modeling study. J. of Climate, 17, 1699-1710 Garreaud, R. and J. Rutllant, 2003: Coastal lows in north-central Chile: Numerical simulation of a typical case. Mon. Wea. Rev., 131, 891-908. Klein, S. and D. Hartmann, 1993:The Seasonal Cycle of Low Stratiform Clouds. J. Climate, 6, 1587–1606 Rodwell, M. and B. J. Hoskins: Subtropical Anticyclones and Summer Monsoons, J. Climate, 14, 3192–3211. Rutllant, J., 1994: On the generation of coastal lows in central Chile. ICTP Internal Report. 164.


