Territory and Environment Territorio y Medio Ambiente
Anuncio
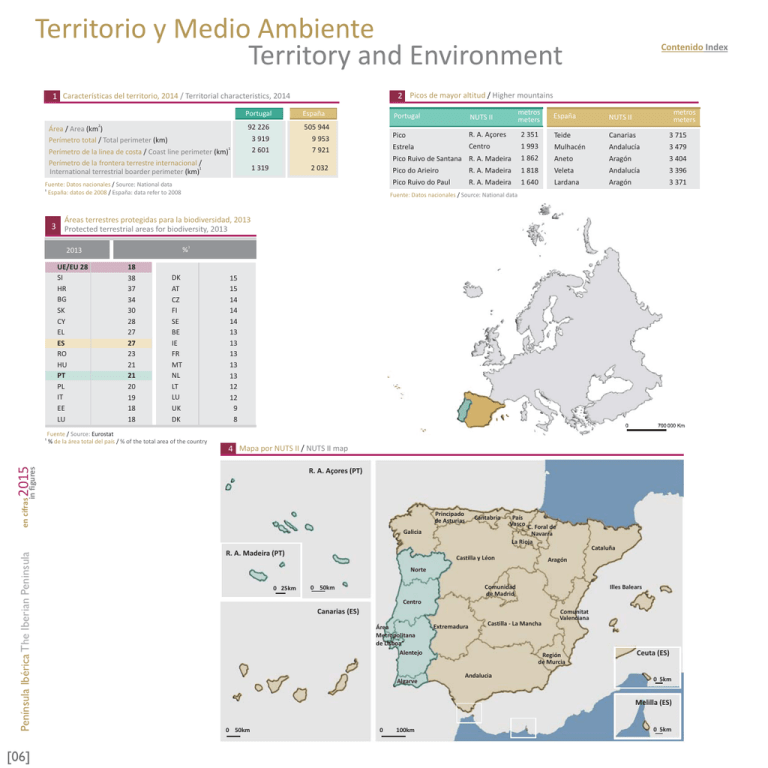
Territorio y Medio Ambiente Territory and Environment 2 Picos de mayor altitud / Higher mountains 1 Características del territorio, 2014 / Territorial characteristics, 2014 Portugal 2 Área / Area (km ) Perímetro total / Total perimeter (km) Perímetro de la linea de costa / Coast line perimeter (km)1 Perímetro de la frontera terrestre internacional / International terrestrial boarder perimeter (km)1 92 226 3 919 2 601 1 319 Contenido Index España Portugal NUTS II 505 944 9 953 7 921 Pico R. A. Açores Estrela Centro 2 032 Fuente: Datos nacionales / Source: National data 1 España: datos de 2008 / España: data refer to 2008 metros meters metros meters España NUTS II 2 351 Teide Canarias 3 715 1 993 Mulhacén Andalucía 3 479 Pico Ruivo de Santana R. A. Madeira 1 862 Aneto Aragón 3 404 Pico do Arieiro R. A. Madeira 1 818 Veleta Andalucía 3 396 Pico Ruivo do Paul R. A. Madeira 1 640 Lardana Aragón 3 371 Fuente: Datos nacionales / Source: National data Áreas terrestres protegidas para la biodiversidad, 2013 3 Protected terrestrial areas for biodiversity, 2013 1 % 2013 UE/EU 28 SI HR BG SK CY EL ES RO HU PT PL IT EE LU 1 18 38 37 34 30 28 27 27 23 21 21 20 19 18 18 DK AT CZ FI SE BE IE FR MT NL LT LU UK DK 15 15 14 14 14 13 13 13 13 13 12 12 9 8 Fuente / Source: Eurostat % de la área total del país / % of the total area of the country en cifras in figures 2015 4 Mapa por NUTS II / NUTS II map R. A. Açores (PT) Principado de Asturias Cantabria Península Ibérica The Iberian Peninsula Galicia [06] País Vasco C. Foral de Navarra La Rioja Cataluña R. A. Madeira (PT) Castilla y Léon Aragón Norte 0 25km Illes Balears Comunidad de Madrid 0 50km Centro Canarias (ES) Área Metropolitana de Lisboa” Alentejo Extremadura Castilla - La Mancha Región de Murcia Andalucia Algarve Comunitat Valenciana Ceuta (ES) 0 5km Melilla (ES) 0 50km 0 100km 0 5km Territorio y Medio Ambiente Territory and Environment Contenido Index 1 6 Residuos urbanos recogidos y tratados1, 2006-2013 / Municipal waste generation and treatment , 2006-2013 Contribución de las energías renovables al consumo de energía final, 2013 5 Share of renewable energy in gross final energy consumption, 2013 kg/hab. kg./inhab. 600 Objetivo/Objective 2020 Objetivo Objective Portugal España UE/EU 28 25,7% 580 31% 20% 20% España Objetivo Objective Objetivo Objective 15,4% 2 560 540 15,0% 520 500 Portugal 480 Portugal 449 460 UE/EU 28 España 440 Fuente / Source: Eurostat 440 420 400 2006 2007 2008 2009 2010 2011 2012 2013 Fuente / Source: Eurostat 1 Todos los residuos urbanos recogidos fueran tratados / All the waste generated was treated 2 Dato estimado para 2013 / 2013: Estimated Gasto de la Administración Central en protección ambiental, 2003-2012 7 8 Environmental protection expenditure by General government, 2003-2012 Residuos urbanos reciclados, 2004-2013 / Municipal waste recycled, 2004-2013 kg/hab. kg./inhab. €/hab. €/inhab. 200,0 en cifras in figures 2015 100 172,8 90 España1 88 80 160,0 UE 281 70 57 60 120,0 Península Ibérica The Iberian Peninsula 50 [07] 79,8 80,0 40 Portugal Portugal 30 España 40,0 20 49,1 10 0 2004 2005 1 2006 2007 2008 Fuente / Source: Eurostat Dato estimado para 2013 / 2013: Estimated 2009 2010 2011 2012 2013 0,0 2003 2004 1 2005 2006 2007 Fuente / Source: Eurostat Datos estimados pelo Eurostat / Eurostat estimate 2008 2009 2010 2011 2012
