The Resource Cap Coalition (RCC) is an open platform for
Anuncio
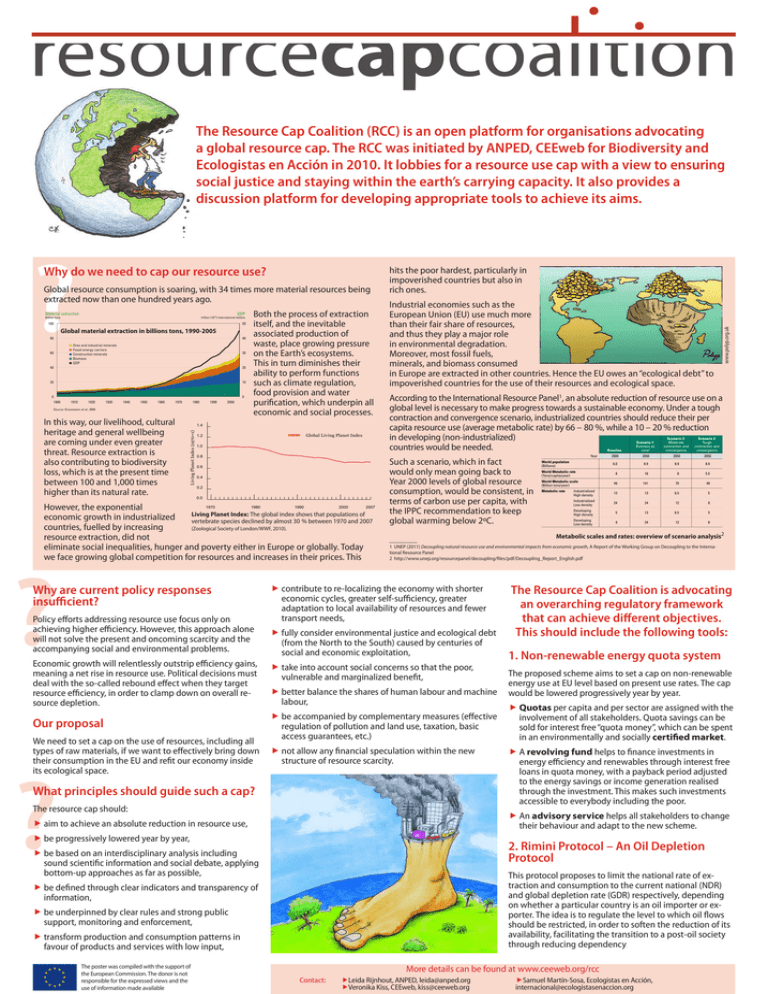
The Resource Cap Coalition (RCC) is an open platform for organisations advocating a global resource cap. The RCC was initiated by ANPED, CEEweb for Biodiversity and Ecologistas en Acción in 2010. It lobbies for a resource use cap with a view to ensuring social justice and staying within the earth’s carrying capacity. It also provides a discussion platform for developing appropriate tools to achieve its aims. TT eight, while GDP rose 23-fold (Figure 1). he 20th century was a time of eight, while GDP rose 23-fold (Figure 1). he 20th century was a time of This expansion of material consumption remarkable progress for human This expansion of material consumption remarkable progress for human was not equitably distributed and it had civilization. Driven by technological was not equitably distributed and it had civilization. Driven by technological profound environmental impacts. advances as well as demographic profound environmental impacts. advances as well as demographic and economic growth, the annual and economic growth, the annual As earlier reports of the International extraction of construction materials grew As earlier reports of the International extraction of construction materials grew Resource Panel (IRP) have concluded, by a factor of 34, ores and minerals by a Resource Panel (IRP) have concluded, by a factor of 34, ores and minerals by a overexploitation of resources, climate factor of 27, fossil fuels by a factor of 12, overexploitation of resources, climate factor of 27, fossil fuels by a factor of 12, change, pollution, land-use change, and biomass by a factor of 3.6, and total pollution, land-use change, and a factor of 3.6, total while GDPand rose 23-fold (Figurechange, 1). century was a time ofbiomass byeight, loss of biodiversity rose toward the top of material extraction by a factor of about loss of biodiversity rose toward the top of material extraction by a factor of aboutconsumption This expansion of material able progress for human was not equitably distributed and it had ion. Driven by technological profound environmental impacts. es as well as demographic rowth, the annual Figure 1. Global material extraction in billion tons, 1900–2005 Figure 1. Global material extraction in billion tons, 1900–2005 As earlier reports of the International nstruction materials grew ● Ores and industrial minerals Resource Panel (IRP) have concluded, , ores and minerals by a ● Ores and industrial minerals ● Fossil energy carriers overexploitation of resources, climate sil fuels by a factor of 12, ● Fossil energy carriers ● Construction minerals ● Construction minerals change, pollution, land-use change, and ctor of 3.6, and total ● Biomass Material extraction GDP ● Biomass Material GDPdollars ● GDP ion by a factor of about Billionextraction tons loss of biodiversity rose toward the top of trillion (10 ) international ● GDP s ? Why do we need to cap our resource use? Global resource consumption is soaring, with 34 times more material resources being extracted now than one hundred years ago. 12 Billion tons 100 trillion (1012) international dollars 100 50 Global material extraction in billions tons, 1990-2005 material extraction in billion tons, 80 1900–2005 60 40 20 60 40 ● ● ● ● ● 40 Ores and industrial minerals Fossil energy carriers Construction minerals Biomass GDP GDP trillion (1012) international dollars 30 20 50 20 10 40 0 0 0 1900 1910 1920 1930 1940 1950 30 1960 1970 1980 1990 2000 1900 1910 1920 1930 1940 1950 1960 1970 1980 1990 2000 Source: Krausmann et al., 2009 Source: Krausmann et al., 2009 20 In this way, our livelihood, cultural heritage and general wellbeing are coming under even greater threat. Resource extraction is also contributing to biodiversity loss, which is at the present time between 100 and 1,000 times higher than its natural rate. 1.6 1940 1950 1960 1970 1980 1990 2000 1.4 Living Planet Index (1970=1) 1930 Living Planet Index (1970=1) 1.6 0 1920 50 40 30 20 10 0 1.4 10 1.2 1.0 0.8 0.6 0.4 Global Living Planet Index 1.2 1.0 0.8 0.6 0.4 0.2 0.0 0.2 1970 1980 1990 2000 2007 1.4 1.6 1.2 1.4 1.0 1.2 0.8 1.0 0.6 World 0.8 0.4 0.6 0.2 0.4 0.0 Number of planets 2. Global long-term trends in the use of natural resources and in undesirable environmental impacts According to the International Resource Panel1, an absolute reduction of resource use on a global level is necessary to make progress towards a sustainable economy. Under a tough contraction and convergence scenario, industrialized countries should reduce their per capita resource use (average metabolic rate) by 66 – 80 %, while a 10 – 20 % reduction in developing (non-industrialized) countries would be needed. 1.6 ? Industrial economies such as the European Union (EU) use much more than their fair share of resources, and thus they play a major role in environmental degradation. Moreover, most fossil fuels, minerals, and biomass consumed in Europe are extracted in other countries. Hence the EU owes an “ecological debt” to impoverished countries for the use of their resources and ecological space. Table 2.1. Metabolic scales and rates, overview of scenario analysis However, the exponential Year shows that populations of Planet Index: The global index economic growth in industrialized 0.0Living vertebrate species declined by almost 30 % between 1970 and 2007 1970 1980 1990 2000 2007 countries, fuelled by increasing (Zoological Society of London/WWF, 2010). Year Global Ecological Footprint resource extraction, did not eliminate social inequalities, hunger and poverty either in Europe or globally. Today Global Ecological we face growing global competition for resources and increases in their prices.Footprint This World biocapacity Number of planets 2009 80 Both the process of extraction itself, and the inevitable associated production of waste, place growing pressure on the Earth’s ecosystems. This in turn diminishes their ability to perform functions such as climate regulation, food provision and water purification, which underpin all economic and social processes. Global Living Planet Index hits the poor hardest, particularly in impoverished countries but also in rich ones. Why are current policy responses insufficient? biocapacity 1961 1971 Policy efforts addressing resource use focus only on achieving higher efficiency. However, this approach alone will not solve the present and oncoming scarcity and the accompanying social and environmental problems. 0.2 0.0 1961 1971 Economic growth will relentlessly outstrip efficiency gains, meaning a net rise in resource use. Political decisions must deal with the so-called rebound effect when they target resource efficiency, in order to clamp down on overall resource depletion. Our proposal We need to set a cap on the use of resources, including all types of raw materials, if we want to effectively bring down their consumption in the EU and refit our economy inside its ecological space. ? Such a scenario, which in fact would only mean going back to Year 2000 levels of global resource consumption, would be consistent, in terms of carbon use per capita, with the IPPC recommendation to keep global warming below 2ºC. 1991 2001 2007 fffully consider environmental justice and ecological debt Year (from the North to the South) caused by centuries of social and economic exploitation, 1981 1991 2001 2007 Scenario 2: Moderate contraction and convergence Scenario 3: Tough contraction and convergence 2000 2050 2050 2050 6.0 8.9 8.9 8.9 8 16 8 5.5 49 141 70 49 Industrialized High density 13 13 6.5 5 Industrialized Low density 24 24 12 8 Developing High density 5 13 6.5 5 Developing Low density 9 24 12 8 Year World population (Billions) World Metabolic rate (Tons/capita/year) World Metabolic scale (Billion tons/year) Metabolic rate 2 ffcontribute to re-localizing the economy with shorter economic cycles, greater self-sufficiency, greater adaptation to local availability of resources and fewer transport needs, Year 1981 Baseline Scenario 1: Business as usual Metabolic scales and rates: overview of scenario analysis consumptionwouldrendertheexisting tripledbytheyear2050to18billionpeople, policiesofa‘circulareconomy’(OECD, whilemaintainingtheresource 1 UNEP (2011) Decoupling natural resource use and environmental impacts consumptionpatterns(metabolicrate)of from economic growth, A Report of the Working Group on Decoupling to the Interna2008)verydifficult,ifonlybecausethe tional Resource Panel potentiallyreusablewastesareverymuch theyear2000.Moreover,thisincrease 2 http://www.unep.org/resourcepanel/decoupling/files/pdf/Decoupling_Report_English.pdf smallerthantherequiredinputs.For the would,ifglobalmanufacturingcontinuesto industrialized countries, achieving a factor beconcentratedinlow-wageenvironments 2 reduction of metabolic rates would imply endowedwithviableinfrastructuresand resource productivity gains of 1–2% institutions,takeplaceincountriesthat annually (whichiswithintherangeofthe wereclassifiedasdevelopingcountries productivitygainsofthepasttwodecades), withaveryhighpopulationdensityinthe netofanyincome-basedreboundeffects year2000,suchasChinaandIndia.Thus, (Greeningetal.,2000).Morerealistically,it theburdenofresourceflowsperunitarea wouldin2050besubstantiallyabovethe wouldrequiremuchhigherinnovationrates EuropeanorJapaneselevelsoftoday.This andproductivity(efficiency)gains.23Ineither BAUscenarioisincompatiblewiththe case,thisscenariowouldrequire IPCC’sclimateprotectiontargets. substantialeconomicstructuralchangeand massiveinvestmentsininnovationsfor AlthoughScenario 2 (moderate contraction resourcedecoupling. and convergence) assumessubstantial structuralchangeinthedominantindustrial Scenario 3 (tough contraction and productionandconsumptionpatterns,itstill convergence) doesnotraiseglobal impliesaroughly40%increaseinannual resourceconsumptionabovethe2000 globalresourceusewithassociated environmentalimpacts.Ifglobal 23 One should be aware that achieving a substantial reduction in resource use on an economy-wide per capita level is much manufacturingcontinuestobeconcentrated more difficult than achieving substantial resource productivity inlow-wageenvironments,practicallyallof gains within certain areas of production. For an overall “Factor 2”-reduction of metabolic rate, much larger resource productivity thatincreasewouldoccurinthecountries gains have to be achieved in some areas (cf. Weizsäcker et al., 1997 “factor 4”; or Schmidt-Bleek, "factor 10" cf. Hinterberger and classifiedas‘developing’intheyear2000. Schmidt-Bleek, 1999; or “factor five” in, Weizsäcker, et al., 2009), Suchafastincreaseinresource while, for example, food supply can only be reduced by a much fftake into account social concerns so that the poor, vulnerable and marginalized benefit, ffbetter balance the shares of human labour and machine labour, ffbe accompanied by complementary measures (effective regulation of pollution and land use, taxation, basic access guarantees, etc.) ffnot allow any financial speculation within the new structure of resource scarcity. What principles should guide such a cap? The resource cap should: The Resource Cap Coalition is advocating an overarching regulatory framework that can achieve different objectives. This should include the following tools: 1. Non-renewable energy quota system The proposed scheme aims to set a cap on non-renewable energy use at EU level based on present use rates. The cap would be lowered progressively year by year. smaller margin. 31 ffQuotas per capita and per sector are assigned with the involvement of all stakeholders. Quota savings can be sold for interest free “quota money”, which can be spent in an environmentally and socially certified market. ffA revolving fund helps to finance investments in energy efficiency and renewables through interest free loans in quota money, with a payback period adjusted to the energy savings or income generation realised through the investment. This makes such investments accessible to everybody including the poor. ffAn advisory service helps all stakeholders to change their behaviour and adapt to the new scheme. ffaim to achieve an absolute reduction in resource use, ffbe progressively lowered year by year, 2. Rimini Protocol – An Oil Depletion Protocol ffbe based on an interdisciplinary analysis including sound scientific information and social debate, applying bottom-up approaches as far as possible, This protocol proposes to limit the national rate of extraction and consumption to the current national (NDR) and global depletion rate (GDR) respectively, depending on whether a particular country is an oil importer or exporter. The idea is to regulate the level to which oil flows should be restricted, in order to soften the reduction of its availability, facilitating the transition to a post-oil society through reducing dependency. ffbe defined through clear indicators and transparency of information, ffbe underpinned by clear rules and strong public support, monitoring and enforcement, fftransform production and consumption patterns in favour of products and services with low input, The poster was compiled with the support of the European Commission. The donor is not responsible for the expressed views and the use of information made available www.polyp.org.uk Keyfindings findings Key More details can be found at www.ceeweb.org/rcc Contact: �Leida Rijnhout, ANPED, leida@anped.org �Veronika Kiss, CEEweb, kiss@ceeweb.org �Samuel Martín-Sosa, Ecologistas en Acción, internacional@ecologistasenaccion.org
