Pattern Analysis
Anuncio
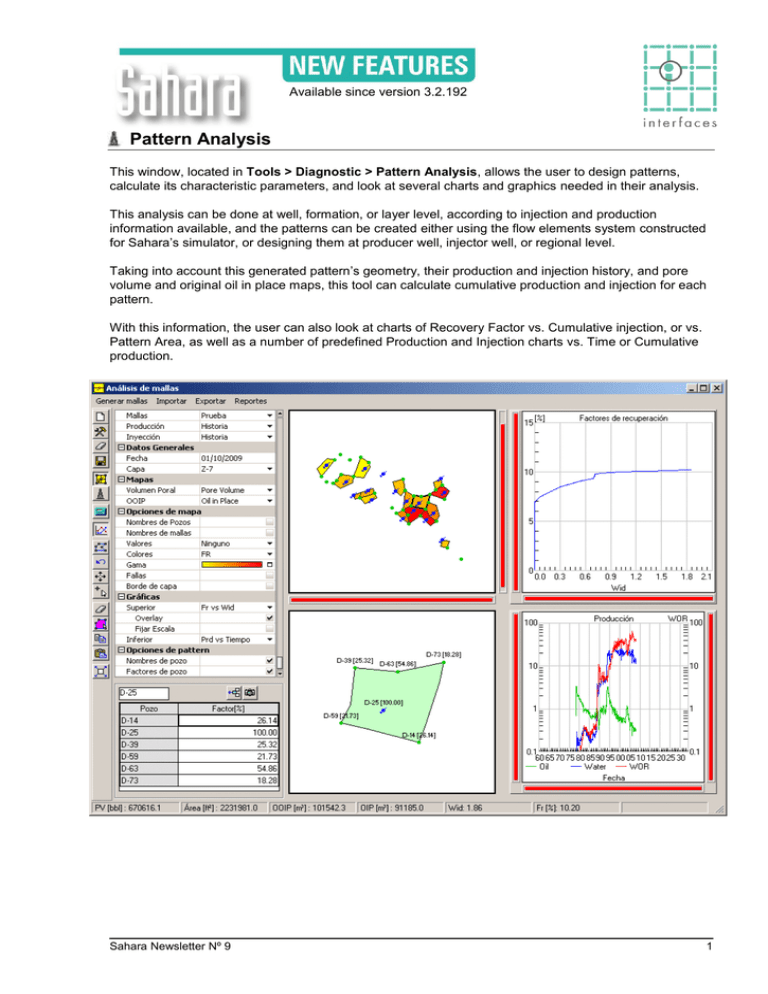
Available since version 3.2.192 Pattern Analysis This window, located in Tools > Diagnostic > Pattern Analysis, allows the user to design patterns, calculate its characteristic parameters, and look at several charts and graphics needed in their analysis. This analysis can be done at well, formation, or layer level, according to injection and production information available, and the patterns can be created either using the flow elements system constructed for Sahara’s simulator, or designing them at producer well, injector well, or regional level. Taking into account this generated pattern’s geometry, their production and injection history, and pore volume and original oil in place maps, this tool can calculate cumulative production and injection for each pattern. With this information, the user can also look at charts of Recovery Factor vs. Cumulative injection, or vs. Pattern Area, as well as a number of predefined Production and Injection charts vs. Time or Cumulative production. Sahara Newsletter Nº 9 1 Pattern Scenarios The user can create different work scenarios, and use a different set of patterns in each one. Production and injection scenarios These scenarios (from where the data will be obtained) can be selected independently, to quickly evaluate alternative production and injection forecasts. Data can be processed at layer or formation level, according to the information available in the project. Maps Sahara needs the user to specify a Pore Volume and an OOIP (original oil in place) map to be able to perform these calculations. Automatic Pattern generation Sahara’s simulator uses flow elements, which can be created manually or automatically, to perform its calculations. Since the group of flow elements converging at a particular well (injector or producer) can be considered as that well’s pattern, this tool can generate Patterns based on available flow elements geometry. This can be done from the menu Create Pattern. Interactive Pattern design This window’s toolbar has several buttons dedicated to design the polygons that define the pattern system. You can draw each pattern’s perimeter clicking on the map with your mouse. Well patterns or Regional patterns The “work unit” for this window is a polygon, which can represent a single well, or a region involving a several producer and/or injector wells. If the user wants to represent patterns at well level the polygon vertexes should be located at wells. Sahara Newsletter Nº 9 2 Well percentages Once the patterns are defined, Sahara can determine the percentage each well supplies to each pattern. A well inside a particular pattern will provide 100%, while for a well located in a limit of the pattern, the contribution percentage can be estimated using the angle or pondered according to Pore Volume or OOIP of shared patterns. This values can be manually edited later to correct any singularities not taken into account in this method. Recovery Factors Sahara can calculate the recovery factor along history for each pattern and display them in charts and tables. To do this, the system will take into account Pore Volume and Original oil in place from the maps, production and injection history of each individual well at the selected level (Layer, Formation, Field), and well contribution percentages to each pattern, and calculate the cumulative production and injection. Maps The window displays a main map, in the upper part of the window, with the pattern’s geometry for the selected layer. In this map you can see the pattern’s and well’s name, as well as the numeric values of several properties at the analysis date (Recovery Factor, Injected water in pore volumes (Wid), Oil in place) These values can also be represented as a color scale in the map. There are other configuration options to choose whether to show faults and layer borders or not. The detailed map, in the lower part of the window, shows the geometry of the pattern selected in the main map, the name of the wells and their contribution percentages. Charts When selecting one or more patterns by clicking on them, charts are refreshed. Charts can be configured using predefined templates. By holding down the control key while clicking on the patterns, groups of patterns can be selected and displayed (as a sum) simultaneously. In the Recovery Factor vs. Wid chart, there is an option to show curves in Overlay mode, allowing all selected pattern’s curves to be displayed individually. In this case, when selecting a particular curve, its name will be displayed in the chart and the pattern will be highlighted on the main map. The status bar shows information of the curve’s values when moving the cursor over the charts as usual. Upper chart templates: Recovery Factor vs. Injected Water (pore volumes) Recovery Factor vs. Pattern Area Lower chart templates Oil, Water and WOR vs. Time Log(WOR) vs. Np Log(WOR) vs. Wid Oil, Water and Liquid vs. Time Oil, Injected water, Liquid, Number of producing wells and number of injector wells vs. Time Toolbar The top four buttons allow the user to create a new pattern scenario, Los primeros botones permiten la creación y borrado de escenarios y la grabación de las novedades realizadas. Los siguientes 2 botones permiten la exportación e importación, a un archivo de texto, con la totalidad de la información de un escenario. Estas opciones permiten portar un escenario de un proyecto a otro. El requisito para poder hacer esas operaciones es, obviamente, que la nomenclatura de pozos y capas sea la misma. Sahara Newsletter Nº 9 3 Mallas y Pozos La opción Mallas es la que se ha descripto hasta ahora, mediante la cual al hacer click en el mapa principal se seleccionan mallas. La opción Pozos permite seleccionar pozos en el mapa principal y ver el detalle de las mallas que comparten el mismo pozo en el mapa secundario. Reportes Este menú genera reportes tabulares de propiedades de mallas y de factores por pozo. Cálculos Este botón desplegable permite calcular: Volúmenes porales y petróleo in situ Pozos por malla Factores de peso Factores de recuperación Pozos equivalentes Pozos equivalentes El cálculo de pozos equivalentes toma en cuenta los porcentajes de aporte de cada pozo de la malla y calcula el número de pozos correspondiente a un aporte del 100% cada uno. Luego se obtiene el área equivalente por pozo. A modo de ejemplo, una malla del tipo five spot contiene un pozo inyector con 100% y 4 productores con 25%. El resultado del cálculo serán 2 pozos equivalentes. Toolbar Create new pattern scenario This button creates a new pattern scenario Rename pattern scenario This button allows changing pattern scenario name. Erase pattern scenario This button deletes the pattern scenario in use. Save changes This button saves the changes in the pattern scenario in use. Patterns If selected, patterns’ edit buttons will be enabled. Wells If selected, wells edit buttons will be enabled. Sahara Newsletter Nº 9 4 Calculate This button opens a dialog to set some information about calculation options. Charts If selected, it shows the four graphics, instead of only the first one. New pattern This button allows drawing a pattern. Erase vertex When creating a new pattern, this button allows deleting the last vertex drawn. Edit vertex This button allows editing a pattern vertex. Insert point This button saves the pattern scenario in use. Add well This button allows adding a well to a pattern. Erase selected patterns This button deletes the selected patterns. Select all patterns This button selects all the patterns. Copy This button copies the selected patterns. Paste This button pastes the patterns previously copied. View all This button adjusts the scale for all the charts. Sahara Newsletter Nº 9 5 La reproducción de este dibujo es autorizada por Caloi Prohibida su reproducción Sahara Newsletter Nº 9 6
