Díptico de predicción Noviembre
Anuncio

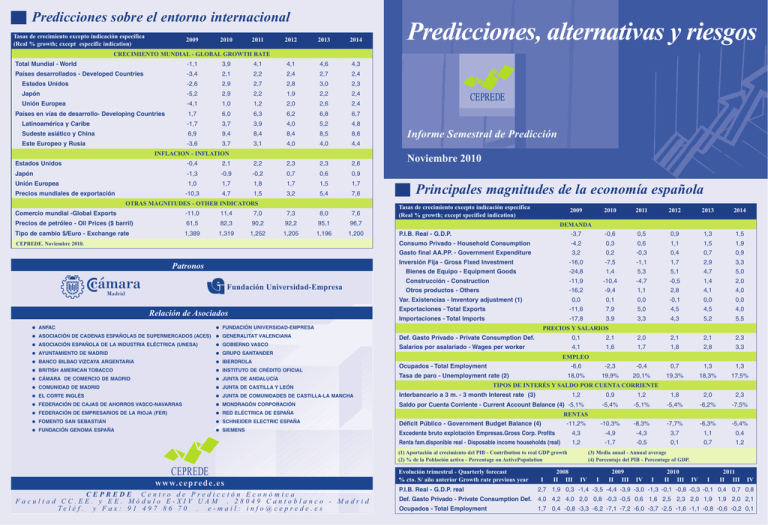
Predicciones sobre el entorno internacional Tasas de crecimiento excepto indicación específica (Real % growth; except especific indication) 2009 2010 2011 2012 2013 2014 Predicciones, alternativas y riesgos CRECIMIENTO MUNDIAL - GLOBAL GROWTH RATE Total Mundial - World -1,1 3,9 4,1 4,1 4,6 4,3 Países desarrollados - Developed Countries -3,4 2,1 2,2 2,4 2,7 2,4 Estados Unidos -2,6 2,9 2,7 2,8 3,0 2,3 Japón -5,2 2,9 2,2 1,9 2,2 2,4 Unión Europea -4,1 1,0 1,2 2,0 2,6 2,4 1,7 6,0 6,3 6,2 6,8 6,7 Latinoamérica y Caribe -1,7 3,7 3,9 4,0 5,2 4,8 Sudeste asiático y China 6,9 9,4 8,4 8,4 8,5 8,6 Este Europeo y Rusia -3,6 3,7 3,1 4,0 4,0 4,4 Países en vías de desarrollo- Developing Countries INFLACION - INFLATION Estados Unidos -0,4 2,1 2,2 2,3 2,3 2,6 Japón -1,3 -0,9 -0,2 0,7 0,6 0,9 Unión Europea Precios mundiales de exportación 1,0 1,7 1,8 1,7 1,5 1,7 -10,3 4,7 1,5 3,2 5,4 7,6 7,3 8,0 7,6 OTRAS MAGNITUDES - OTHER INDICATORS Comercio mundial -Global Exports -11,0 11,4 7,0 Precios de petróleo - Oil Prices ($ barril) 61,5 82,3 90,2 92,2 95,1 96,7 Tipo de cambio $/Euro - Exchange rate 1,389 1,319 1,252 1,205 1,196 1,200 CEPREDE. Noviembre 2010. Informe Semestral de Predicción Noviembre 2010 Principales magnitudes de la economía española Tasas de crecimiento excepto indicación específica (Real % growth; except specified indication) 2009 Fundación Universidad-Empresa = ANFAC 2012 2013 2014 -0,6 0,5 0,9 1,3 1,5 DEMANDA -3,7 Consumo Privado - Household Consumption -4,2 0,3 0,6 1,1 1,5 1,9 Gasto final AA.PP. - Government Expenditure 3,2 0,2 -0,3 0,4 0,7 0,9 -16,0 -7,5 -1,1 1,7 2,9 3,3 Bienes de Equipo - Equipment Goods -24,8 1,4 5,3 5,1 4,7 5,0 Construcción - Construction -11,9 -10,4 -4,7 -0,5 1,4 2,0 Otros productos - Others -16,2 -9,4 1,1 2,8 4,1 4,0 Var. Existencias - Inventory adjustment (1) Relación de Asociados 2011 P.I.B. Real - G.D.P. Inversión Fija - Gross Fixed Investment Patronos 2010 0,0 0,1 0,0 -0,1 0,0 0,0 Exportaciones - Total Exports -11,6 7,9 5,0 4,5 4,5 4,0 Importaciones - Total Imports -17,8 3,9 3,3 4,3 5,2 5,5 = FUNDACIÓN UNIVERSIDAD-EMPRESA PRECIOS Y SALARIOS = ASOCIACIÓN DE CADENAS ESPAÑOLAS DE SUPERMERCADOS (ACES) = GENERALITAT VALENCIANA Def. Gasto Privado - Private Consumption Def. 0,1 2,1 2,0 2,1 2,1 2,3 = ASOCIACIÓN ESPAÑOLA DE LA INDUSTRIA ELÉCTRICA (UNESA) = GOBIERNO VASCO = AYUNTAMIENTO DE MADRID = GRUPO SANTANDER Salarios por asalariado - Wages per worker 4,1 1,6 1,7 1,8 2,8 3,3 = BANCO BILBAO VIZCAYA ARGENTARIA = IBERDROLA = BRITISH AMERICAN TOBACCO = INSTITUTO DE CRÉDITO OFICIAL = CÁMARA DE COMERCIO DE MADRID = JUNTA DE ANDALUCÍA = COMUNIDAD DE MADRID = JUNTA DE CASTILLA Y LEÓN = EL CORTE INGLÉS = JUNTA DE COMUNIDADES DE CASTILLA-LA MANCHA Interbancario a 3 m. - 3 month Interest rate (3) = FEDERACIÓN DE CAJAS DE AHORROS VASCO-NAVARRAS = MONDRAGÓN CORPORACIÓN Saldo por Cuenta Corriente - Current Account Balance (4) -5,1% = FEDERACIÓN DE EMPRESARIOS DE LA RIOJA (FER) = RED ELÉCTRICA DE ESPAÑA = FOMENTO SAN SEBASTIÁN = SCHNEIDER ELECTRIC ESPAÑA = FUNDACIÓN GENOMA ESPAÑA = SIEMENS EMPLEO Ocupados - Total Employment Tasa de paro - Unemployment rate (2) -6,6 -2,3 -0,4 0,7 1,3 1,3 18,0% 19,9% 20,1% 19,3% 18,3% 17,5% TIPOS DE INTERÉS Y SALDO POR CUENTA CORRIENTE 1,2 w w w. c e p re d e . e s CEPREDE Centro de Predicción Económica Facultad CC.EE. y EE. Módulo E-XIV UAM . 28049 Cantoblanco - Madrid Te l é f . y F a x : 9 1 4 9 7 8 6 7 0 . e - m a i l : i n f o @ c e p re d e . e s 1,2 1,8 2,0 2,3 -5,1% -5,4% -6,2% -7,5% RENTAS Déficit Público - Government Budget Balance (4) -11,2% -10,3% -8,3% -7,7% -6,3% -5,4% Excedente bruto explotación Empresas.Gross Corp. Profits 4,3 -4,9 -4,3 3,7 1,1 0,4 Renta fam.disponible real - Disposable income households (real) 1,2 -1,7 -0,5 0,1 0,7 1,2 (1) Aportación al crecimiento del PIB - Contribution to real GDP growth (2) % de la Población activa - Percentage on ActivePopulation CEPREDE 0,9 -5,4% Evolución trimestral - Quarterly forecast % cto. S/ año anterior Growth rate previous year I 2008 II III (3) Media anual - Annual average (4) Porcentaje del PIB - Percentage of GDP. IV I 2009 II III IV I 2010 II III IV I 2011 II III IV P.I.B. Real - G.D.P. real 2,7 1,9 0,3 -1,4 -3,5 -4,4 -3,9 -3,0 -1,3 -0,1 -0,8 -0,3 -0,1 0,4 0,7 0,8 Def. Gasto Privado - Private Consumption Def. 4,0 4,2 4,0 2,0 0,8 -0,3 -0,5 0,6 1,6 2,5 2,3 2,0 1,9 1,9 2,0 2,1 Ocupados - Total Employment 1,7 0,4 -0,8 -3,3 -6,2 -7,1 -7,2 -6,0 -3,7 -2,5 -1,6 -1,1 -0,8 -0,6 -0,2 0,1 Escenarios alternativos de CEPREDE Comparación y revisión de predicciones Escenario de corto plazo: Mayor reactivación europea y menor efecto IVA. Short Term Scenario: Grater EU recovery and lower VAT effect CRECIMIENTO DEL PIB REAL - Real GDP growth rate Instituciones - Sources Hipótesis de simulación Simulation asumptions 09-I 09-II 09-III 09-IV 10-I 10-II 10-III 10-IV 11-I 11-II 11-III 11-IV Crecimiento del PIB (solución alternativa) - GDP growth rate (alternative) Unión Europea - EU Economías Desarolladas - Developed Countries -5,2 -4,9 -4,1 -2,1 0,6 1,7 1,8 1,8 1,9 1,9 2,0 2,0 -4,8 -4,5 -3,4 -0,7 2,4 2,8 2,3 2,1 2,4 2,5 2,7 2,6 Crecimiento del PIB (Diferencias con la solución básica) - GDP growth rate (Differences with baseline) Unión Europea - EU - - - - - - 1,0 0,9 0,9 0,8 0,8 0,7 Economías Desarolladas - Developed Countries - - - - - - 0,5 0,5 0,5 0,4 0,4 0,4 09-I 09-II 09-III 09-IV 10-I 10-II 10-III 10-IV 11-I 11-II 11-III 11-IV Principales magnitudes Main results Escenario Alternativo % Cto. / Alternative Scenario % g.r. P.I.B. Real - Real G.D.P. -3,5 -4,4 -3,9 -3,0 -1,3 -0,1 0,1 0,6 0,6 0,9 1,1 1,1 Exportaciones - Exports -16,5 -15,8 -11,0 -2,1 8,8 10,5 10,1 8,4 7,2 6,9 6,0 4,8 Ocupados - Total Employment -6,2 -7,1 -7,2 -6,0 -3,7 -2,5 -1,4 -0,6 -0,2 0,2 0,4 0,6 Diferencias con la solución básica / Differences with baseline P.I.B. Real - Real G.D.P. - - - - - - 0,9 0,9 0,7 0,4 0,4 0,3 Exportaciones - Exports - - - - - - 2,8 3,3 2,2 1,9 1,0 0,0 Ocupados - Total Employment - - - - - - 0,3 0,5 0,7 0,8 0,7 0,5 P.G.E. Grupo Santander F.M.I. La Caixa AFI Caja Madrid IFL-Carlos III Citigroup C. Europea Consensus HSBC Econ Intelligent Unit FUNCAS BBVA CEPREDE IEE Media - Mean Fecha actual predicción sep-10 oct-10 oct-10 oct-10 oct-10 oct-10 oct-10 oct-10 may-10 oct-10 oct-10 oct-10 oct-10 oct-10 oct-10 oct-10 Predicción actual - Actual Hace 6 meses - 6 month ago 2010 2011 2010 2011(*) -0,3 1,3 -0,3 1,8 -0,3 0,8 -0,4 1,1 -0,3 0,7 -0,4 0,9 -0,3 0,7 -0,4 1,5 -0,3 0,4 -0,6 0,7 -0,3 0,4 -0,5 1,1 -0,3 0,3 -0,4 0,7 -0,3 -0,1 -0,4 1,1 -0,4 0,8 -0,8 1,0 -0,4 0,6 -0,4 1,0 -0,4 0,6 -0,3 1,2 -0,4 0,6 -0,1 0,8 -0,4 0,4 -0,7 0,8 -0,5 0,7 -0,8 -0,6 0,5 -0,3 0,9 -0,9 0,5 -0,8 -0,4 0,6 -0,5 1,0 Revisión - Change 2010 2011 0,0 -2,1 0,1 -1,4 0,1 -1,2 0,1 -1,8 0,3 -1,0 0,2 -1,4 0,1 -1,0 0,1 -1,4 0,4 -1,4 0,0 -1,4 -0,1 -1,6 -0,3 -1,2 0,3 -1,2 0,3 -0,3 -1,5 -0,1 0,1 -1,4 INFLACIÓN - INFLATION CEPREDE. Noviembre 2010 Escenario de largo plazo: Mayor presencia en los mercados internacionales. Long Term Scenario: Increasing global export market share. Hipótesis de simulación Simulation asumptions 2009 2010 2011 2012 2013 2014 2015 2016 2017 2018 2019 2020 Comercio exterior (solución alternativa) - Foreign Trade (alternative) Cuota de comercio mundial - World Trade Share 1,90 1,94 1,91 1,89 1,86 1,83 1,83 1,82 1,82 1,82 1,82 1,81 % Cto. Exportaciones - Exports growth rate -11,6 9,5 6,2 6,1 6,4 6,0 6,8 7,0 6,2 5,9 5,2 4,8 Comercio exterior (diferencias con la solución básica) - Foreign Trade (diffrences with baseline) Cuota de comercio mundial - World Trade Share 0,00 0,03 0,05 0,08 0,11 0,14 0,17 0,20 0,23 0,26 0,29 0,32 % Cto. Exportaciones - Exports growth rate 0,0 1,6 1,3 1,6 1,9 2,0 2,2 1,9 2,0 2,1 1,9 1,9 2009 2010 2011 2012 2013 2014 2015 2016 2017 2018 2019 2020 Principales magnitudes Main results Escenario Alternativo % Cto. / Alternative Scenario % g.r. P.I.B. Real (% Cto.) - Real G.D.P. (% g.r.) -3,7 -0,2 0,9 1,5 2,0 2,1 2,8 3,0 2,9 2,7 2,5 2,4 Ocupados (% Cto.) - Total Employment (% g.r.) -6,6 -2,1 0,3 1,3 1,9 2,0 2,3 2,2 1,7 1,3 1,2 1,2 Tasa de paro- Unemployment rate 18,0% 19,7% 19,5% 18,3% 16,8% 15,7% 14,5% 13,9% 13,6% 13,3% 12,9% 12,2% Déficit público (%PIB) - Government Balance (%GDP) -11,2% -10,0% -7,9% -7,0% -5,4% -4,2% -2,7% -1,7% -1,0% -0,3% 0,0% 0,2% Balanza por c.c (% PIB)- Current Acc. Bal. (%GDP) -5,1% -5,2% -5,2% -5,6% -6,5% -6,9% -7,0% -7,5% -7,8% -8,0% -7,8% -5,2% Instituciones - Sources Fecha actual predicción Grupo Santander FUNCAS BBVA Caja Madrid La Caixa CEPREDE (*) IFL-Carlos III Citigroup C. Europea Consensus AFI F.M.I. Econ Intelligent Unit Media - Mean oct-10 oct-10 oct-10 oct-10 oct-10 oct-10 oct-10 oct-10 abr-10 oct-10 oct-10 oct-10 oct-10 Predicción actual - Actual Hace 6 meses - 6 month ago 2010 2011 2010 2011 1,7 1,7 1,7 1,7 1,7 1,7 1,7 1,7 1,6 1,6 1,6 1,5 1,1 1,6 1,7 1,5 1,4 1,4 1,4 1,4 1,3 1,0 1,6 1,4 1,4 1,1 0,9 1,3 1,6 1,2 1,6 1,2 1,3 1,8 1,5 1,3 0,8 1,3 1,1 1,2 0,8 1,3 2,0 1,3 1,7 1,1 2,1 1,5 1,0 2,0 1,6 2,1 1,1 1,5 1,6 Revisión - Change 2010 2011 0,1 0,5 0,1 0,5 0,4 -0,1 0,2 0,4 0,8 0,3 0,5 0,3 0,3 0,3 -0,3 0,2 -0,3 0,3 -0,7 -0,2 0,0 -0,4 -0,2 -0,7 0,0 -0,6 -0,2 (*) Deflactor consumo privado - Priv. Consumption def. OTRAS PREDICCIONES DE CEPREDE - OTHER FORECASTS Magnitudes Noviembre 2010 Predicción actual - Actual 2010 2011 Hace 6 meses - 6 month ago 2010 2011 Revisión - Change 2010 2011 Diferencias con la solución básica / Differences with baseline P.I.B. Real - Real G.D.P. 0,0 0,5 0,5 0,6 0,7 0,7 0,7 0,7 0,8 0,9 1,0 1,1 Ocupados (% Cto.) - Total Employment (% g.r.) 0,0 0,2 0,7 0,6 0,7 0,6 0,6 0,6 0,6 0,7 0,8 1,0 Tasa de paro- Unemployment rate 0,0% -0,2% -0,6% -1,0% -1,4% -1,8% -2,2% -2,4% -2,8% -3,2% -3,6% -4,2% Déficit público (%PIB) - Government Balance (%GDP) 0,0% 0,2% 0,4% 0,7% 0,9% 1,1% 1,3% 1,5% 1,7% 2,0% 2,2% 2,6% Balanza por c.c (% PIB)- Current Acc. Bal. (%GDP) 0,0% 0,1% -0,1% 0,2% 0,6% 1,0% 1,4% 1,7% 2,1% 2,4% 2,6% 2,9% -2,3 19,9% 1,319 0,4 -5,4% -10,3% -0,4 20,1% 1,252 0,6 -5,1% -8,3% -2,0 19,2% 1,274 0,9 -5,3% -11,4% -0,2 18,8% 1,198 1,7 -4,5% -10,4% -0,3 0,7% 0,045 -0,5 -0,1% 1,1% -0,2 1,3% 0,054 -1,0 -0,6% 2,1% (1) % Cto. - Growth rate (2) % del PIB - % GDP CEPREDE. Noviembre 2010 CEPREDE Centro de Predicción Económica Ocupados - Employment (1) Tasa de Paro - Unemployment rate Tipo de cambio $/Euro Rate Interbancario a 3 m. - Interest rate Saldo por c.c.- Curr. Account Bal. (2) Déficit Público - Goverment balance (2) Noviembre 2010 CEPREDE Centro de Predicción Económica Noviembre 2010

