en otra ventana
Anuncio

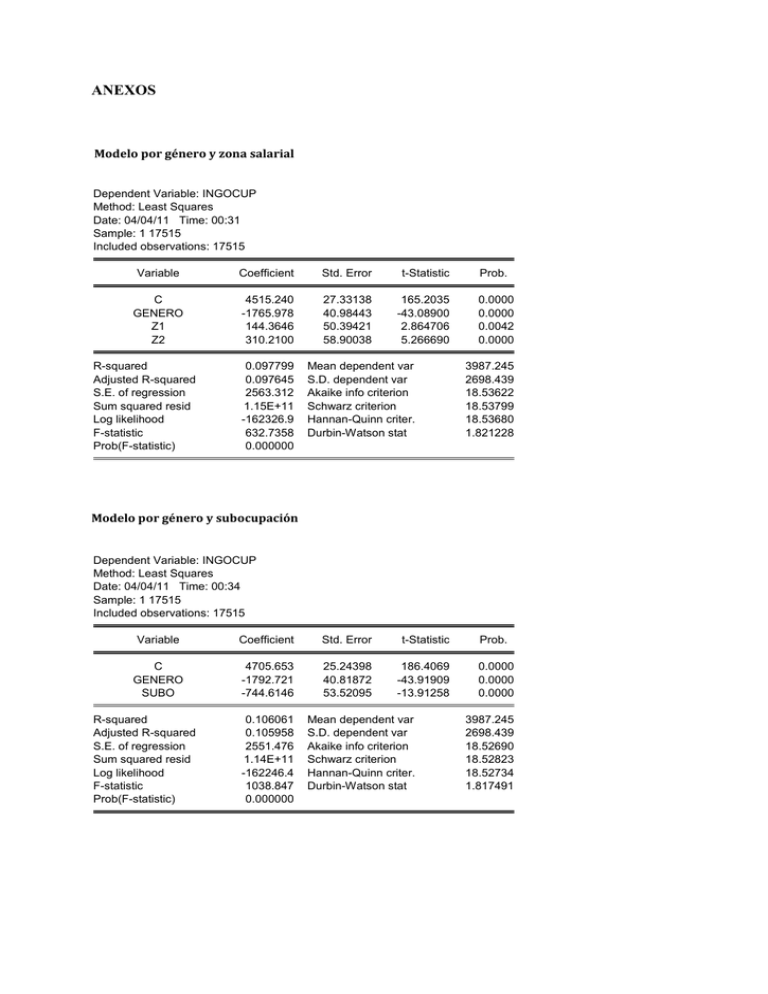
ANEXOS Modelo por género y zona salarial Dependent Variable: INGOCUP Method: Least Squares Date: 04/04/11 Time: 00:31 Sample: 1 17515 Included observations: 17515 Variable Coefficient Std. Error t-Statistic Prob. C GENERO Z1 Z2 4515.240 -1765.978 144.3646 310.2100 27.33138 40.98443 50.39421 58.90038 165.2035 -43.08900 2.864706 5.266690 0.0000 0.0000 0.0042 0.0000 R-squared Adjusted R-squared S.E. of regression Sum squared resid Log likelihood F-statistic Prob(F-statistic) 0.097799 0.097645 2563.312 1.15E+11 -162326.9 632.7358 0.000000 Mean dependent var S.D. dependent var Akaike info criterion Schwarz criterion Hannan-Quinn criter. Durbin-Watson stat 3987.245 2698.439 18.53622 18.53799 18.53680 1.821228 Modelo por género y subocupación Dependent Variable: INGOCUP Method: Least Squares Date: 04/04/11 Time: 00:34 Sample: 1 17515 Included observations: 17515 Variable Coefficient Std. Error t-Statistic Prob. C GENERO SUBO 4705.653 -1792.721 -744.6146 25.24398 40.81872 53.52095 186.4069 -43.91909 -13.91258 0.0000 0.0000 0.0000 R-squared Adjusted R-squared S.E. of regression Sum squared resid Log likelihood F-statistic Prob(F-statistic) 0.106061 0.105958 2551.476 1.14E+11 -162246.4 1038.847 0.000000 Mean dependent var S.D. dependent var Akaike info criterion Schwarz criterion Hannan-Quinn criter. Durbin-Watson stat 3987.245 2698.439 18.52690 18.52823 18.52734 1.817491

