- 1 - EVOLUCIÓN DE VARIABLES DE GENERACIÓN – DICIEMBRE
Anuncio

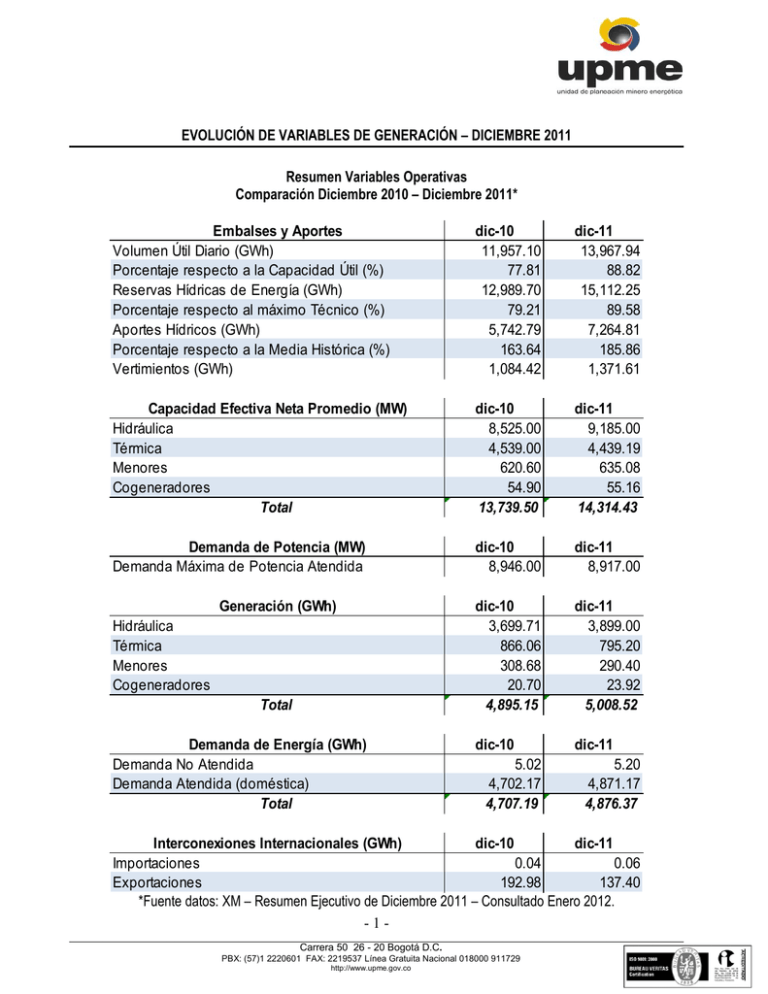
EVOLUCIÓN DE VARIABLES DE GENERACIÓN – DICIEMBRE 2011 Resumen Variables Operativas Comparación Diciembre 2010 – Diciembre 2011* Embalses y Aportes Volumen Útil Diario (GWh) Porcentaje respecto a la Capacidad Útil (%) Reservas Hídricas de Energía (GWh) Porcentaje respecto al máximo Técnico (%) Aportes Hídricos (GWh) Porcentaje respecto a la Media Histórica (%) Vertimientos (GWh) dic-10 11,957.10 77.81 12,989.70 79.21 5,742.79 163.64 1,084.42 dic-11 13,967.94 88.82 15,112.25 89.58 7,264.81 185.86 1,371.61 Capacidad Efectiva Neta Promedio (MW) Hidráulica Térmica Menores Cogeneradores Total dic-10 8,525.00 4,539.00 620.60 54.90 13,739.50 dic-11 9,185.00 4,439.19 635.08 55.16 14,314.43 Demanda de Potencia (MW) Demanda Máxima de Potencia Atendida dic-10 8,946.00 dic-11 8,917.00 dic-10 3,699.71 866.06 308.68 20.70 4,895.15 dic-11 3,899.00 795.20 290.40 23.92 5,008.52 dic-10 dic-11 Generación (GWh) Hidráulica Térmica Menores Cogeneradores Total Demanda de Energía (GWh) Demanda No Atendida Demanda Atendida (doméstica) Total 5.02 4,702.17 4,707.19 5.20 4,871.17 4,876.37 Interconexiones Internacionales (GWh) dic-10 dic-11 Importaciones 0.04 0.06 Exportaciones 192.98 137.40 *Fuente datos: XM – Resumen Ejecutivo de Diciembre 2011 – Consultado Enero 2012. -1Carrera 50 26 - 20 Bogotá D.C. PBX: (57)1 2220601 FAX: 2219537 Línea Gratuita Nacional 018000 911729 http://www.upme.gov.co Capacidad Efectiva Neta del Sistema de Interconexión Nacional Diciembre 2011 (MW)* Participacion de tipo de planta generadoras (%) 4.4% 0.4% Hidráulica 31.0% Térmica Menores Cogeneradores 64.2% *Fuente datos: XM – Resumen Ejecutivo de Diciembre 2011 – Consultado Enero 2012. Generación de Energía Eléctrica (GWh) Enero 2011 – Diciembre 2011* Mes Hidráulica (GWh) Gas (GWh) Carbón (GWh) Menores (GWh) Cogeneración (GWh) ACPM-FOIL (GWh) Total (GWh) ene-11 3,635.72 703.37 175.89 292.67 25.21 9.70 4,842.57 feb-11 3,374.97 670.83 183.09 225.82 19.68 5.87 4,480.27 mar-11 3,995.81 543.29 195.14 291.83 23.99 2.41 5,052.47 abr-11 3,692.12 537.67 115.11 306.69 19.96 9.49 4,681.04 may-11 4,024.01 483.67 70.44 314.82 25.19 4.00 4,922.13 jun-11 3,804.28 503.45 124.42 292.13 20.78 2.52 4,747.57 jul-11 3,819.86 565.48 120.81 308.48 30.27 15.81 4,860.71 ago-11 3,826.15 732.16 167.61 245.73 34.95 26.49 5,033.09 sep-11 3,796.19 753.30 118.74 231.19 33.88 16.94 4,950.24 oct-11 3,877.36 716.72 127.36 269.08 33.72 8.20 5,032.44 nov-11 3,837.60 742.69 128.71 267.86 25.32 7.11 5,009.29 dic-11 3,899.00 689.26 104.78 290.44 23.92 1.17 5,008.57 *Fuente datos: XM – Sistema de información OPESIN – Consultado Enero 2012. -2Carrera 50 26 - 20 Bogotá D.C. PBX: (57)1 2220601 FAX: 2219537 Línea Gratuita Nacional 018000 911729 http://www.upme.gov.co Comportamiento del Sistema de Generación Eléctrica Enero 2010 – Diciembre 2011* Generación de Energía Eléctrica Febrero2010 - Enero2012 6500 6000 Energia generada (GWh) 5500 5000 4500 4000 3500 3000 2500 2000 1500 1000 500 Hidráulica (GWh) Gas (GWh) nov-11 sep-11 jul-11 may-11 mar-11 ene-11 nov-10 sep-10 jul-10 may-10 mar-10 ene-10 0 Carbón (GWh) *Fuente datos: XM – Sistema de información OPESIN – Consultado Enero 2012. Evolución Mensual del Embalse Agregado Nacional (%) Enero 2007 – Diciembre 2011* Evolución Mensual del Embalse Agregado Nacional 100 90 Volumen (%) 80 70 60 50 40 30 20 Ene Feb Mar 2006 Abr 2007 May 2008 Jun Jul 2009 Ago 2010 Sep Oct Nov Dic 2011 *Fuente datos: XM – Sistema de información OPESIN – Consultado Enero 2012. -3Carrera 50 26 - 20 Bogotá D.C. PBX: (57)1 2220601 FAX: 2219537 Línea Gratuita Nacional 018000 911729 http://www.upme.gov.co Tendencia de aportes Mensuales (%) Enero 1992 – Diciembre 2011* Evolución Mensual Aporte Total SIN 280% % DE MEDIA HISTÓRICA 240% 200% 160% 120% 80% 40% 0% Ene Feb Mar Abr May 1992 1998 Jun Jul 2004 Ago 2009 Sep Oot 2010 Nov Dic 2011 *Fuente datos: XM – Sistema de información OPESIN – Consultado Enero 2012. Nivel de Embalses (%) Comparación Diciembre 2010 – Diciembre 2011* FECHA 31/12/2010 31/12/2011 BETANIA 95.92 94.41 ESMERALDA 96.68 97.17 GUAVIO 74.94 95.18 Variación -1.6% 0.5% 27.0% EL PEÑOL PRADO 101.22 107.99 101.29 109.32 0.1% 1.2% SALVAJINA 70.88 87.64 URRA1 91.07 89.95 23.6% -1.2% *Fuente datos: XM – Sistema de información Neón – Consultado Enero 2012. -4Carrera 50 26 - 20 Bogotá D.C. PBX: (57)1 2220601 FAX: 2219537 Línea Gratuita Nacional 018000 911729 http://www.upme.gov.co Comportamiento de los Principales Embalses Enero 2010 – Diciembre 2011* BETANIA ESMERALDA GUAVIO EL PEÑOL PRADO SALVAJINA URRA1 140 Volumen de embalse (%) 120 100 80 60 40 20 nov-11 dic-11 nov-11 dic-11 ago-11 jul-11 jun-11 may-11 URRA1 oct-11 MIEL 1 abr-11 feb-11 mar-11 ene-11 BETANIA oct-11 ESMERALDA sep-11 GUAVIO dic-10 nov-10 oct-10 sep-10 jul-10 ago-10 AGREGADO EEB sep-11 PENOL jun-10 abr-10 may-10 feb-10 mar-10 ene-10 0 OTROS EMBALSES 18,000.00 16,000.00 14,000.00 10,000.00 8,000.00 6,000.00 4,000.00 2,000.00 ago-11 jul-11 jun-11 may-11 abr-11 mar-11 feb-11 ene-11 dic-10 nov-10 oct-10 sep-10 ago-10 jul-10 jun-10 may-10 abr-10 mar-10 feb-10 0.00 ene-10 ENERGIA (GWh) 12,000.00 *Fuente datos: XM – Sistema de información Neón – Consultado Enero 2012. . -5Carrera 50 26 - 20 Bogotá D.C. PBX: (57)1 2220601 FAX: 2219537 Línea Gratuita Nacional 018000 911729 http://www.upme.gov.co Aportes Hídricos Diarios del Sistema Interconectado Nacional (GWh) Enero 2010 – Diciembre 2011* Aportes hidricos diarios 700000 600000 Energia (MWh) 500000 400000 300000 200000 100000 dic-11 nov-11 oct-11 sep-11 ago-11 jul-11 jun-11 may-11 abr-11 mar-11 feb-11 ene-11 dic-10 oct-10 nov-10 sep-10 ago-10 jul-10 jun-10 may-10 abr-10 feb-10 mar-10 ene-10 0 Fuente datos: XM – Sistema de información Neón – Consultado Enero 2012. Evolución del Consumo de Combustibles (MBTU) Enero 2010 – Diciembre 2011* GAS CARBON TOTAL 900,000.00 800,000.00 700,000.00 600,000.00 500,000.00 400,000.00 300,000.00 200,000.00 100,000.00 0.00 * Fuente datos: XM – Sistema de información Neón – Consultado Enero 2012. -6Carrera 50 26 - 20 Bogotá D.C. PBX: (57)1 2220601 FAX: 2219537 Línea Gratuita Nacional 018000 911729 http://www.upme.gov.co Proyecciones de Demanda de Energía Eléctrica (GWh)* ene-12 feb-12 mar-12 abr-12 may-12 jun-12 jul-12 ago-12 sep-12 oct-12 nov-12 dic-12 ene-13 feb-13 mar-13 abr-13 may-13 jun-13 jul-13 ago-13 sep-13 oct-13 nov-13 dic-13 Demanda Regulada (GWh/mes) 3241 3155 3379 3220 3374 3263 3346 3406 3345 3434 3396 3503 3371 3248 3444 3446 3542 3398 3510 3557 3490 3596 3571 3584 Demanda No Regulada Demanda Nacional Participación Demanda Participación Demanda (GWh/mes) (GWh/mes) Regulada No Reg 1588 4829 67.1% 32.9% 1487 4643 68.0% 32.0% 1612 4991 67.7% 32.3% 1547 4767 67.5% 32.5% 1622 4996 67.5% 32.5% 1550 4812 67.8% 32.2% 1607 4953 67.6% 32.4% 1635 5041 67.6% 32.4% 1573 4917 68.0% 32.0% 1638 5072 67.7% 32.3% 1533 4929 68.9% 31.1% 1592 5095 68.8% 31.2% 1580 4951 68.1% 31.9% 1463 4710 68.9% 31.1% 1599 5043 68.3% 31.7% 1605 5051 68.2% 31.8% 1631 5173 68.5% 31.5% 1561 4960 68.5% 31.5% 1626 5136 68.3% 31.7% 1644 5201 68.4% 31.6% 1616 5107 68.3% 31.7% 1652 5248 68.5% 31.5% 1518 5089 70.2% 29.8% 1648 5232 68.5% 31.5% *Fuente: UPME – Proyecciones Noviembre 2012 -7Carrera 50 26 - 20 Bogotá D.C. PBX: (57)1 2220601 FAX: 2219537 Línea Gratuita Nacional 018000 911729 http://www.upme.gov.co Proyecciones de Potencia Máxima Anual (MW)* 2010 2011 2012 2013 2014 2015 2016 2017 2018 2019 2020 2021 2022 2023 2024 2025 2026 2027 2028 2029 2030 2031 POTENCIA MÁXIMA ANUAL (MW) Esc Alt Esc Medio Esc Bajo 9100 9100 9100 9570 9233 9176 9918 9719 9540 10344 10013 9608 10656 10215 9834 11140 10591 10101 11576 10926 10344 12009 11246 10570 12557 11660 10870 13135 12113 11213 13705 12538 11515 14372 13039 11882 15056 13545 12244 15580 13974 12528 16226 14509 12935 16906 15040 13370 17571 15551 13769 18256 16086 14170 18975 16646 14595 19716 17214 15026 20499 17811 15477 21308 18427 15937 TASA DE CRECIMIENTO Esc Alt Esc Medio Esc Bajo -2.0% -2.0% -2.0% 5.2% 1.5% 0.8% 3.6% 5.3% 4.0% 4.3% 3.0% 0.7% 3.0% 2.0% 2.4% 4.5% 3.7% 2.7% 3.9% 3.2% 2.4% 3.7% 2.9% 2.2% 4.6% 3.7% 2.8% 4.6% 3.9% 3.2% 4.3% 3.5% 2.7% 4.9% 4.0% 3.2% 4.8% 3.9% 3.0% 3.5% 3.2% 2.3% 4.1% 3.8% 3.2% 4.2% 3.7% 3.4% 3.9% 3.4% 3.0% 3.9% 3.4% 2.9% 3.9% 3.5% 3.0% 3.9% 3.4% 3.0% 4.0% 3.5% 3.0% 3.9% 3.5% 3.0% *Fuente: UPME – Proyecciones Noviembre 2012 -8Carrera 50 26 - 20 Bogotá D.C. PBX: (57)1 2220601 FAX: 2219537 Línea Gratuita Nacional 018000 911729 http://www.upme.gov.co Precio Promedio En Bolsa y Contratos ($/kWh) Enero 2007 – Diciembre 2011* 220 200 180 160 140 COP/kWh 120 100 80 60 40 20 ene-07 mar-07 may-07 jul-07 sep-07 nov-07 ene-08 mar-08 may-08 jul-08 sep-08 nov-08 ene-09 mar-09 may-09 jul-09 sep-09 nov-09 ene-10 mar-10 may-10 jul-10 sep-10 nov-10 ene-11 mar-11 may-11 jul-11 sep-11 nov-11 0 BOLSA NACIONAL CONTRATOS DESPACHADOS * Fuente datos: XM – Sistema de información Neón – Consultado Enero 2012. Precio en Bolsa Diario ($/kWh) Enero 2011 – Diciembre 2011* Precio promedio bolsa Precio promedio contrato 140 120 80 60 40 * Fuente datos: XM – Sistema de información Neón – Consultado Enero 2012. -9Carrera 50 26 - 20 Bogotá D.C. PBX: (57)1 2220601 FAX: 2219537 Línea Gratuita Nacional 018000 911729 http://www.upme.gov.co dic-11 nov-11 oct-11 sep-11 ago-11 jul-11 jun-11 may-11 may-11 abr-11 mar-11 ene-11 20 ene-11 $/kWh 100 Evolución de Las Exportaciones de Electricidad hacia Ecuador y Venezuela (GWh) Enero 2007 – Diciembre 2011* 300 200 150 100 EXPORTACIONES A VENEZUELA * Fuente datos: XM – Sistema de información Neón – Consultado Enero 2012. - 10 Carrera 50 26 - 20 Bogotá D.C. PBX: (57)1 2220601 FAX: 2219537 Línea Gratuita Nacional 018000 911729 http://www.upme.gov.co nov-2011 jul-2011 sep-2011 may-2011 ene-2011 mar-2011 nov-2010 jul-2010 sep-2010 may-2010 ene-2010 mar-2010 nov-2009 jul-2009 sep-2009 may-2009 ene-2009 EXPORTACIONES A ECUADOR mar-2009 nov-2008 jul-2008 sep-2008 may-2008 ene-2008 mar-2008 nov-2007 jul-2007 sep-2007 ene-2007 0 may-2007 50 mar-2007 Energía (GWh) 250


