Devaluation and Inflation dynamics in Argentina
Anuncio
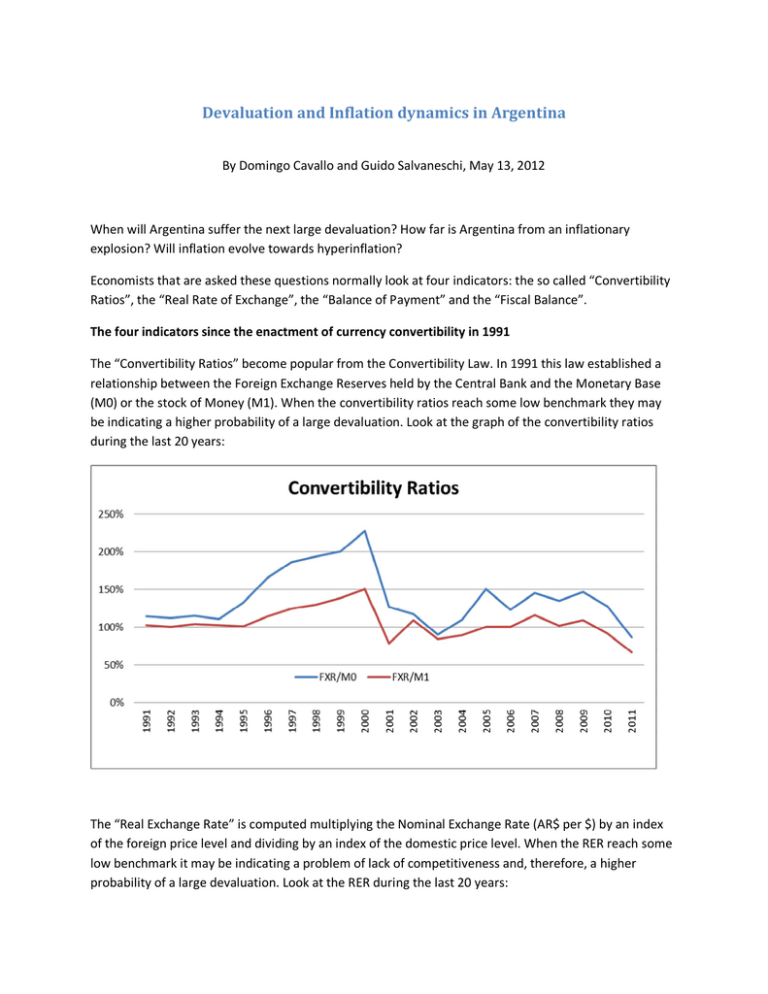
Devaluation and Inflation dynamics in Argentina By Domingo Cavallo and Guido Salvaneschi, May 13, 2012 When will Argentina suffer the next large devaluation? How far is Argentina from an inflationary explosion? Will inflation evolve towards hyperinflation? Economists that are asked these questions normally look at four indicators: the so called “Convertibility Ratios”, the “Real Rate of Exchange”, the “Balance of Payment” and the “Fiscal Balance”. The four indicators since the enactment of currency convertibility in 1991 The “Convertibility Ratios” become popular from the Convertibility Law. In 1991 this law established a relationship between the Foreign Exchange Reserves held by the Central Bank and the Monetary Base (M0) or the stock of Money (M1). When the convertibility ratios reach some low benchmark they may be indicating a higher probability of a large devaluation. Look at the graph of the convertibility ratios during the last 20 years: The “Real Exchange Rate” is computed multiplying the Nominal Exchange Rate (AR$ per $) by an index of the foreign price level and dividing by an index of the domestic price level. When the RER reach some low benchmark it may be indicating a problem of lack of competitiveness and, therefore, a higher probability of a large devaluation. Look at the RER during the last 20 years: The “Balance of Payment” equals the Change in Foreign Reserves held by the Central Bank. A large negative Balance of Payment indicates capital flight and may be preannouncing a higher risk of devaluation. Look at the graph of the Balance of Payment during the last 20 years: The fourth indicator refers to the “Fiscal Balance”. Positive numbers represent fiscal surpluses and negative numbers fiscal deficits. By comparing these four set of indicators with the annual Rate of Devaluation (percentage increase in the price of the $ in AR$) during the last 20 years, economists are tempted to predict a large devaluation in the near future. Look at the annual rate of devaluation during the las 20 years: The large devaluation of 2002 happened when the Convertibility Ratios reached a benchmark not far from the one that they are close to right now, when the Real Exchange Rate was almost as low as it is now and after a negative Balance of Payment only slightly large than that of 2011. But do not rush to the conclusion that there will soon be a large devaluation! There are several differences with the reality of 2001 and that of 2011. One crucial difference is that during the period 1991-2001 there was completely free movement of foreign capital. Since 2007, and particularly during the last year, exchange controls have prevented capital movements. These is clearly seen in the graph of the Black Market Margin, that is the percentage difference between the rate of foreign exchange in the black (now called “blue”) market and in the official market. Look at this graph: The second crucial difference relates to the Foreign Terms of Trade (the price of exports divided by the price of imports). Look at it evolution during the last 20 years: The existence of exchange controls (reflected in the black market margin) and the very favorable terms of trade (in comparison with those of the period 1991-2001) make less likely that there will be a large devaluation in the official exchange market. The following are more precise question than those posed at the beginning of this note: How large could the black market premium become before the government is obliged to let the official exchange rate to jump to the level of the exchange rate in the black market? Could a sudden deterioration of the foreign terms of trade force devaluation in the official exchange rate much sooner? In any case, what would happen with inflation before and after the large devaluation? Is there a high risk of hyperinflation? To answer these questions it is necessary to look at the historical experience of the period 1970 to 1990, when there was pervasive foreign exchange control, foreign terms of trade experienced large changes but not always in the same direction and large devaluations provoked significant inflationary effects. By the end of the period, Argentina suffered hyperinflation. Devaluation and Inflation in a longer historical perspective: 1970 until the present Looking at the plot of the annual rate of devaluation during the period since 1970 it is possible to identify the large devaluation episodes that could help to evaluate the risk of devaluation and hyperinflation in 2012 and afterward. Three main large devaluation episodes prior to the monetary reform of 1991 can be identified in the graph: 1975-1976 (the so called “Rodrigazo”), 1982-1984 (the “Post Malvinas War” monetary collapse) and 1989-1990 (the “Hyperinflation”). In the periods that preceded these three large devaluation episodes the Convertibility ratios were much lower than the lowest levels observed during the last two decades. Look at the plot that displays the convertibility ratios for the extended period: The Foreign Terms of Trade and the Real Rate of Exchange were much more variable than during the last two decades. The Foreign Terms of Trade had been quite high between 1970 and 1974 but fall sharply in 1975 and afterwards the trend was downward most of the years until 2002. The Real Rate of Exchange had fallen below the level of the 90’s before the devaluation episodes of 1975-1976 and 1882-1983 but it was much higher before the 1989-1990 episode. Look at the plot: The Balance of Payment had shown negligible negative figures before the first large devaluation episode and persistent negative figures during most of the years before and after the other two large devaluation episodes. The most striking difference between the large evaluation episodes of the 70’s and 80’s and those of the last two decades relates to the Black Market Margins and the Fiscal Balance. The Black Market Margins were much higher during the years immediately before the “Rodrigazo” and also relatively higher immediately before and during the other two episodes of large devaluations. The fiscal Deficits were much larger and persistent during the first two decades of the extended period. Look at the plots: Devaluation and Inflation The dynamic of inflation has been closely related to the large devaluations all along the extended period. Look at the graphs of devaluation and inflation rates. After the large devaluation of 1975, inflation jumped up to several hundred percent per anon and went down slighted below 100% in only two opportunities: 1981 and 1986, the years following the two only stabilization attempts during the 80’s. After each large devaluation episode, the demand for money went down one step further aggravating the inflationary effect of the monetary financing of fiscal deficits. During the years that followed the introduction of convertibility in 1991, Inflation dynamics changed in two senses: first, inflation was drastically reduced following exchange rate stabilization, something that had never happened during the 70’s and 80’s and, second, the inflationary impact of the large devaluation of 2002 spread over a 10 year period instead of the very rapid pass through of the previous decades. These two phenomena demonstrates that the dynamic of inflation continues to be related to the nominal exchange rate, but after the decade of price stability there are much longer lags between currency devaluation and inflation. The demand for money has remained fairly high after the devaluation of 2002. This shows a big contrast with the behavior during the 70’s and 80’s, when after each large devaluation episodes there was a new step down in the demand for money. For the time being the monetary financing of fiscal deficits is not producing the high inflationary impact that was observed after between 1975 and 1990. Summing up The large devaluation episodes during periods of exchange controls were preceded by black market margins much larger than those observed nowadays in Argentina. The fiscal situation prior the large devaluations was much weaker during the 70’s and 80’s that has been during the last two decades. The “Rodrigazo” occurred at the time of a sharp decline in Foreign Terms of Trade following a period of very favorable external conditions. The other devaluation episodes occurred when Terms of Trade were significantly less favorable that those that prevail today. Price stability during the 90’s achieved through currency convertibility had lasting stabilizing effects, even after the large devaluation of 2002. As a consequence, the probability of a large devaluation episode with explosive effects on inflation is nowadays much lower than what it was during the preconvertibility years. This does not mean that a new “Rodrigazo” is completely out of the scene: if the black market margin continues to increase and the demand for money starts to go down, the explosive monetary mechanism of the early seventies may be activated as soon as the foreign terms of trade suffer a sudden deterioration. Even if there was an inflationary explosion like that of 1975, the probability of such an episode to turn into Hyperinflation 1989-1990 style is much lower than in the 80’s because the fiscal situation if far from being as bad as it was during the 70’s and 80’s.
