An Inventory of My Traits - Genetics
Anuncio
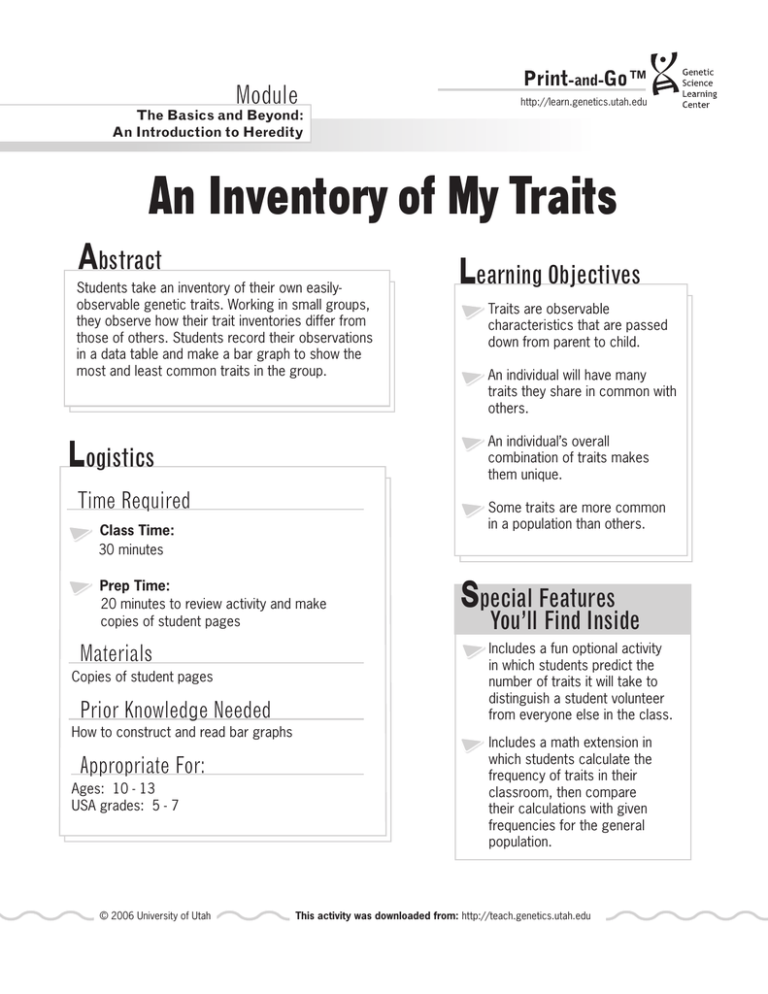
Module The Basics and Beyond: An Introduction to Heredity Print-and-Go™ http://learn.genetics.utah.edu An Inventory of My Traits Abstract Students take an inventory of their own easilyobservable genetic traits. Working in small groups, they observe how their trait inventories differ from those of others. Students record their observations in a data table and make a bar graph to show the most and least common traits in the group. Logistics Prep Time: 20 minutes to review activity and make copies of student pages Prior Knowledge Needed How to construct and read bar graphs Appropriate For: Ages: 10 - 13 USA grades: 5 - 7 © 2006 University of Utah An individual will have many traits they share in common with others. Some traits are more common in a population than others. Class Time: 30 minutes Copies of student pages Traits are observable characteristics that are passed down from parent to child. An individual’s overall combination of traits makes them unique. Time Required Materials Learning Objectives Special Features You’ll Find Inside Includes a fun optional activity in which students predict the number of traits it will take to distinguish a student volunteer from everyone else in the class. Includes a math extension in which students calculate the frequency of traits in their classroom, then compare their calculations with given frequencies for the general population. This activity was downloaded from: http://teach.genetics.utah.edu Print-and-Go™ Module The Basics and Beyond: An Introduction to Heredity http://learn.genetics.utah.edu An Inventory of My Traits Classroom Implementation Quantities Activity instructions: • Begin by demonstrating one of the traits listed in An Inventory of My Traits: Survey (page S-1). Ask students who possess this trait to stand. Point out the relative numbers of students standing and sitting for the trait. Continue this process with 2-3 more traits. Per Student One copy of student pages S-1 to S-3 • Explain that traits are observable characteristics we inherit from our parents. Some traits are common in a population (our class) while others are not. And, every person has a different overall combination of traits that makes them unique. • Divide students into groups of four or more. Have each student in the group complete An Inventory of My Traits: Survey (page S-1) to determine their unique combination of the traits described. • After students complete the survey, have them tally their group information on the data table (page S-2) and draw a bar graph (page S-3). • Optional: You may collect the traits data from the whole class by creating a large wall chart (see example on the left). Have a representative from each group fill in their data. Once all the data has been collected, have the students make a bar graph from the class data or make one large graph together. Optional activity: • Ask students to predict how many traits they would have to look at on the Survey in order to identify any given classmate as unique. • Select a volunteer who would like to determine his or her uniqueness. Ask all students to stand. • Have the volunteer call out one of their traits at a time, beginning with question 1 on the Survey and continuing in sequence. For each trait, direct all students who do not share that trait to sit down; students who share the trait remain standing. Once a student sits down, they do not get up again. © 2006 University of Utah Common Misconceptions Students may think that the more common traits are “better”, but this is not always the case. Sometimes traits simply show up more frequently in the human population. More advanced students may think that dominant traits are more common than recessive traits. However, frequency has very little to do with whether a trait is dominant or recessive. That is, a dominant trait is not necessarily more common and a recessive trait is not necessarily rare in a population. This activity was downloaded from: http://teach.genetics.utah.edu 1 Print-and-Go™ Module The Basics and Beyond: An Introduction to Heredity http://learn.genetics.utah.edu An Inventory of My Traits • Continue in this way until the volunteer is the only one standing. Count the number of traits it took to distinguish the volunteer from everyone else in the class. Compare this number with the students’ predictions. • Repeat with several additional volunteers. Math extension: • Have students practice converting fractions to decimals, then decimals into percentages by calculatig the frequency of the following traits in your classroom: tongue rolling, handedness and hand clasping. ∙ Students can then compare their calculated frequencies with those for the general population (provided in the table below). Example: # of students with the trait/# of students in the class x 100 = ________% 15 tongue rollers / 21 students in the class x 100 = 71% Trait Tongue rolling Handedness Hand clasping Frequency in General Population* Can roll tongue – 70% Cannot roll tongue – 30% Right handed – 93% Left handed – 7% Left thumb on top – 55% Right thumb on top – 44% No preference – 1% *Frequencies for traits are from Online Mendelian Inheritance In Man (see http://www.ncbi.nlm.nih.gov/ omim/). Standards U.S. National Science Education Standards Grades 5-8: Content Standard C: Life Science - Reproduction and Heredity • Every organism requires a set of instructions for specifying its traits. Heredity is the passage of these instructions from one generation to another. • The characteristics of an organism can be described in terms of a combination of traits. AAAS Benchmarks for Science Literacy Grades 3-5: The Living Environment: Heredity - Some likenesses between children and parents, such as eye color in human beings, or fruit or flower color in plants, are inherited. Other likenesses, such as people’s table manners or carpentry skills, are learned. © 2006 University of Utah This activity was downloaded from: http://teach.genetics.utah.edu 2 Print-and-Go™ Module The Basics and Beyond: An Introduction to Heredity http://learn.genetics.utah.edu An Inventory of My Traits For offspring to resemble their parents, there must be a reliable way to transfer information from one generation to the next. Credits Activity created by: Molly Malone, Genetic Science Learning Center April Mitchell, Genetic Science Learning Center Louisa Stark, Genetic Science Learning Center Harmony Starr, Genetic Science Learning Center (illustrations) This activity was adapted from: “Alike But Not The Same” in Human Genetic Variation, NIH Curriculum Supplement Series (1999). Available at http://science-education.nih.gov/customers.nsf/highschool.htm. Funding Original funcing: A Howard Hughes Medical Institute Precollege Science Education Initiative for Biomedical Research Institutions Award (Grant 51000125). Additional Resources Visit the Teach.Genetics website to get more great resources like these! Funding for significant revisions: Grant U33MC00157 from the Health Resources and Services Administration, Maternal and Child Health Bureau, Genetic Services Branch. Partners in the Consumer Genetics Education Network (CGEN) include HRSA, March of Dimes, Dominican Women’s Development Center, Charles B. Wang Community Health Center, Genetic Science Learning Center at University of Utah, Utah Department of Health and the National Human Genome Center at Howard University. To learn about our permissions policy, visit http://teach.genetics.utah.edu/permissions/ © 2006 University of Utah This activity was downloaded from: http://teach.genetics.utah.edu 3 Name Print-and-Go™ Date http://learn.genetics.utah.edu Adapted from “Alike But Not The Same” in Human Genetic Variation, NIH Curriculum Supplement Series 1999. http://science-education.nih.gov An Inventory of My Traits - Survey What combination of these traits do you have? Complete the survey to find out. 1. I have detached earlobes Yes No 2. I can roll my tongue Yes No 3. I have dimples Yes No 4. I am right-handed Yes No 5. I have freckles Yes No 6. I have naturally curly hair Yes No 7. I have a cleft chin Yes No 8. I have allergies Yes No 9. I cross my left thumb over my right when I clasp my hands together Yes No 10. I can see the colors red and green ( I am not color blind) Yes No 11. The hairline on my forehead is straight. Yes No 12. I am a: Male Female © 2006 University of Utah This activity was downloaded from: http://teach.genetics.utah.edu S-1 Name Print-and-Go™ Date http://learn.genetics.utah.edu Adapted from “Alike But Not The Same” in Human Genetic Variation, NIH Curriculum Supplement Series 1999. http://science-education.nih.gov An Inventory of My Traits - Data Table How many people in your group have each trait? Fill in the data table below by counting the number of people who marked “yes” and the number of people who marked “no” for each trait. TRAIT YES NO Detached earlobes Tongue rolling Dimples Right-handed Freckles Naturally curly hair Cleft chin Allergies Cross left thumb over right See the colors red and green Have a straight hairline © 2006 University of Utah This activity was downloaded from: http://teach.genetics.utah.edu S-2 Name Date 5 4 3 2 1 0 An Inventory of My Traits - Graph This activity was downloaded from: http://teach.genetics.utah.edu Traits Make a bar graph showing how many people in your group answered “yes” for each trait. Be sure to label each trait under the bar you draw for it. © 2006 University of Utah # of students Print-and-Go™ http://learn.genetics.utah.edu S-3 Name Print-and-Go™ Date http://learn.genetics.utah.edu Adapted from “Alike But Not The Same” in Human Genetic Variation, NIH Curriculum Supplement Series 1999. http://science-education.nih.gov Un Inventario de mis Rasgos - Encuesta ¿Quales son los rasgos que tú tienes que se le hacen singular? Para averigüar, completa la encuesta que sigue abajo. 1. Tengo los lóbulos de las orejas separados Si No 2. Puedo hacer rollito mi lengua Si No 3. Tengo hoyuelos Si No 4. Escribo con la mano derecha Si No 5. Tengo pecas Si No 6. Mi cabello es rizado por naturaleza Si No 7. Tengo la barbilla partida Si No 8. Tengo alergias Si No 9. Cuando entrelazo mis dedos pongo mi pulgar izquierdo sobre mi pulgar derecho Si No 10. Puedo ver los colores rojo y verde (No soy daltónico) Si No 11. La rayita en mi frente es recta Si No 12. Yo soy: Hombre Mujer © 2006 University of Utah This activity was downloaded from: http://teach.genetics.utah.edu S-1 Name Print-and-Go™ Date http://learn.genetics.utah.edu Adapted from “Alike But Not The Same” in Human Genetic Variation, NIH Curriculum Supplement Series 1999. http://science-education.nih.gov Un Inventario de mis Rasgos - Tabla de Datos ¿Cuantas personas de tú grupo tienen cada rasgo? Completa la tabla de datos que aparece a continuación contando el número de personas que marcaron “Si” y el número de personas que marcaron “No” en cada rasgo. RASGO SI NO Lóbulos de las orejas unidos Puede hacer rollito la lengua Hoyuelos Escribe con la mano derecha Pecas Cabello rizado natural Barba partida Alergia Cruza el pulgar izquierdo sobre el derecho Puede ver los colores rojo y verde Tenga una rayita recta © 2006 University of Utah This activity was downloaded from: http://teach.genetics.utah.edu S-2 Name Date 5 4 3 2 1 0 © 2006 University of Utah # de estudiantes Print-and-Go™ S-3 http://learn.genetics.utah.edu Un Inventario de mis Rasgos - Gráfica Haz una gráfica de líneas mostrando cuántas personas en tu grupo contestaron “Si” en cada rasgo. Asegúrate de marcar cada barra con el nombre del rasgo que estás dibujando. Rasgos This activity was downloaded from: http://teach.genetics.utah.edu
