A new algorithm for calculating the MacAdam limits for any
Anuncio
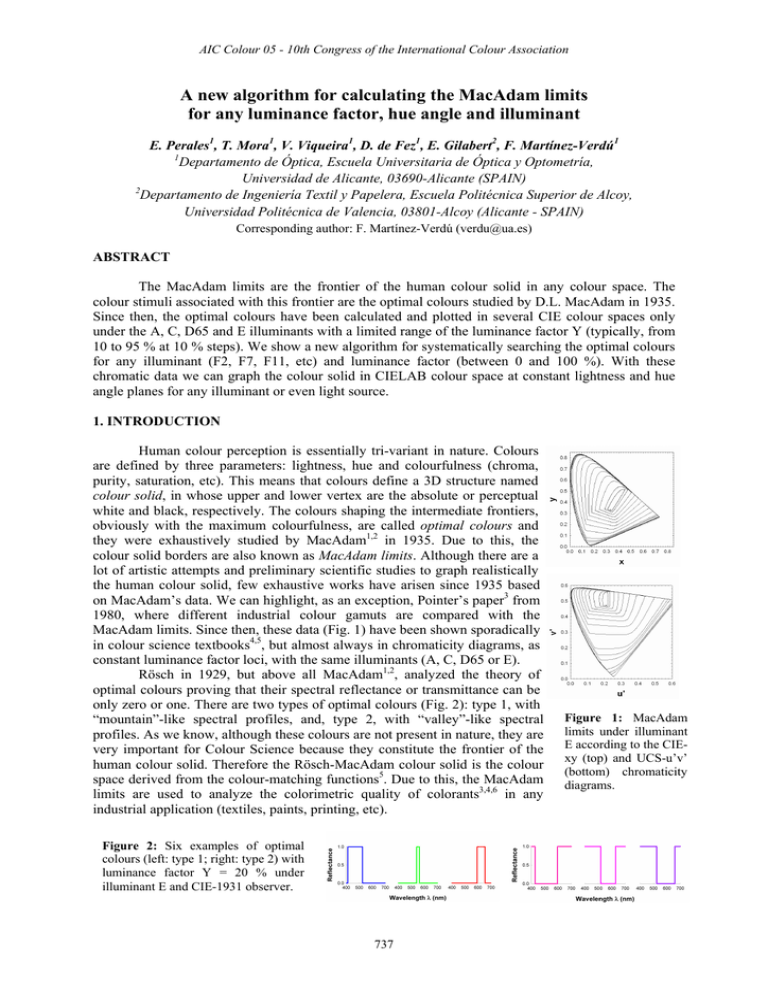
AIC Colour 05 - 10th Congress of the International Colour Association A new algorithm for calculating the MacAdam limits for any luminance factor, hue angle and illuminant E. Perales1, T. Mora1, V. Viqueira1, D. de Fez1, E. Gilabert2, F. Martínez-Verdú1 1 Departamento de Óptica, Escuela Universitaria de Óptica y Optometría, Universidad de Alicante, 03690-Alicante (SPAIN) 2 Departamento de Ingeniería Textil y Papelera, Escuela Politécnica Superior de Alcoy, Universidad Politécnica de Valencia, 03801-Alcoy (Alicante - SPAIN) Corresponding author: F. Martínez-Verdú (verdu@ua.es) ABSTRACT The MacAdam limits are the frontier of the human colour solid in any colour space. The colour stimuli associated with this frontier are the optimal colours studied by D.L. MacAdam in 1935. Since then, the optimal colours have been calculated and plotted in several CIE colour spaces only under the A, C, D65 and E illuminants with a limited range of the luminance factor Y (typically, from 10 to 95 % at 10 % steps). We show a new algorithm for systematically searching the optimal colours for any illuminant (F2, F7, F11, etc) and luminance factor (between 0 and 100 %). With these chromatic data we can graph the colour solid in CIELAB colour space at constant lightness and hue angle planes for any illuminant or even light source. 1. INTRODUCTION Human colour perception is essentially tri-variant in nature. Colours are defined by three parameters: lightness, hue and colourfulness (chroma, purity, saturation, etc). This means that colours define a 3D structure named colour solid, in whose upper and lower vertex are the absolute or perceptual white and black, respectively. The colours shaping the intermediate frontiers, obviously with the maximum colourfulness, are called optimal colours and they were exhaustively studied by MacAdam1,2 in 1935. Due to this, the colour solid borders are also known as MacAdam limits. Although there are a lot of artistic attempts and preliminary scientific studies to graph realistically the human colour solid, few exhaustive works have arisen since 1935 based on MacAdam’s data. We can highlight, as an exception, Pointer’s paper3 from 1980, where different industrial colour gamuts are compared with the MacAdam limits. Since then, these data (Fig. 1) have been shown sporadically in colour science textbooks4,5, but almost always in chromaticity diagrams, as constant luminance factor loci, with the same illuminants (A, C, D65 or E). Rösch in 1929, but above all MacAdam1,2, analyzed the theory of optimal colours proving that their spectral reflectance or transmittance can be only zero or one. There are two types of optimal colours (Fig. 2): type 1, with “mountain”-like spectral profiles, and, type 2, with “valley”-like spectral profiles. As we know, although these colours are not present in nature, they are very important for Colour Science because they constitute the frontier of the human colour solid. Therefore the Rösch-MacAdam colour solid is the colour space derived from the colour-matching functions5. Due to this, the MacAdam limits are used to analyze the colorimetric quality of colorants3,4,6 in any industrial application (textiles, paints, printing, etc). Figure 2: Six examples of optimal colours (left: type 1; right: type 2) with luminance factor Y = 20 % under illuminant E and CIE-1931 observer. 737 Figure 1: MacAdam limits under illuminant E according to the CIExy (top) and UCS-u’v’ (bottom) chromaticity diagrams. AIC Colour 05 - 10th Congress of the International Colour Association The original MacAdam’s algorithm, based on the calculation of the colorimetric purity, does not search systematically all the optimal colours of the visible spectrum for a specific luminance factor. This means that the MacAdam limits plotted in current literature are interpolated curves from a discrete and reduced number of original data. Moreover, the most usual illuminants in the literature are always A, C, D65 and E, with Y values above 10 %. We show in this work a new algorithm for systematically searching optimal colours for any illuminant (F2, F7, F11, D50, D75, etc) or light source (sodium, mercury, metal-halide, xenon lamps, etc), independently of the luminance factor Y. In this way, the colour solid could be completely graphed and we could determine how its shape depends on illuminant and colour space. In this way, for instance, a better analysis of industrial colour gamuts with the current colorants might be carried out. 2. METHOD Our algorithm is composed by two sub-algorithms: one for calculating type 1 optimal colours and other for calculating type 2 optimal colours. By default, the algorithm uses the following data: − Visible spectrum range, for instance from 380 to 780 nm, with spectral sampling ∆λ = 0.1 nm. − Colour-matching functions of CIE-1931 XYZ standard observer, so it is necessary to linearly interpolate with 0.1 nm steps the published CIE original data (with ∆λ = 1 nm). Using typical algebraic notation in Colorimetry, the CIE colour-matching are described by T = [x y z ]4001x 3 . − Spectral power distribution SPD or S(λ) of the illuminant sampled as the colour-matching functions. In this way, the weighting tables for any illuminant and CIE-1931 observer combination is computed by T’ = T·diag(S), where diag(S) is the diagonal matrix of the illuminant vector S. − Luminance factor Y, with a tolerance level ∆Y, adjusted directly with a defined lightness tolerance level ∆L*, for instance 0.01. This means, for instance, that the searched optimal colours for Y = 20 % are distributed into a constant lightness plane whose “thickness” does not surpass ∆L* = 0.02 between the most light optimal colour and the most dark optimal colour. To carry out this, it is necessary to take into account the complete equation L* = f(Y). With these preliminaries, for each fixed luminance factor Y (%) under any illuminant, the next routine (Eq. 1) systematically locates the wavelengths λ1 and λ2 where the sudden change of reflectance or transmittance happens (from 0 to 1 or opposite). That is, the spectra of optimal colours in Figure 2 differ in center and width but not height (always 0 or 1). TYPE 1 for i = 1 to N = 4001 do for j = 1 to N = 4001 do if i < j and TYPE 2 for i = 1 to N = 4001 do for j = 1 to N = 4001 do if i < j then save (i ≡ λ1 , j ≡ λ 2 ) N ⎡ i ⎤ y ' (λ k )⎥ ∈ [Y − ∆Y , Y + ∆Y ] ⎢ y ' (λ k ) + ⎢⎣ k =1 ⎥⎦ k= j then save (i ≡ λ1 , j ≡ λ 2 ) end for end for end for end for 100 yt ⋅S ( j ) ∑ y ' (λ ) ∈ [Y − ∆Y , Y + ∆Y ] k k =i and 100 yt ⋅S ( )∑ ∑ (1) With each pair of limiting wavelengths, λ1 and λ2, and the illuminant S(λ) it is very easy to generate the optimal colour stimuli Coptimal(λ) as ρoptimal(λ)*S(λ) with N spectral samples (N equals to 4001 for the shown example). Obviously, from here it is almost immediate to compute the tristimulus values XYZ from the colour-matching functions, CIELAB data, etc. However, it is important to keep in mind that in order to compute the CIELAB data, their complete standard equations must be used because there will be numerous optimal colours with Xoptimal/Xn, Yoptimal/Yn and Zoptimal/Zn ratios lower than 0.008856. (Notice that Xn, Yn and Zn are the tristimulus values of the illuminant.) 738 AIC Colour 05 - 10th Congress of the International Colour Association 3. RESULTS To select a uniform lightness scale of the optimal colours, the analyzed luminance factors were the following: 0.1, 0.5, 1, 2, 5, 7, 10, 20, 30, 40, 50, 60, 70, 80, 90 and 95 % (Fig. 1). As an example, Table 1 shows the number of optimal colours computed under illuminant C for several Y values, both with MacAdam’s algorithm and our own. As it is noticed above, in the current literature there are not optimal colour data associated to luminance factors lower than 10 %. However, with this new method we can enlarge the number of known optimal colours and to find new ones for any luminance factor, from 0 to 100 %. Table 1: Comparison between the sampling of optimal colours under illuminant C and CIE-1931 standard observer obtained with MacAdam’s algorithm and our own, using ∆λ = 0.1 nm. Figure 3: Rösch-MacAdam colour solid (top) in CIE-L*a*b colour space under the equienergetic illuminant E. Effect of the luminance factor Y over the point sampling of the MacAdam loci (bottom) for the same data of the top side: the smaller MacAdam loci correspond to Y = 0.1 (L* = 0.90) and 95 % (L* = 98.04), while the bigger one corresponds to Y = 20 % (L* = 51.84). Y (%) L* 0.1 0.5 1 2 5 7 10 20 30 40 50 60 70 80 90 95 0.90 4.52 8.99 15.49 26.73 31.81 37.84 51.84 61.65 69.47 76.07 81.84 87.00 91.68 96.00 98.03 Number of obtained optimal colours MacAdam algorithm Our proposal Type 1 Type 2 Type 1 Type 2 808 500 − − 433 236 − − 305 162 − − 264 322 − − 248 177 − − 314 187 − − 8 7 333 191 8 8 239 306 8 8 271 254 8 8 439 288 12 12 302 302 12 12 361 726 12 12 410 468 12 11 836 828 8 11 669 1233 6 8 1086 1651 Since the luminance factor Y (or lightness L*) can be selected within the ]0, 100 %] interval, the complete figure of the colour solid can be calculated and displayed under any illuminant or light source. Figure 4 shows the colour solids corresponding to the fluorescent F2, F7 and F11 illuminants. As it can be seen, the shape of the colour solid is also dependent on the SPD of the illuminant. Clearly, the shape of the F11 colour solid is different enough from the rest of the plotted colour solids, included the associated one to the equienergetic illuminant E of Figure 3. Figure 4: Rösch-MacAdam colour solid in CIE-L*a*b colour space under three fluorescent illuminants: F2 (left), F7 (center) and F11 (right). 739 AIC Colour 05 - 10th Congress of the International Colour Association The 3D shape of the colour solid is initially estimated by means of constant lightness planes (Fig. 3 and 4), but we have also developed a method to display it with constant hue-angle hab* profiles. To do this, we calculate and graph the chromaticity coordinates a* and b* in a MacAdam locus with constant lightness as a function of its hue-angle hab*. Then, any hue-angle hab* and (a*,b*) pair can be linearly interpolated with high accuracy in order to compute its corresponding chroma Cab*. To display finally the colour solid with several constant hue-angle hab* profiles (Fig. 5) we have selected as reference the hab* values of the Munsell chips under the C illuminant with V = 5 and C = 10, using all minor and major hue values. Therefore, an exhaustive comparison of the colour solid under several illuminants and light sources can be easily carried out (Fig. 7). For instance, comparing in Figure 6 the colour solids for illuminants A, E, F2, F7 and F11, the major differences among them are from to 5G to 5P hue profiles for the mid-to-low lightness range. Figure 5: Constant hue-angle hab* profiles of the RöschMacAdam colour solid in CIE-L*a*b colour space under illuminant C with a complete sampling using the one hundred minor and major Munsell hue values. Figure 6: Constant hue angle profiles of the Rösch-MacAdam colour solid under several illuminants in CIE(Cab*, L*) diagram: A (solid line), E (dash line), F2 (dotted line), F7 (dash-dot-dot line) and F11 (dash-dot line). 4. CONCLUSIONS We have enlarged the original work of MacAdam to allow the generation of optimal colours for any luminance factor and illuminant. Shortly, we will have computed data of the MacAdam limits under illuminants like D50, P40, etc, and light sources like Xe, metal-halide lamps, etc. The visualization of the Rösch-MacAdam solid can be done using constant lightness L* or hue angle hab* profiles. Therefore, we think that these new data may constitute a new database for Colour Science. Acknowledgements This research was supported by the Consellería d’Empresa, Universitat i Ciència of the Generalitat Valenciana (Spain) by means of the grant number IIARC0/2004/59. References 1. D.L. MacAdam, “The theory of the maximum visual efficiency of color materials”, J. Opt. Soc. Am, 25, 249-252 (1935). 2. D.L. MacAdam, “Maximum visual efficiency of colored materials”, J. Opt. Soc. Am., 25, 316-367 (1935). 3. M.R. Pointer, “The gamut of real surface colours”, Color Res. Appl. 5, 145-155 (1980). 4. R.S. Berns, Billmeyer and Saltzman’s Principles of Color Technology, 3rd ed. (John Wiley & Sons, New York, 2000), pp. 62, 143. 5. R. G. Kuehni, Color Space and Its Divisions: Color Order from Antiquity to the Present (John Wiley & Sons, New York 2003), pp. 91, 359. 6. M.R. Pointer, “Request for real surface colours”, Color Res. Appl., 27, 374 (2002). 740
