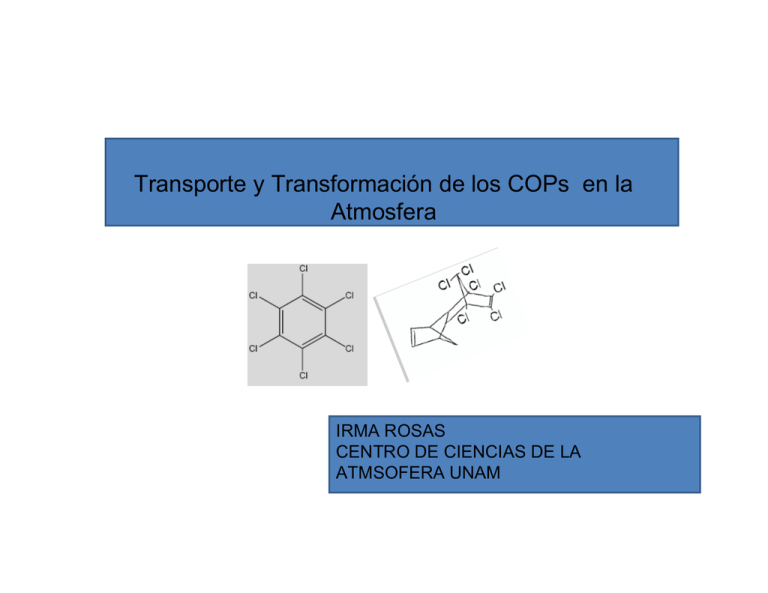
Transporte y Transformación de los COPs en la Atmosfera
Anuncio

Transporte y Transformación de los COPs en la Atmosfera IRMA ROSAS CENTRO DE CIENCIAS DE LA ATMSOFERA UNAM CARACTERISTICAS DE LOS POPs temperaturas Fase de vapor partículas suspendidas Lluvia nieve Suelo agua 90 Ecuador 0 90 Comportamiento de los COPs en el ambiente 1) Semivolatiles 2) Lipofílicos 3) Degradación fotoquimica 4) Biodegradación Transporte y destino de los COPs Metereológicos: Dinámica atmosférica Balance de masas y flujos entre compartimentos transporte Seca humeda Persistencia en el ambiente Persistencia en el ambiente Log KoW y el factor de bioconcentración QUE APRENDIMOS CON ESTA PRESENTACIÒN POCO QUE NECESITAMOS DISCUTIR UN PROTOCOLO PROTOCOLO Key message :Assessing temporal and spatial trends and regional and global transport of POPs in air. Backgraund: pilot study, select areas, monitors, POPs, analytical methods Site ID Site Type Latitude Longitude Elevation (m a.s.l.) GR01 BA 22º45'N 83º32'W 47 GR02 RU 19º12'N 96º08'W BA 09º42'N 83º52'W 2830 RU 7º01'N 70º45'W 100-120 BA 16º16'S 68º08'W 5192 BA 18º13'S 69º10'W 4320 BA 23º09'S 47º10'W 624 AG 38º45' S 62º15'W BA 45º35'S 72º02' W 19º14'N 99º00' W 00º56’N 29º22’W GR03 Location Tapanti NP GR04 GR05 Huayna Potosí 5200 m a.s.l, La Paz GR06 GR07 Indaiatuba (near ) GR08 GR09 Coyhaique GR10 Tláhuac GR11 St. Peter and Paul Rocks Country BA 2260 SELECCION DEL AREA DE ESTUDIO DDT emission from China (overall persistence Poverall = 10 years, effective spatial spreading SSeff = 750 km) Ocean Turkey (Poverall = 13 years, SSeff = 1900 km) Atmosphere They are mounted approximately two meters above the ground in an open area with unobstructed airflow. Sampling Two types of PAS are used (Figure 3). The PUF-disk sampler is deployed for three-month periods to capture seasonal differences and the XAD sampler is exposed for a full year. Figure 3. Schematic diagrams of passive air samplers stainless steel dome PUF disk support ring air circulation mounting bracket stainless stainless steel steel housing mesh tube containing XAD Two sampler types: The polyurethane foam (PUF) disk sampler (left) is deployed for 3-month periods to capture seasonal differences. The XAD-type sampler is deployed for 1 full year. Fig. 2. Schematic representation of a device. (A) According to Lebo et al. [42]. (B) According to Ellis Monitores Pasivos Sample analytical procedures PUF Disk PAS XAD PAS 1)Field blanks 2) Method blank 3)Instrument blank 4)Surrogate spikes 5)Matrix spikes 6)Field located samples 7)Instruments: OCPs, PCBs, and PBDEs were analyzed on a Hewlett-Packard 6890 gas chromatograph-5973 mass spectrometer (GC-MS) using electron impact (EI) for PCBs and negative chemical ionization (NCI) for OCPs and PBDEs in the selected ion monitoring mode. 8) Intercalibration studies for POPs Table 2. Exposure times, average temperatures and effective sampling rates during deployment periods for PUF-disk sampling in 2005 # R = effective sampling rate * Mean sampling rate calculated based on 4 sampling periods. ** Sample not available NS = No deployment in 2005 2005 Period 1 Period 2 Period 3 Period 4 Site ID Exposure Time (Days) Average Temp (°C) R# (m3/day) Exposure Time (Days) Average Temp (°C) R# (m3/day) Exposure Time (Days) Average Temp (°C) R# (m3/day) Exposure Time (Days) Average Temp (°C) R# (m3/day) GR01 139 24 3.9 53 27 5.5 77 27 3.9 91 27 3.8* GR02 ** ** ** 91 27 2.7 ** ** ** ** ** ** GR03 91 23 3.9 94 23 3.8* 92 22 3.8* 91 22 3.8* GR04 102 13 4.5 92 28 3.1 91 25 2 92 27 2.5 GR05 28 2 3.9 102 1.5 3.9 108 -0.2 2.5 74 1.5 2.3 GR06 106 22 5.6 147 17 1.2 232 6 3.1 232 6 3.1 GR07 ** ** ** 104 22 2.4 92 19 1.5 91 22 3.8 GR08 97 21 3.5 ** ** ** ** ** ** 94 15 5 GR09 232 6 3.9 232 6 3.9 120 17 5 120 10 4.7 GR10 NS NS NS NS NS NS NS NS NS NS NS NS GR11 NS NS NS NS NS NS NS NS NS NS NS NS RESULTS Table 3. Air concentrations (pg/m3) of OCPs, PCBs and PBDEs for Periods 1 and 2 in 2005 using PUF-disk samplers # Sum of 48 PCB congeners Sum of PBDE-47, 99, 100 ## NA = PUF disk not deployed during the period/sample not available MDL = method detection limit (pg/m3) BDL = below detection limit 2005 – Period 1 Site ID α-HCH γ-HCH HEPT HEPX TC CC TN Endo I Endo II EndoSO4 Dieldrin ppDDE ppDDT PCBs# PBDEs## GR01 1 2 BDL BDL 0.2 0.3 0.2 39 6 2 BDL BDL BDL 32 1 GR02 NA NA NA NA NA NA NA NA NA NA NA NA NA NA NA GR03 BDL 5.5 BDL 54 0.3 0.4 0.2 22 3.3 1.3 BDL BDL BDL BDL 6 GR04 BDL 3.1 BDL BDL BDL BDL BDL 280 93 5.4 0.8 2.1 BDL 8 BDL GR05 BDL 26 BDL BDL BDL BDL BDL 1585 85 81 BDL BDL BDL BDL BDL GR06 BDL 6 BDL BDL 0.2 0.3 BDL 261 1.9 1.9 5.4 4 BDL BDL BDL GR07 NA NA NA NA NA NA NA NA NA NA NA NA NA NA NA GR08 0.9 3 63 1.8 1.2 BDL 0.5 14635 4103 1 5.3 BDL BDL 9 8 GR09 0.8 3.3 BDL BDL 0.2 0.5 0.1 29 0.2 BDL 1.2 0.5 BDL 5.6 BDL Site ID α-HCH γ-HCH HEPT HEPX TC CC TN Endo I Endo II EndoSO4 Dieldrin ppDDE ppDDT PCBs# PBDEs## GR01 2 4 BDL BDL 1.9 2.6 2.5 306 52 BDL 19 BDL -- BDL BDL 2005 – Period 2 GR02 24 25 BDL BDL 4.6 2.6 3.3 397 BDL BDL BDL BDL -- 399 2.17 GR03 12 BDL BDL 27 0.16 0.31 0.15 43 10.1 1.3 BDL BDL -- BDL 3.03 GR04 0.6 2.1 BDL BDL 0.2 0.3 0.2 54 2 0.1 2.2 8 -- 11 0.97 GR05 11 12 BDL 249 1 2 1 1078 21 18 BDL BDL -- BDL BDL GR06 BDL 7.5 BDL BDL 0.3 0.4 0.1 348 2.5 2.6 7.4 5.7 -- BDL 0.81 GR07 10.6 30.2 BDL BDL 3.5 1.2 0.9 1907 783 132.1 44 BDL -- 145 BDL GR08 NA NA NA NA NA NA NA NA NA NA NA NA -- NA NA GR09 0.8 3.3 BDL BDL 0.2 0.5 0.1 29 0.2 BDL 1.2 0.5 -- 6.4 BDL MDL 0.1 0.3 0.1 0.1 0.1 0.4 0.2 0.7 0.8 0.5 0.14 0.1 0.5 0.12 3.7 Monitores activos: Estudios Transversales

