The following chart shows the SP500´s future con
Anuncio
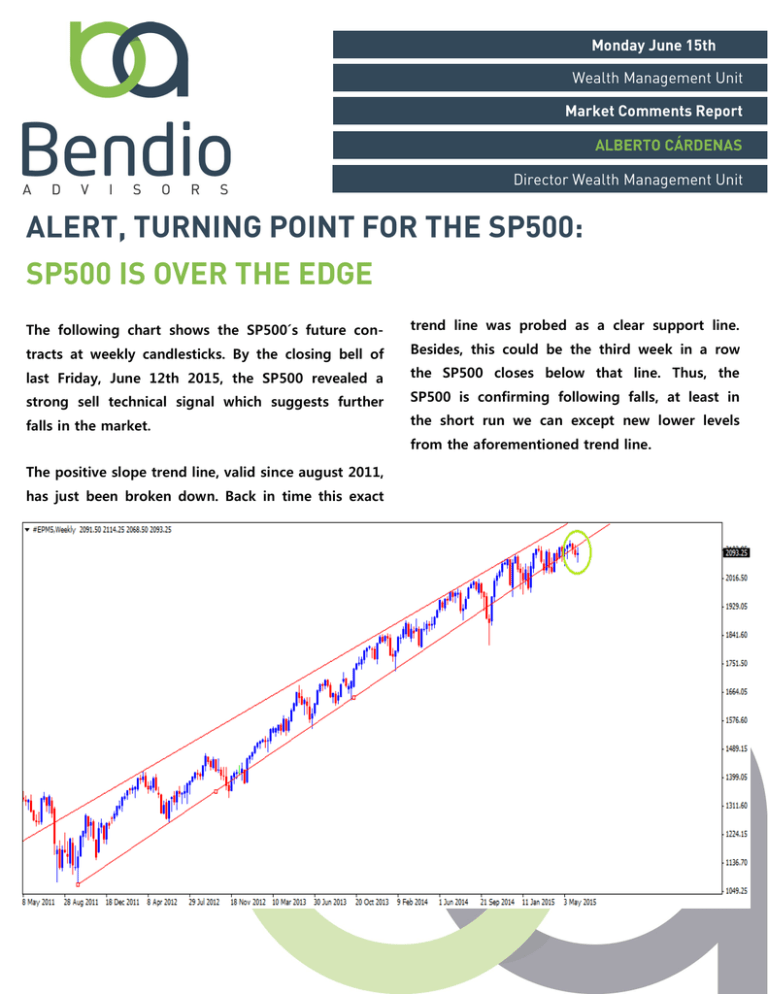
The following chart shows the SP500´s future con- trend line was probed as a clear support line. tracts at weekly candlesticks. By the closing bell of Besides, this could be the third week in a row last Friday, June 12th 2015, the SP500 revealed a the SP500 closes below that line. Thus, the strong sell technical signal which suggests further SP500 is confirming following falls, at least in falls in the market. the short run we can except new lower levels from the aforementioned trend line. The positive slope trend line, valid since august 2011, has just been broken down. Back in time this exact The daily chart speaks fluently. Notice the major On the other hand, pay attention to the candlestick positive slope´s trend lines have been broken. formations can alert investors a strong selling peri- Therefore price levels are in a clear bearish zone, od is just round the corner. Notice the “evening suggesting strong sell for the SP500 future con- star” at a resistance level, built in the last three tracts. days. This special candle stick formation indicates a breaking point from last trend. We can also notice a triple down trend divergence at RSI oscillator. This divergence has been Bottom line, all this technical signals besides the confirmed every time the oscillator is below its markets has begun discounting the US rate hike 50 points level. We can find another confirma- and the Grexit in advance, are suggesting investors tion of the strong sell signal at the MACD, which to tighten stop loss levels, take profits from stock is crossing the zero level, showing a down trend markets and assume more cash in portfolios. It is divergence as well. time to get defensive against the stock market, at least in the short time. Esta publicación ha sido preparada por la Unidad de Gestión de Activos, en conjunto con la Unidad de Investigación de Bencio Advisors. Ambas unidades conformadas por un grupo de Economistas con alta capacitación para la correspondiente elaboración del material presentado. Este reporte es de carácter informativo. Queda terminantemente prohibida la distribución de este material sin previa autorización de © Bendio Advisors AG con sede en Suiza, Bendio Advisors AG, en ningún momento recomiendan la compra o venta de algún activo financiero en base a este reporte. La información que contiene este reporte ha sido obtenida de fuentes consideradas confiables por Bendio AG, sin embargo no se garantiza en ningún momento su veracidad. Las opinión, juicios de valor y consideraciones son resultado de un exhaustivo análisis por parte de la unidad de manejo de activos y la unidad de investigación, sin embargo estas consideraciones puedes ser vulnerables a cambios. Las actualizaciones a las opiniones y visiones de Bendio Advisors AG serán notificadas en próximos reportes, no se harán sobre el reporte ya emitido. En ningún momento, Bendio AG, , afiliados, directores ni empleados aceptan en ningún momento la responsabilidad de lo manifestado en este reporte por ninguna consecuencia que resulte en perdida directa o indirecta para alguna parte involucrada. El contenido de este reporte no se ajusta a las necesidades de todos los inversores. Bendio AG recomienda a sus inversores, independientemente, emitir sus propios juicios sobre cualquier instrumento financiero discutido en este reporte.
