Can we improve our results in hemodialysis? Setting quality
Anuncio
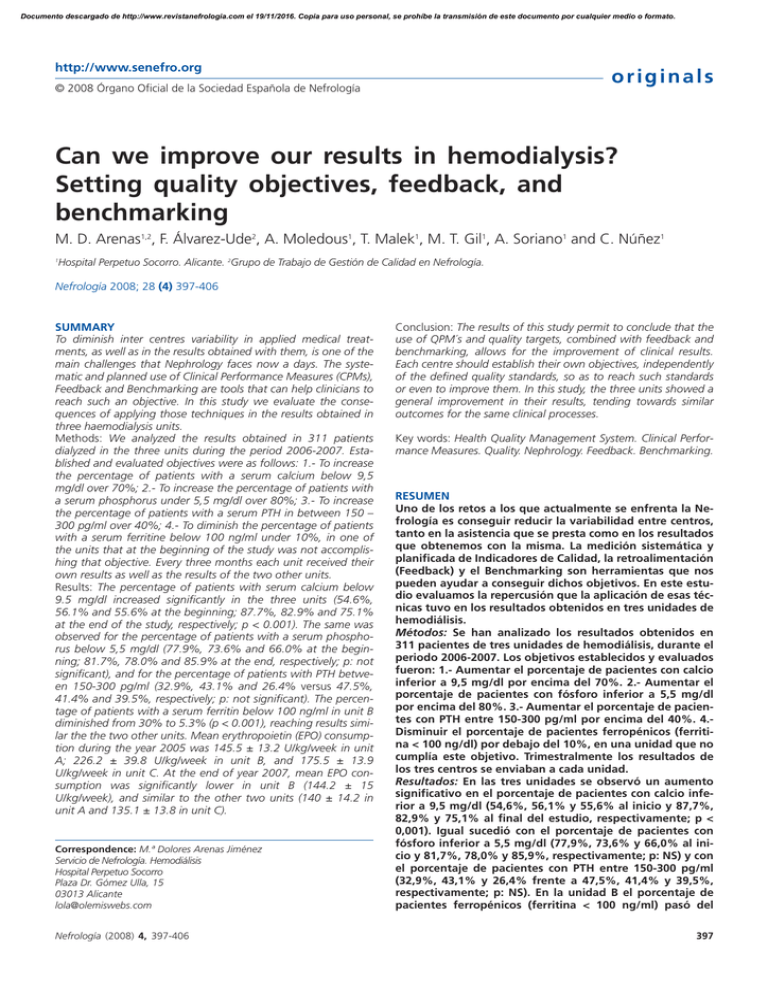
Documento descargado de http://www.revistanefrologia.com el 19/11/2016. Copia para uso personal, se prohíbe la transmisión de este documento por cualquier medio o formato. http://www.senefro.org originals © 2008 Órgano Oficial de la Sociedad Española de Nefrología Can we improve our results in hemodialysis? Setting quality objectives, feedback, and benchmarking M. D. Arenas1,2, F. Álvarez-Ude2, A. Moledous1, T. Malek1, M. T. Gil1, A. Soriano1 and C. Núñez1 Hospital Perpetuo Socorro. Alicante. 2Grupo de Trabajo de Gestión de Calidad en Nefrología. 1 Nefrología 2008; 28 (4) 397-406 SUMMARY To diminish inter centres variability in applied medical treatments, as well as in the results obtained with them, is one of the main challenges that Nephrology faces now a days. The systematic and planned use of Clinical Performance Measures (CPMs), Feedback and Benchmarking are tools that can help clinicians to reach such an objective. In this study we evaluate the consequences of applying those techniques in the results obtained in three haemodialysis units. Methods: We analyzed the results obtained in 311 patients dialyzed in the three units during the period 2006-2007. Established and evaluated objectives were as follows: 1.- To increase the percentage of patients with a serum calcium below 9,5 mg/dl over 70%; 2.- To increase the percentage of patients with a serum phosphorus under 5,5 mg/dl over 80%; 3.- To increase the percentage of patients with a serum PTH in between 150 – 300 pg/ml over 40%; 4.- To diminish the percentage of patients with a serum ferritine below 100 ng/ml under 10%, in one of the units that at the beginning of the study was not accomplishing that objective. Every three months each unit received their own results as well as the results of the two other units. Results: The percentage of patients with serum calcium below 9.5 mg/dl increased significantly in the three units (54.6%, 56.1% and 55.6% at the beginning; 87.7%, 82.9% and 75.1% at the end of the study, respectively; p < 0.001). The same was observed for the percentage of patients with a serum phosphorus below 5,5 mg/dl (77.9%, 73.6% and 66.0% at the beginning; 81.7%, 78.0% and 85.9% at the end, respectively; p: not significant), and for the percentage of patients with PTH between 150-300 pg/ml (32.9%, 43.1% and 26.4% versus 47.5%, 41.4% and 39.5%, respectively; p: not significant). The percentage of patients with a serum ferritin below 100 ng/ml in unit B diminished from 30% to 5.3% (p < 0.001), reaching results similar the the two other units. Mean erythropoietin (EPO) consumption during the year 2005 was 145.5 ± 13.2 U/kg/week in unit A; 226.2 ± 39.8 U/kg/week in unit B, and 175.5 ± 13.9 U/kg/week in unit C. At the end of year 2007, mean EPO consumption was significantly lower in unit B (144.2 ± 15 U/kg/week), and similar to the other two units (140 ± 14.2 in unit A and 135.1 ± 13.8 in unit C). Correspondence: M.ª Dolores Arenas Jiménez Servicio de Nefrología. Hemodiálisis Hospital Perpetuo Socorro Plaza Dr. Gómez Ulla, 15 03013 Alicante lola@olemiswebs.com Nefrología (2008) 4, 397-406 Conclusion: The results of this study permit to conclude that the use of QPM´s and quality targets, combined with feedback and benchmarking, allows for the improvement of clinical results. Each centre should establish their own objectives, independently of the defined quality standards, so as to reach such standards or even to improve them. In this study, the three units showed a general improvement in their results, tending towards similar outcomes for the same clinical processes. Key words: Health Quality Management System. Clinical Performance Measures. Quality. Nephrology. Feedback. Benchmarking. RESUMEN Uno de los retos a los que actualmente se enfrenta la Nefrología es conseguir reducir la variabilidad entre centros, tanto en la asistencia que se presta como en los resultados que obtenemos con la misma. La medición sistemática y planificada de Indicadores de Calidad, la retroalimentación (Feedback) y el Benchmarking son herramientas que nos pueden ayudar a conseguir dichos objetivos. En este estudio evaluamos la repercusión que la aplicación de esas técnicas tuvo en los resultados obtenidos en tres unidades de hemodiálisis. Métodos: Se han analizado los resultados obtenidos en 311 pacientes de tres unidades de hemodiálisis, durante el periodo 2006-2007. Los objetivos establecidos y evaluados fueron: 1.- Aumentar el porcentaje de pacientes con calcio inferior a 9,5 mg/dl por encima del 70%. 2.- Aumentar el porcentaje de pacientes con fósforo inferior a 5,5 mg/dl por encima del 80%. 3.- Aumentar el porcentaje de pacientes con PTH entre 150-300 pg/ml por encima del 40%. 4.Disminuir el porcentaje de pacientes ferropénicos (ferritina < 100 ng/dl) por debajo del 10%, en una unidad que no cumplía este objetivo. Trimestralmente los resultados de los tres centros se enviaban a cada unidad. Resultados: En las tres unidades se observó un aumento significativo en el porcentaje de pacientes con calcio inferior a 9,5 mg/dl (54,6%, 56,1% y 55,6% al inicio y 87,7%, 82,9% y 75,1% al final del estudio, respectivamente; p < 0,001). Igual sucedió con el porcentaje de pacientes con fósforo inferior a 5,5 mg/dl (77,9%, 73,6% y 66,0% al inicio y 81,7%, 78,0% y 85,9%, respectivamente; p: NS) y con el porcentaje de pacientes con PTH entre 150-300 pg/ml (32,9%, 43,1% y 26,4% frente a 47,5%, 41,4% y 39,5%, respectivamente; p: NS). En la unidad B el porcentaje de pacientes ferropénicos (ferritina < 100 ng/ml) pasó del 397 Documento descargado de http://www.revistanefrologia.com el 19/11/2016. Copia para uso personal, se prohíbe la transmisión de este documento por cualquier medio o formato. originals 30% a 5,3% (p < 0,001), unificando los resultados con los de las otras dos unidades. El consumo medio de EPO en el año 2005 fue 145,5 ± 13,2 U/kg/semana en la unidad A, 226,2 ± 39,8 U/kg/semana en la unidad B y 175,5 ± 13,9 U/kg/semana en la unidad C; al final del año 2007 se obtuvo un consumo medio de EPO significativamente inferior en la unidad B (144,2 ± 15 U/kg/semana), similar al de las otras dos unidades (140 ± 14,2 en la unidad A, y 135,1 ± 13,8 en la unidad C). En el periodo de estudio el Índice de Resistencia a la Eritropoyetina disminuyó de 26,1 a 11,3 en la unidad B. En conclusión, este estudio demuestra que una actitud activa, basada en el uso de indicadores de calidad y el establecimiento de objetivos, la retroalimentación y el benchmarking, permite conseguir una mejora de los resultados. Independientemente de los estándares de calidad definidos, cada centro debería marcarse unos objetivos, bien para alcanzar dicho estándar o bien para mejorarlo. En general las tres unidades tendieron a mejorar sus resultados, así como a igualar los correspondientes al mismo proceso asistencial. Palabras clave: Indicadores de Calidad Asistencial. Calidad. Certificación. Sistema de Gestión de la Calidad. Retroalimentación. Benchmarking. INTRODUCTION While many aspects of renal replacement therapy for stage 5 chronic kidney disease (CKD) have been standardized in internationally accepted guidelines such as the Kidney Disease Outcomes Quality Initiative (K/DOQI),1 significant differences are seen in the literature in the degree of compliance with the proposed standards both between centers and between the different countries.2-4 One of the current challenges is to reduce the variability in the care provided. Though some differences could be justified because of the different demographic characteristics of patients dialyzed at the centers, there are other differences due to the different procedures used.5-8 Systematic, planned measurement of quality indicators has been shown to help improve patient monitoring and outcomes of treatments applied, because it allows us for understanding our situation, introducing improvement activities, and systematically and continuously checking their effectiveness.9 The true rationale for attempting to achieve compliance with such indicators is the recently shown evidence that joint achievement of some of them (anemia, dialysis dose, calcium-phosphorus metabolism, albumin, or type of vascular access) has an impact on patient survival, morbidity, and costs.10,11 Other improvement tools include feedback and benchmarking.12-14 Feedback consists of pooling individual results to obtain joint results providing a populational perspective, systematically and regularly reporting such results to the staff in charge of care. Benchmarking is based on the assumption that open knowledge of our own results and their comparison with those achieved by other similar centers represents a powerful stimulus able to modify behaviors and hence results. 398 M. D. Arenas et al. Calidad en hemodiálisis The main objective of this study was to assess the impact of systematic measurement of quality indicators and implementation of feedback and benchmarking procedures on the results achieved in three hemodialysis units, and to provide readers with a new tool for improving results in daily work. MATERIALS AND METHODS Definitions of interest Indicator: A measure of performance of an organization that is used to assess the efficiency, efficacy, and quality of a given action. Quality objective: A formulation of what is intended to be achieved in the field of quality. Quality objectives should be formulated in a simple way (to make it easier to understand), and should also be realistic (achievable), attractive (to be a source of motivation), and measurable (so that each person may verify at any time how he/she is performing). Deadlines for meeting such objectives should also be established. Study design This was an uncontrolled, pre-post, or intervention study assessing response after definition of an objective and implementation of feedback and benchmarking procedures in the same group of subjects. Evaluations were made before and after intervention, with each subject acting as his/her own control. Methods The results obtained during the 2006-2007 period at the three hemodialysis units belonging to Hospital Perpetuo Socorro were analyzed. These are units working for the social security under an agreement, subject to the same quality management system and using common protocols. A total of 317 and 311 patients underwent dialysis in all three units during 2006 and 2007 respectively. Results of quality indicators refer to these patients (207 patients in unit A, 53 patients in unit B, and 51 patients in unit C). Eighty-three incident patients (51 patients in unit A, 13 patients in unit B, and 19 patients in unit C) were received during 2006, and 60 incident patients (45, 6, and 9 patients in units A, B, and C respectively) were received during 2007. The quality management system was implemented in 2000, and has been certified by AENOR since January 2001. All three units were recently accredited by the Valencian model of accreditation for healthcare activities (INACEPS) specific for hemodialysis, being rated as excellent. Performance measurement was started in 2000 and showed good results, with an improvement in most indicators monitored.9 The other previously described improvement tools, feedback and benchmarking, were implemented in 2006, and indicator results were more widely disseminated to the centers, so Nefrología (2008) 4, 397-406 Documento descargado de http://www.revistanefrologia.com el 19/11/2016. Copia para uso personal, se prohíbe la transmisión de este documento por cualquier medio o formato. M. D. Arenas et al. Calidad en hemodiálisis Table I. Areas for which defined quality indicators exist in hemodialysis units 1. Adequate dialysis 2. Anemia 3. Calcium-phosphorus metabolism 4. Nutrition 5. Viral diseases 6. Vascular access 7. Mortality 8. Morbidity (hospital admissions) 9. Transplant that each center knew its own results and could compare itself to the other centers. On the other hand, all three centers participate since January 2007 in the Multicenter study of quality indicators in hemodialysis of the Quality Management Group of the SEN. The Nefrosoft® 3.0 (Visual-limes) database is used to record the whole clinical history of patients in an electronic format, and the indicator module (specific quality soft- originals ware (Visual-limes) that works coupled to such database and allows for easily estimating indicators) has been incorporated into routine work. This facilitates direct calculation of indicators at each center, that also receives every three months the results of the other centers participating in the study. Moreover, all three centers have the specific quality objectives set for centers belonging to Hospital Perpetuo Socorro. Table I shows the main areas for which quality indicators have been defined, and table II lists the indicators defined for the areas in which objectives were subsequently established. Definition of objectives In January 2006, an assessment was made of the results of indicators in all three centers in the different treatment areas defined, from which objectives for 2006 and 2007 were defined (table III). Quality objectives were established separately from quality indicators, and were focused on areas where results were un- Table II. Listing of quality indicators defined at hemodialysis units in 2006-2007 for the areas affecting the objectives of anemia and bone and mineral metabolism Category Description Anemia Regularity Standard Mean hemoglobin levels (g/dL) 1 month > 11 % of patients with Hb > 11 g/dL 1 month > 80 Mean weekly erythropoietin dose (U/kg) 1 month Not defined Mean weekly darbeopietin dose (U/kg/) 1 month Not defined Mean erythropoietin resistance index (u/kg/week/g of Hb) 1 month Not defined Mean resistance index to darbepoietin alpha (U/kg/week/g of Hb) 1 month Not defined % patients with ferritin levels within optimum range (100 - 800 ng/mL) 2 months > 80 % patients with ferritin levels > 100 ng/mL 2 months > 90 % patients with ferritin levels < 800 ng/mL 2 months > 78 Arithmetic mean of ferritin levels 2 months 250-500 Category Description Arithmetic mean of PTH levels CARDIOVASCULAR-RISK MINERAL METABOLISM Regularity Standard 2 months < 300 % patients with PTH-I values ranging from 150-300 pg/mL 2 months > 30 % patients with PTH-I levels >150 pg/mL 2 months Not defined % patients with PTH-I levels < 300 pg/mL 2 months Not defined % patients with PTH levels < 800 pg/mL 2 months Not defined Arithmetic mean of serum calcium levels 1 month < 9.5 % patients with calcium levels ranging from 8.4-9.5 mg/dL 1 month > 50 % patients with serum calcium levels > 8.4 mg/dL 1 month Not defined % patients with serum calcium levels < 9.5 mg/dL 1 month Not defined % patients without hypercalcemia (calcium levels < 10,2 mg/dL) 1 month Not defined Arithmetic mean of serum phosphorus levels 1 month < 5.5 % patients with target phosphorus levels ranging from 3.5 and 5.5 mg/dL 1 month > 50 % phosphorus measurements < 5.5 mg/dL 1 month > 50 Nefrología (2008) 4, 397-406 399 Documento descargado de http://www.revistanefrologia.com el 19/11/2016. Copia para uso personal, se prohíbe la transmisión de este documento por cualquier medio o formato. M. D. Arenas et al. Calidad en hemodiálisis originals Table III. Results of quality indicators for the three units in January 2006 Indicator Percent hemoglobin measurements ≥ 11 g/dL Unit A 85.7 ± 1.1 Unit B 92.6 ± 3 Unit C P 81.9 ± 8.5 NS Percent ferritin measurements ≤ 100 ng/mL 4.4 ± 2.2 30 ± 7.2 13 ± 7.3 < 0.001 Percent calcium measurements < 9.5 mg/dl 54.6 ± 14.1 56.1 ± 13.5 55.6 ± 11.5 NS Percent phosphorus measurements < 5.5 mg/dl 77.9 ± 4.7 73.6 ± 6.8 66.9 ± 5.8 NS Percent PTH-I measurements ranging from 150 and 300 pg/mL 32.9 ± 3.7 43.5 ± 3.8 26.4 ± 8.5 < 0.01 Percent KTV measurements > 1.3 90.6 ± 5.6 88.2 ± 6.2 90.7 ± 5.5 NS 145.5 ± 13.2 226.2 ± 39.8 175.5 ± 13.9 < 0.05 Mean EPO dose (U/kg/week) satisfactory or where an improvement over the proposed standard was intended. This allowed us for focusing our attention on such aspects. Based on these results, objectives were established for treatment of iron deficiency and control of phosphorus, calcium, and PTH. No objectives were defined for control of hemoglobin or suitability of dialysis, as these showed optimum levels that were difficult to improve. Planning included definition of the objective, that established a higher goal than achieved in January 2006. An action plan was devised, the staff, resources, and deadlines for its implementation were established, and an indicator that allowed for monitoring achievement of the objective was defined. Achievement of these objectives was evaluated every three months. The objectives and the actions intended to promote their achievement are described below: 1. To increase over 70% the proportion of patients with serum calcium levels < 9.5 mg/dL. Staff in charge of implementation: unit nephrologists. Measurement and control of objectives, as well as setting of common objectives: head of department. Action plan: – Monthly measurement of serum calcium levels in patients on dialysis according to the previously defined laboratory test plan. – Monthly follow-up of quality indicators defined for monitoring calcium levels to detect downward deviations. – Early modification of vitamin D doses, use of dialysis baths with different calcium levels, and use of calciumbased phosphate binders in the event of calcium levels higher than 9.5 mg/dL. – Use of calcimimetic drugs in patients with secondary hyperparathyroidism who developed hypercalcemia due to high vitamin D doses. – Preferential use of bath with a calcium content of 2.5 mEq/L in patients with calcium levels higher than 9.5 mg/dL. Decrease in use of dialyzate containing 3.5 mEq/L of calcium. 400 – Use of combinations of phosphate binders that do not allow for phosphate control with a calcium provision as phosphate binders under 1500 mg/day. Resources: Cinacalcet, calcium-free phosphate binders (sevelamer, aluminium hydroxide), calcium-based phosphate binders (calcium acetate), calcium content in dialyzate 2.5 mEq/L. Timeline: 1 year 2. To increase over 80% the proportion of patients with serum phosphate levels < 5.5 mg/dL. Staff in charge of implementation: unit nephrologists. Measurement and control of objectives, as well as setting of common objectives: head of department. Action plan: – Monthly measurement of serum phosphate levels in patients on dialysis according to the previously defined laboratory test plan. – Early modification of vitamin D doses and adequate use of phosphate binders. – Use of combinations of phosphate binders that would allow us for reaching the goal. – Specific action in non-compliant patients by searching for the reasons for non compliance, analysis of preferences in use of binders (type, scheme), dietary education, and advice on how drugs should be taken. – Establishment of an individual follow-up and encouragement plan, with special motivation of patients not adhering to treatment. Resources: Cinacalcet, calcium-free phosphate binders (sevelamer, aluminium hydroxide), calcium-based phosphate binders (calcium acetate), calcium content in dialyzate 2.5 mEq/L. Timeline: 1 year 3. To increase over 40% the proportion of patients with serum PTH levels ranging from 150 300 pg/dL. Nefrología (2008) 4, 397-406 Documento descargado de http://www.revistanefrologia.com el 19/11/2016. Copia para uso personal, se prohíbe la transmisión de este documento por cualquier medio o formato. M. D. Arenas et al. Calidad en hemodiálisis Staff in charge of implementation: unit nephrologists. Measurement and control of objectives, as well as setting of common objectives: head of department. Action plan: – Two-monthly measurement of PTH and monthly measurements of phosphate and calcium in patients on dialysis according to the previously defined laboratory test plan. – Maintenance of phosphate levels < 5.5 mg/dL by adequate use of phosphate binders, and emphasis on dietary education in particularly problematic patients. – Adequate use of new drugs accepted for management of bone and mineral metabolism (calcimimetics). Resources: Cinacalcet, calcium-free phosphate binders (sevelamer, aluminium hydroxide), calcium-based phosphate binders (calcium acetate), calcium content in dialyzate 2.5 mEq/L. Timeline: 1 year 4. To decrease under 10% the proportion of iron-deficient patients (ferritin < 100 ng/mL) in unit B, that did not meet the objective. Staff in charge of implementation: unit nephrologists. Measurement and control of objectives, as well as setting of common objectives: head of department. originals Action plan: – Two-monthly measurement of ferritin levels in patients on dialysis according to the previously defined laboratory test plan. – Maintenance of an adequate balance of iron metabolism using ferritin controls every three months and intravenous administration of iron every 1, 2, or 4 weeks based on ferritin levels and transferrin saturation index. Resources: Intravenous administration of iron. Timeline: 1 year Feedback and benchmarking Every three months, the results of all three centers were sent to each unit as a «traffic lights» table showing the results obtained in different colors: adequate results in green, intermediate results close to the goal in yellow, and results far from the goal in red. Statistical analysis All data were analyzed using SPSS 12 software. For quantitative variables, the normality hypothesis was analyzed using a distribution study and a non-parametric Kolmogorov-Smirnov test. To describe these variables, the arithmetic mean was used as a measure of central ten- Table IV. Demographic characteristics and global and treatment indicators for patients receiving care at study start Indicators Annual mortality (%) Proportion of diabetic nephropathy (%) Mean time on HD (months) Unit A Unit B Unit C 12 11.5 10.2 14.6 9.09 15.6 61.6 71.2 45.9 Mean age of prevalent population (years) 64.5 ± 14.6 68.1 ± 14.8 61.6 ± 14.3 Mean age of incident population (years) 64.3 ± 13.2 63 ± 13.5 Mean Charlson’s comorbidity index (incident population) Mean weekly hours of dialysis Proportion of patients with more than 4 hours per session (%) Proportion of patients with more than 3 weekly sessions (%) 58.1 ± 14 8 7 7 11.9 ± 0.6 10.8 ± 0.6 11.4 ± 0.6 59.6 37.7 62.2 10 0 0 Percent use of synthetic membranes 100 100 100 Percent use of high flux HD 23.7 11.1 31.1 Mean blood flow 358.5 ± 28.3 373.5 ± 28.3 354 ± 28.3 Percent patients with calcium in dialyzate of 2.5 70 86 67.4 Percent patients with calcium in dialyzate of 3.0 30 9.3 27.9 Percent patients with calcium in dialyzate of 3.5 Percent patients on calcimimetics 0 4.6 4.6 16.1 13.3 15.5 Percent patients treated with calcium-based binders 51.5 40 62.2 Percent patients treated with sevelamer 64.4 75.5 73.3 Percent patients treated with aluminium binders 20.5 6.6 24.4 Nefrología (2008) 4, 397-406 401 Documento descargado de http://www.revistanefrologia.com el 19/11/2016. Copia para uso personal, se prohíbe la transmisión de este documento por cualquier medio o formato. M. D. Arenas et al. Calidad en hemodiálisis originals Table V. Results of outcome and treatment indicators in the area of anemia and bone and mineral metabolism at study end Indicators Unit A % patients with ferritin levels within optimum range (100-800 ng/mL) 89.7 % patients with ferritin levels < 800 ng/mL 96.9 Arithmetic mean of ferritin levels Unit B 94.12 100 410.4 Arithmetic mean of serum calcium levels 235.8 Unit C 88.64 90.91 409.6 9.02 9.02 9.01 % patients with calcium levels ranging from 8.4-9.5 mg/dL 72.05 72.73 76.74 % patients with serum calcium levels > 8.4 mg/dL 80.7 87.8 90.7 % patients without hypercalcemia (calcium levels < 10.2 mg/dL) 98.72 Arithmetic mean of serum phosphorus levels 100 4.49 4.56 97.67 4.50 % patients with target phosphorus levels ranging from 3.5 and 5.5 mg/dL 63.58 63.64 62.79 Percent patients with calcium in dialyzate of 2.5 51.19 71.05 56.82 Percent patients with calcium in dialyzate of 3.0 47.02 10.53 40.91 Percent patients with calcium in dialyzate of 3.5 1.79 Percent patients on calcimimetics 3.16 18.9 15.7 2.27 25 Percent patients treated with calcium-based binders 59.7 39.4 43.18 Percent patients treated with sevelamer 73.3 68.4 70.45 Percent patients treated with aluminium binders 18.9 15.79 18.18 dency, and the standard deviation as a dispersion measure. To study variables, a Student’s t test was used to compare means when the normality assumptions and homogeneity of variances were met. When the normality assumption could not be verified, a Mann-Whitney’s U test was used. The comparative analysis of percentages was performed using a Chi-square test for linear trend in proportions, which allowed for analyzing whether improvements in percentages resulted from a trend or were relatively arbitrary. A value of p < 0.05 was considered significant in twosided tests. RESULTS Global indicators and demographic data Table IV shows the demographic and treatment characteristics of patients at study start. Table V gives the results of outcome and treatment indicators as regards anemia and bone and mineral metabolism at study end. Figures 1, 2, 3, and 4 show the quarterly changes in the goals set. In all three units, a significant increase was seen in the proportion of patients with serum calcium levels under 9.5 mg/dL, and the goal was reached in all of them. 100 unit A unit B 80 unit C 60 40 20 0 1 Q 06 2 Q 06 unit A 54.6 unit B 56.14 unit C 55.6 st 402 3 Q 06 4 Q 06 1 Q 07 2 Q 07 3 Q 07 4 Q 07 57.4 62 64.4 82.2 76.3 88.6 90.3 46.4 52.08 59.1 61.2 87.3 84.5 82.9 67.8 63.7 68.8 67.8 67.7 56.1 75.1 nd rd th st nd rd th Figure 1. Objective: to increase over 70% the proportion of patients with serum calcium levels < 9.5 g/dL. Chi square for linear trend: Unit A: 118.2 (p < 0.0001); Unit B: 17.7 (p < 0.0001); Unit C: 0.93 (p: 0.33). Nefrología (2008) 4, 397-406 Documento descargado de http://www.revistanefrologia.com el 19/11/2016. Copia para uso personal, se prohíbe la transmisión de este documento por cualquier medio o formato. M. D. Arenas et al. Calidad en hemodiálisis originals unit A unit B unit C 100 80 60 40 20 0 1st Q 06 2nd Q 06 3rd Q 06 4th Q 06 1st Q 07 2nd Q 07 3rd Q 07 4th Q 07 77.92 74.5 74.9 76.3 79.8 78.9 79.2 81.7 unit B 73.6 75.89 80.75 75.3 70.8 75.06 76.4 78 unit C 66.94 79.2 68.4 69.65 78.9 80.8 86.9 85.96 unit A Compliance increased by 33.5% in unit A, by 26.7% in unit B, and by 19.5% in unit C (fig. 1). The same occurred with the proportion of patients with phosphate levels under 5.5 mg/dL, for which units A, B, and C showed compliance increases of 3.7%, 4.4%, and 19% respectively (fig. 2), and with the proportion of patients with PTH values ranging from 150-300 pg/mL, for which increases in compliance were 14.5%, 2.4%, and 13.1% in units A, B, and C respectively (fig. 3). In unit B, the proportion of iron-deficient patients (ferritin < 100 ng/mL) decreased to less than 10%, similar to the results found in the two other units (fig. 4). At study start, this unit did not reach the defined standard (ferritin levels ranging from 100-800 pg/mL: 59.3%; ferritin < 100: 39.0%; and ferritin > 800: 0.9%); after the follow-up period, optimum overall results were found (proportion of patients with ferritin levels ranging from 100-800 pg/mL: 94.1%; ferritin < 100: 5.9%; and ferritin > 800: 0%), similar to those in the two other units (unit A: ferritin < 100: 4.3%, and unit C: ferritin < 100: 4.6%). Mean EPO use in 2005 was 145.5.5 ± 13.2 U/kg/week in unit A, 226.2.2 ± 39.8 U/kg/week in unit B, and 175.5.5 ± 13.9 U/kg/week in unit C. At the end of 2007, mean EPO use significantly decreased in unit B (144.2.2 ± 15 U/kg/week) to values similar to those in the two other units (140 ± 14.2 in unit A and 135.1.1±13.8 in unit C). The erythropoietin resistance index (ERI) decreased from 26.1 to 11.3 in unit B. DISCUSSION This study shows that use of quality management tools such as monitoring of quality indicators, setting of goals with their associated improvement plans, provision and receipt of information about the results achieved (feedback), Nefrología (2008) 4, 397-406 Figure 2. Objective: to increase over 80% the proportion of patients with serum phosphorus levels < 5.5 g/dL Chisquare for linear trend: Unit A: 4.1 (p: 0.04); Unit B: 0.23 (p: 0.63); Unit C: 6.2 (p: 0.01). knowledge by the centers of their own results as compared to those of other centers (benchmarking), and the receipt of «warnings» to remind deviations from the established goals may be helpful tools to promote achievement of improved results and a decreased variability between centers. The type of study design allowed for assessing the effectiveness of the measure taken, but it is difficult to say what was the actual cause of change because this probably resulted from the sum of all these factors. Between-center variability in the outcome of hemodialysis treatment is an actual fact, that has been shown in multiple studies.15,16 Such variability may be explained by multiple and complex reasons:5-8 organizational problems; limited resources; lack of quality management tools; conceptual errors of healthcare professionals; different preferences; or differences in the demographic characteristics of the population studied. In addition, while the different therapeutic strategies are within the reach of everybody, they are not used in the same way in all centers. Even the goals and standards established for the same healthcare process are different depending on the country; for instance, guidelines for vascular access of the SEN recommend that an arteriovenous fistula should be placed in 80% of prevalent patients on hemodialysis,17 while the goal established in the K/DOQI guidelines is ≥ 40%,18 and the goal in Canada is > 60%.19 This variability may somehow be easier to understand between different countries. However, this study shows that variability exists even between centers having similar technical means and action protocols and located in the same geographic area, though it also demonstrates that such variability may be minimized. Differences between units were greater at study start as compared to study completion, after all improvement tools were implemented and achievement of common goals using similar guidelines was proposed. 403 Documento descargado de http://www.revistanefrologia.com el 19/11/2016. Copia para uso personal, se prohíbe la transmisión de este documento por cualquier medio o formato. M. D. Arenas et al. Calidad en hemodiálisis originals unit A 70 unit B unit C 60 50 40 30 20 10 Figure 3. Objective: to increase over 40% the proportion of patients with serum PTH levels ranging from 150-300 pg/mL Chi-square for linear trend: Unit A: 3.28 (p: 0.07); Unit B: 0.43 (p: 0.50); Unit C: 6 (p: 0.01). 0 1st Q 06 2nd Q 06 3rd Q 06 4th Q 06 1st Q 07 2nd Q 07 3rd Q 07 4th Q 07 unit A 32.91 39.7 43.7 41.7 40.4 39.1 43.1 47.5 unit B 43.5 49.36 40 57.78 49.7 48.7 48.5 41.1 unit C 26.4 30.5 35 42.45 37.2 38.6 59.09 39.5 Unit B significantly improved its results in terms of control of iron parameters. Decreased variability in results is important not only because of its influence on patient morbidity and mortality, but also because of its impact on costs. This study demonstrates the financial impact of changes in medical practice. Iron deficiency resulted in higher requirements of erythropoietic agents to achieve the same hemoglobin goal, which caused a lower cost-effectiveness of treatment in unit B. Control of calcium and phosphorus metabolism and bone disease in CKD represents one of the greatest challenges for nephrologists, because this is one of the areas where there is still much room for improvement. The three basic indicators for control and follow-up of this condition according to current recommendations include maintenance of serum calcium levels ranging from 8.4 and 9.5 mg/dL, control of PTH at levels ranging from 150 and 300 pg/mL, and control of phosphorus below 5.5 mg/dL. The calcium-phosphorus product was not included as an objective because compliance with this indicator was high. Measurement of vascular calcifications was not performed either because this is an indicator not sufficiently defined or accepted. No significant changes in calcium levels were unit A 60 unit B unit C 50 40 30 20 10 0 1 Q 06 2 Q 06 unit A 4.4 4.58 4.3 5.2 unit B 30 32.4 51.35 36.3 unit C 13 11.2 5.3 5.2 6 st 404 nd 3 Q 06 rd 4 Q 06 th 1 Q 07 2 Q 07 3 Q 07 5.3 5.6 5.4 4.3 41.8 19.6 7.4 5.88 5.7 5.1 4.6 st nd rd 4 Q 07 th Figure 4. Objective: to decrease under 10% the proportion of patients with ferritin levels < 100 mg/dL Chi-square for linear trend: Unit A: 0.01 (p: 0.91); Unit B: 20.9 (p < 0.0001); Unit C: 2.3 (p: 0.1). Nefrología (2008) 4, 397-406 Documento descargado de http://www.revistanefrologia.com el 19/11/2016. Copia para uso personal, se prohíbe la transmisión de este documento por cualquier medio o formato. M. D. Arenas et al. Calidad en hemodiálisis seen during the study, amongst other reasons because the most obvious changes occurred at the units from 2003,20 following publication of the K/DOQI guidelines.21 It was from that date that our clinical practice changed. The bath with a calcium content of 2.5 mEq/L was more commonly used, and prescription of calcium-based binders was decreased in favor of calciumfree binders, particularly in the group of patients with PTH levels < 150 pg/mL or with calcium levels higher than 9.5 mg/dL. These actions have resulted in improvements in some quality indicators of bone and mineral metabolism; thus, the calcium goal has continued to improve, with decreases in serum calcium levels in all three units, so that the proportion of patients who meet the goal has increased due to a decreased frequency of hypercalcemia in all three units. The objective of achieving that are least 40% of patients are in the recommended PTH range (150-300 pg/mL) was also met. Improvement in these objectives cannot be attributed to quality systems only, because it coincided with marketing of a new drug that has been shown to be highly effective for controlling both parameters, cinacalcet (a calcimimetic drug),22 which was used in approximately 16% of patients in the three units at study start but whose use had increased in all three units at the end of the study period. However, implementation of quality systems may have had an influence on the similar changes in all three units over time. Control of phosphorus is probably one of the greatest challenges faced in the treatment of patients on hemodialysis. Phosphorus has been shown to be associated to mortality,23 and the serum phosphate goal proposed for our units was therefore more ambitious than the one currently set by the Working Group on Quality Management of the SEN. The goal of this group was achievement of serum phosphate levels under 5.5 mg/dL in over 50% of patients,24 while a proportion higher than 80% was proposed for our units. This proportion was not reached, but the goal proposed surely allowed for achieving the slight improvement seen during the study period. Phosphorus control depends to a great extent of treatment adherence, and activities defined in the objective, intended to enhance adherence in non-compliant patients, probably contributed to such control, regardless of use of the available drugs. Therapeutic alternatives are available in all centers, but not all centers use them in the same way. Setting objectives helps homogenize clinical practice and use of resources. In conclusion, while the hypothetical influence of coinciding temporal factors cannot be ruled out, this study appears to show that an active approach based on the use of quality indicators and establishment of objectives, feedback, and benchmarking allows for achieving improved results. Regardless of the defined quality standards, each center should establish its own objectives either to achieve or improve such standards. Overall, all three units tended to improve their results, and to achieve more similar outcomes from the same care processes. REFERENCES 1. National Kidney Foundation. K/DOQI clinical practice guidelines for bone metabolism and disease in chronic kidney disease. Am J Kidney Dis 2003; 42 (Supl. 3): S1-201. Nefrología (2008) 4, 397-406 originals 2. Pisoni RL, Young EW, Dykstra DM et al. Vascular access use in Europe and the United States: results from the DOPPS. Kidney Int 2002; 61: 305-316. 3. Mendelssohn DC, Ethier J, Elder SJ, Saran R, Port FK, Pisoni RL. Haemodialysis vascular access problems in Canada: results from the Dialysis Outcomes and Practice Patterns Study (DOPPS II). Nephrol Dial Transplant 2006; 21 (3): 721-728. 4. Al Aly Z, González EA, Martin KJ, Gellens ME. Achieving K/DOQI laboratory target values for bone and mineral metabolism: an uphill battle. Am J Nephrol 2004; 24: 422-6. 5. Rayner HC, Besarab A, Brown WW, Disney A, Saito A, Pisoni RL. Vascular access results from the Dialysis Outcomes and Practice Patterns Study (DOPPS): performance against Kidney Disease Outcomes Quality Initiative (K/DOQI) Clinical Practice Guidelines. Am J Kidney Dis 2004; 44 (Supl. 2): 22-26. 6. Pisoni RL, Young EW, Dykstra DM et al. Vascular access use in Europe and the United States: results from the DOPPS. Kidney Int 2002; 61: 305-316. 7. Mendelssohn DC, Ethier J, Elder SJ, Saran R, Port FK, Pisoni RL. Haemodialysis vascular access problems in Canada: results from the Dialysis Outcomes and Practice Patterns Study (DOPPS II). Nephrol Dial Transplant 2006; 21: 721-728. 8. Arenas MD, Alvarez-Ude F, Egea JJ, Gil MT, Amoedo ML, Millán I, Soriano A, Sirvent AE. Impacto de seguimiento de indicadores de calidad en hemodiálisis. Nefrología 2004; 3: 261-275 9. Plantinga LC, Fink NE, Jaar BG, Sadler JH, Levin NW, Coresh J, Klag MJ, Powe NR. Attainment of clinical performance targets and improvement in clinical outcomes and resource use in hemodialysis care: a prospective cohort study. BMC Health Serv Res 2007; 9 (7): 5. 10. Rocco MV, Frankenfield DL, Hopson SD, McClellan WM. Relationship between clinical performance measures and outcomes among patients receiving long-term hemodialysis. Ann Intern Med 2006; 3(145): 512-9. 11. Ashwini R. Sehgal Impact of Quality Improvement Efforts on race and sex disparities in hemodiálisis. JAMA 2003; 289: 996-1000. 12. Parra E, Ramos R, Betriu A, Paniagua J, Belart M, Martín F, Martínez T. Estudio prospectivo multicéntrico de calidad en hemodiálisis. Nefrología 2006; 26: 688-694. 13. Bero LA, Grilli R, Grimshaw JM, Harvey E, Oxman AD, Thomson MA. Getting research finding into practice: closing the gap between research and practice: an overview of systematic reviews of interventions to promote the implementation of research findings. British Medical Journal 1998; 317: 465-468. 14. Bero LA, Grilli R, Grimshaw JM, Harvey E, Oxman AD, Thomson MA. Getting research finding into practice: closing the gap between research and practice: an overview of systematic reviews of interventions to promote the British Medical Journal 1998; 317: 465-468. 15. McClellan W, Frankenfield DL, Frederich PR, Flanders WD, AlfaroCorrea A, Rocco M, Helgerson D. Can dialysis therapy be improved? A report from ESRD Core Indicators Project. American Journal of Kidney Diseases 1999; 6: 1075-1082. 16. Cruz JM, Piera L, Bragg-Gresham JL, Feldman H, Port FK. Resultados del estudio internacional de hemodiálisis DOPPS en Europa y España. Nefrología 2003; 5: 437-443. 17. Rodríguez Hernández JA, González Parra E, Julián Gutiérrez JM et al. Vascular access guidelines for hemodialysis. Nefrología 2005; 25 (Supl. 1): 3-97. 18. National Kidney Foundation. Available at http://www.kidney.org/ professionals/kdoqi/index.cfm. Accessed december 28, 2006. 19. Jindal K, Chan CT, Deziel C et al. Hemodialysis clinical practice guidelines for the Canadian Society of Nephrology. J Am Soc Nephrol 2006; 17 (Supl. 1): S1-27. 20. Arenas MD, Álvarez-Ude F, Gil MT, Soriano A, Egea JJ, Millán I, Amoedo ML, Muray S, Carretón MA. Application of NKF-K/DOQI Clinical Practice Guidelines for Bone Metabolism and Disease: changes of clinical practices and their effects on outcomes and quality standards in three haemodialysis units. Nephrol Dial Trasplant 2006; 21: 1663-68. 21. National Kidney Foundation. K/DOQI clinical practice guidelines for bone metabolism and disease in chronic kidney disease. Am J Kidney Dis 2003; 42 (Supl. 3): S1-201. 22. Arenas MD, Álvarez-Ude F, Gil MT, Moledous A, Malek T, Núñez C, Devesa R, Carretón MA, Soriano A. Implementation of «K/DOQI Clinical Practice Guidelines for Bone Metabolism and Disease in Chronic Kidney Disease» after the introduction of cinacalcet in a popula405 Documento descargado de http://www.revistanefrologia.com el 19/11/2016. Copia para uso personal, se prohíbe la transmisión de este documento por cualquier medio o formato. originals tion of patients on chronic haemodialysis. Nephrol Dial Transplant 2007; 22: 1639-44. 23. Young EW, Albert JM, Satayathum S et al. Predictors and consequences of altered mineral metabolism: the Dialysis Outcomes and Practice Patterns Study. Kidney Int 2005; 67: 1179-87. 24. López Revuelta K, Barril G, Caramelo C, Delgado R, García López F, García Valdecasas J, Gruss E, Jiménez Almonacid P, Martínez 406 M. D. Arenas et al. Calidad en hemodiálisis Castelao A, Luis Miguel J, Ortiz A, Del Pino y Pino MD, Portolés JM, Prados C, Sanz P, Tato A, Álvarez Ude F, Angoso M, Aranaz J, Arenas MD, Lorenzo S. Desarrollo de un sistema de monitorización clínica para hemodiálisis: propuesta de indicadores del grupo de gestión de Calidad de la SEN. Nefrología 2007; 27: 542-59. Nefrología (2008) 4, 397-406
