Magnetisation of red blood cells: a Brownian Dynamics Simulation
Anuncio
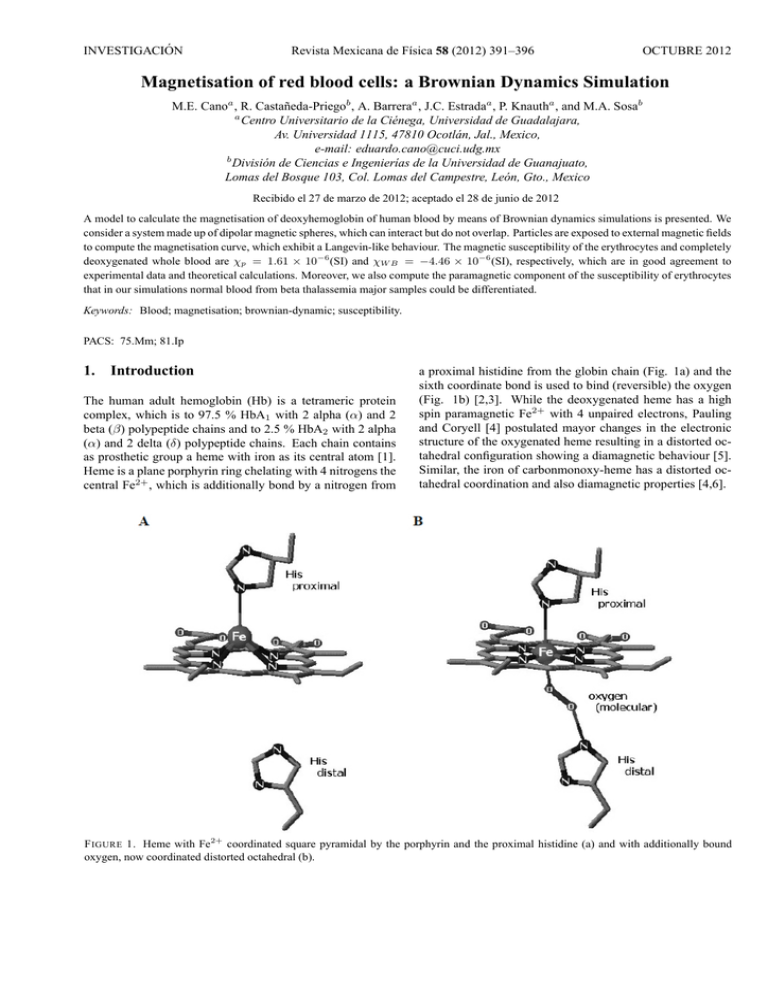
INVESTIGACIÓN Revista Mexicana de Fı́sica 58 (2012) 391–396 OCTUBRE 2012 Magnetisation of red blood cells: a Brownian Dynamics Simulation M.E. Canoa , R. Castañeda-Priegob , A. Barreraa , J.C. Estradaa , P. Knautha , and M.A. Sosab a Centro Universitario de la Ciénega, Universidad de Guadalajara, Av. Universidad 1115, 47810 Ocotlán, Jal., Mexico, e-mail: eduardo.cano@cuci.udg.mx b División de Ciencias e Ingenierı́as de la Universidad de Guanajuato, Lomas del Bosque 103, Col. Lomas del Campestre, León, Gto., Mexico Recibido el 27 de marzo de 2012; aceptado el 28 de junio de 2012 A model to calculate the magnetisation of deoxyhemoglobin of human blood by means of Brownian dynamics simulations is presented. We consider a system made up of dipolar magnetic spheres, which can interact but do not overlap. Particles are exposed to external magnetic fields to compute the magnetisation curve, which exhibit a Langevin-like behaviour. The magnetic susceptibility of the erythrocytes and completely deoxygenated whole blood are χp = 1.61 × 10⁻⁶ (SI) and χW B = −4.46 × 10⁻⁶ (SI), respectively, which are in good agreement to experimental data and theoretical calculations. Moreover, we also compute the paramagnetic component of the susceptibility of erythrocytes that in our simulations normal blood from beta thalassemia major samples could be differentiated. Keywords: Blood; magnetisation; brownian-dynamic; susceptibility. PACS: 75.Mm; 81.Ip 1. Introduction The human adult hemoglobin (Hb) is a tetrameric protein complex, which is to 97.5 % HbA1 with 2 alpha (α) and 2 beta (β) polypeptide chains and to 2.5 % HbA2 with 2 alpha (α) and 2 delta (δ) polypeptide chains. Each chain contains as prosthetic group a heme with iron as its central atom [1]. Heme is a plane porphyrin ring chelating with 4 nitrogens the central Fe2+ , which is additionally bond by a nitrogen from a proximal histidine from the globin chain (Fig. 1a) and the sixth coordinate bond is used to bind (reversible) the oxygen (Fig. 1b) [2,3]. While the deoxygenated heme has a high spin paramagnetic Fe2+ with 4 unpaired electrons, Pauling and Coryell [4] postulated mayor changes in the electronic structure of the oxygenated heme resulting in a distorted octahedral configuration showing a diamagnetic behaviour [5]. Similar, the iron of carbonmonoxy-heme has a distorted octahedral coordination and also diamagnetic properties [4,6]. F IGURE 1. Heme with Fe2+ coordinated square pyramidal by the porphyrin and the proximal histidine (a) and with additionally bound oxygen, now coordinated distorted octahedral (b). 392 M.E. CANO, R. CASTAÑEDA-PRIEGO, A. BARRERA, J.C. ESTRADA, P. KNAUTH, AND M.A. SOSA The paramagnetic molar susceptibility of deoxyhemoglobine (HHb) is 3,000 mol/ml [7] and by determining a magnetisation curve for erythrocytes the magnetic dipole moment of HHb is estimated to be 8 µB or µHHb = 7.42×10⁻²³ Am2 [8]. In a strong static magnetic field an erythrocyte responds in such way that its disk plane is oriented parallel to the direction of the magnetic field, independently of the hemoglobin state, i.e., oxygenated (diamagnetic HbO2 ) or deoxygenated (paramagnetic HHb) [9]. It has also been observed that the blood viscosity increases with the magnitude of the magnetic field [10]. These characteristics can be used for separating erythrocytes from other blood cells [11-13]. The magnetic susceptibility of fully deoxygenated erythrocytes χRBC has been measured directly or indirectly by several authors employing very precise methods. Spees et al. [14] determined a value of -6.1 ppm (SI) by using separately Magnetic Resonance and a superquantum interferometer device (SQUID), Zborowski et al. obtained -5.72 ppm (SI) [15] from a measurement of the magnetic migration with an experimental set up for magnetophoresis, while Haik et al. [16] measured +3.5 ppm (SI) in human whole blood by using a SQUID and very high magnetic fields (around 5 T). Nevertheless, the relative volumes of water and erythrocytes under normal conditions are considered to be 0.52 and 0.48, respectively [17], which implies a value of χRBC =17.10 ppm (SI). Also Melville [18] and Owen [19] determined values of +3.88 ppm (SI) and +3.86 ppm (SI) respectively, in experimental arrays applying a very strong magnetic field gradient, too. In summary, the value of χRBC is reported in the interval - 6.1 ppm ≤ χRBC ≤ 17.10 ppm, exhibiting discrepancies, which may have started with confusion in the nomenclature: e.g. a value originally calculated as “susceptibility” [18], based on results from [20], was later cited as “relative susceptibility” [21,22]. In another case the magnetic susceptibility of whole blood was not differentiated from the one of erythrocytes, resulting in the maximum value of χRBC = 17.10 ppm [16], although this was corrected in a following publication [10]. On the other hand, in magnetophoretic experiments for trapping erythrocytes is possible determine indirectly the value of χRBC . Some models used the magnetic saturation effect of HHb [18], while others only took into account the linear response of the magnetisation [10,15]. The quotient between the magnetic and thermal energies Um /UT = µHHb B/kB T , applying the effective magnetic moment of HHb (21.84 µB [4]) and the typical magnetic fields for these kind of experiments (2-14 T [16]) at room temperature, result in a range of 0.1 - 0.7 for Um /UT . This may indicate a beginning of magnetic saturation of HHb, i.e. the linear regime (Um /UT ¿ 1) would not be a good approximation to determine the paramagnetic component of χRBC. . In this scenario of non linear response of the magnetisation, the paramagnetic component could look like over dominated for the diamagnetic component. Nevertheless, at least the sign of the magnetic susceptibility of fully deoxy- genated erythrocytes could be rapidly determined with an experimental setup, based on an analytical balance and a strong magnet [23-25]. Recently we introduced a primitive model based on a fluid of dipolar spheres that accounted for both, the magnetic susceptibility of human blood [26] and the superparamagnetic behaviour of synthetic eumelanin [27] by calculating their magnetisation curve. To carry out this mathematical modelling it is necessary to introduce as input the magnetic dipolar moment of a single cell or crystal (with the diameter σ), which can be measured independently, for instance, by electron paramagnetic resonance (EPR) [27]. Moreover, this model can be used to highlight the dipolar contribution to the magnetic susceptibility in other biological systems of interest. Furthermore, for theoretical studies of biological systems and complex fluids it is important to determine the basic molecular features that are necessary for a proper modelling and since many years primitive models are very useful in simulating complex fluids [28]. Hence, in this work the mean magnetisation and the magnetic susceptibility of a liquid containing free HHb is estimated by using Brownian dynamics (BD) simulations of dipolar magnetic spheres exposed to external magnetic fields. The HHb is modelled as soft-core spheres (with a repulsive Yukawa-like potential at short distances) and the physical parameters such as solvent viscosity, magnetic moment of the particles, density and sphere diameter are taken from experiments carried out by other authors [8,15]. Other necessary parameters such as temperature and uniform magnetic field are varied in the same range than in the reported experiments. Finally, the paramagnetic component of erythrocytes for different blood samples, i.e., normal and beta thalassaemia major, are reported and compared with experimental data [29]. 2. Model system and Brownian dynamics simulation We perform Brownian dynamics simulations for a system with N particles carrying effective magnetic dipole moments. The particles are exposed to an uniform magnetic field and move within a box of the length L. Periodic boundary conditions in all directions are considered [30]. The particles move according to the Ermak and McCammon algorithm [31,32]: ~ri (t + ∆t) = ~ri (t) + × N X Dt ∆t kB T ~ i (∆t), F~ij + ∇V HSY + R (1) j=1 where ~ri (t) is the particle position at the time t, Dt is the freeparticle translational diffusion coefficient, kB is the Boltzmann constant, T the absolute temperature, ∆t is the time * step, F ij is the force on the ith particle due to dipole-dipole ~ i (∆t) is the random interaction with the j th particle and R Rev. Mex. Fis. 58 (2012) 391–396 MAGNETISATION OF RED BLOOD CELLS: A BROWNIAN DYNAMICS SIMULATION displacement caused by the collisions with the solvent. According to the fluctuation-dissipation theorem this random displacement has zero mean and covariance [31,32], hRi (∆t) Rj (0)i = 2Dt ∆tδij , (2) where δij is the Kronecker delta. In our model we have introduced a short-range and continuous repulsion to avoid overlap between particles, which is given by F~ HSY = −∇V HSY , (3) where rij is the distance between the two particles i and j, θi and θj are the angles between the vector ~rij and the unit vectors ei and ej , respectively, and γij is the angle between the unit vectors themselves. The internal torques between the dipoles i and j can be expressed as follows [30]: µ ¶ ei × ~rij ei × ej − 3 cos θj , rij µ ¶ µ2 ej × ~rij ~ Tji = − 3 ej × ei − 3 cos θi , rij rij 2 µ T~ij = − 3 rij where e−κ(r−σ) V (r) = V0 r is the so-called Yukawa potential [33], r is the distance between two particles, κ is the Debye screening parameter, σ is the particle diameter and V0 is the amplitude of the potential. The parameters κ and V0 were chosen to guarantee both, the continuity of the force at short distance and the avoidance of particle overlap. Similarly, other purely repulsive soft-sphere potentials have been employed by Bernu and Miyagawa [34,35] . Similar to (1), the dipole orientation is calculated according to the equation: Dr ∆t w ~ i (t + ∆t) = w ~ i (t) + kB T N X ~ + S ~i (∆t), (4) × T~ij + µ ~i × B HSY j=1 hSi (∆t)Sj (0)i = 2Dr ∆t. (5) The Stokes-Einstein relations define both, the translational and rotational diffusion coefficients, Eq. (6) and (7), respectively: kB T Dt = , (6) 3πησ and 2kB T Dr = , (7) πησ 3 where η is the viscosity of the solvent. The dipole-dipole forces are given by the standard equation in spherical coordinates [30], · µ ¶ 3µ2 ~rij F~ij = 4 (cos γij − 5 cos θi cos θj ) rij rij ¸ + cos θj ei + cos θi ej , (8) (9) (10) The mean magnetisation, i.e. the magnetic dipole moment per volume, is determined by the Eq. (1) considering a spherical volume with a diameter of L, ~ = M 3 N 4π X µei . ¡ L ¢3 2 (11) i=1 In the case of soft homogeneous magnetic systems, the magnetic susceptibility is given by the following expression, M = χH. 3. where w ~ i (t)is the orientation vector respect to the lab frame of reference, µ ~ i is the dipole moment, Dr is the rotational diffusion coefficient of the free-particle, T~ij is the torque of the ~ is ith particle due to interactions with the j th particle, µ ~i × B ~ ~ the torque induced by the external magnetic field B = µ0 H, where µ0 is the magnetic permeability of the vacuum, and ~i (∆t) is the random angular displacement with zero mean S and variance, 393 (12) Modelling of Erythrocytes and Results The magnetic properties of the blood can be described as a flux of HHb with a magnetic dipole moment of µHHb = 7.42×10⁻²³ A∗m2 [8], a diameter of σHHb =6.4 nm [15] and a density of ρ = 1.3×10¹⁸ Hb/ml [8], which corresponds to 4.86×10⁹ erythrocytes/ml. At room temperature of T = 300 K the mean viscosity is ηg = 0.96×10⁻³ kg/m*s [15]. Thus both, the translational and the rotational diffusion coefficients (see Eqs. (6) and (7)) can be directly computed. These coefficients are explicitly used in the Eqs. (1) and (4) to dynamically displace the particles and rotate the magnetic dipole. In our simulations, we use a time step of ∆t = 0.5 × 10⁻⁹ s. In order to reach the thermodynamic equilibrium, 4×10⁶ time steps are considered, but to get good statistics and to reduce the associated uncertainties, 5×10⁶ time steps are carried out. Since the thermodynamic limit of the magnetisation is reached making N−1 →0, we calculated the curve H vs M employing N = 108, 256 and 500 particles with a magnetic field ranging from −1T to +1T (Fig. 2). Our results exhibit no significant differences between the magnetisation curves employing 256 or 500 particles, in contrast to the one calculated with only 108 particles. The clear continuous magnetisation transition with an almost linear dependence at small values of H is remarkable. However, in general we observe Rev. Mex. Fis. 58 (2012) 391–396 394 M.E. CANO, R. CASTAÑEDA-PRIEGO, A. BARRERA, J.C. ESTRADA, P. KNAUTH, AND M.A. SOSA F IGURE 2. Magnetisation curves of HHb obtained by BD simulation model with N = 108, 256 and 500 particles, also the respective data fits using equation (13). that our data can be well described in terms of the Langevin theory. Indeed, the simulation data can be fitted using the Langevin expression for magnetisation, µ ¶ µH M (H) = Msat tanh , (13) kB T where Msat is the saturation magnetisation. Previous equation can be derived from the Brillouin equation by taking J = 1/2 [36], being J the total spin. A close inspection of the magnetisation behaviour for the system of Fig. 2, is depicted in Fig. 3, with H ranging from −1T to +1T . Additionally, we present results obtained in Ref. 26 by means of Monte Carlo (MC) simulations and experimental data reported by Sakhnini [8]. We observe that our BD data are quantitatively in good agreement with those discussed in the literature [8,26]. Moreover, the following features can be noticed: On one hand, our BD magnetisation curve shows two outliers at H = 0.4 T and H = -0.4 T, similar to the ones measured in the magnetisation curve determined experimentally in Ref. 29. On the other hand, several outliers of the MC simulation curve (NVT ensemble) [26] within the range of H = 0.2 T – 1T are clearly observed. Then, the difference between both simulation schemes could be related to the fact that a short-range repulsive interaction and the viscosity are not explicitly included in the MC simulations [26]. From the slope of the linear region of the magnetisation curve displayed in Fig. 3 (thick line), the magnetic susceptibility is found to be χp = 1.61×10⁶ (SI). This value is less than three times smaller than the experimentally obtained as reported Ref. 17 and 18, but they use very strong gradients of magnetic field; nevertheless, our result is in good agreement with [8] from where our simulation was fed: χ = 1.1×10⁻¹⁷ (emu*Oe−1 ) per erythrocyte, this is χ = 1.57×10⁻⁶ (SI) considering the measured mean volume of erythrocytes in the experiment (87.9 fL) and the conversion of units (in CGS units χ (CGS) = 4π*χ (SI)). The obtained value of χp is also F IGURE 3. Magnetisation curve of HHb in the same units system than [8], obtained by using our BD simulation model with N=500 particles (closed black circles). Data taken from MC simulations [26] (open rhombus) and experiments (EXP) [8] (open circles). in good agreement with our result obtained by MC simulations [26]; χ = 7.5×10⁷ (SI). Furthermore, the initial paramagnetic component of total magnetic susceptibility of HHb can be calculated using the Langevin-Brillouin function for the ideal case of punctual dipoles χ= N µ2 = 1.65 × 10⁻⁶ (SI). 3kB T Additionally, the magnetic susceptibility of the whole blood,χW B , can be expressed in terms of two main components, namely the paramagnetic component of HHb and a diamagnetic component, mainly due to water. Hence, χW B can be expressed as χW B = νp χp + νd χd , (14) where χp and χd are the paramagnetic and diamagnetic susceptibilities, respectively, and νp and νd are the relative volumes. It is well-known that the diamagnetic susceptibility of the plasma is the same of water χd = 9.05×10⁻⁶ (SI) [37]. Thus, multiplying the mean corpuscular value of the erythrocytes with the cell number as measured in [8], the relative volumes of the erythrocytes and plasma of the whole blood is calculated to be νd ≈ 0.57 and νp = 1 - νd ≈ 0.43. Thus, our value for the magnetic susceptibility of whole blood is χW B = −4.46 × 10⁻⁶ (SI); a value very close to χW B = −4.48 × 10⁻⁶ (SI) as obtained in Ref. 8. So far we have been focused on the magnetisation properties of erythrocytes under healthy conditions. However, it is of our interest to determine the accurateness of our model to account for the magnetic behaviour of human blood suspensions under different conditions. In Table I we show two blood indices: the Hb concentration and the mean corpuscular volume of fully deoxygenated erythrocytes, as well as the values of the magnetic moment of HHb obtained from a normal female volunteer (NF1) and Rev. Mex. Fis. 58 (2012) 391–396 395 MAGNETISATION OF RED BLOOD CELLS: A BROWNIAN DYNAMICS SIMULATION TABLE I. Blood indices of erythrocytes of a normal female (NF1) and two with beta thalassemia major disease (TM1) and (TM2), also their magnetic moments obtained from [29] and their paramagnetic susceptibilities. Sample Hemoglobin Mean Corpuscular Vulume χp Molecule/Erythrocyte (MCV)(fL) (emu/Oe )×1017 ×10 µeff (µs ) 6 NF1 259 88 1.03 7.6 TM1 248 86.0 0.95 7.4 TM2 257 84.0 1.10 7.9 χT M 2 = 1.18 × 10⁻¹⁷ (emu*Oe−1 ) exhibit differences of 6% and 7 %, respectively. Although only minor differences between χN F 1 and χT M 2 can be observed (Fig. 4), due to multiple blood transfusions that volunteer TM2 has received just before (see explanation in Ref. 29), the differences between χN F 1 and χT M 1 , from the untreated volunteer TM1, are significant. 4. F IGURE 4. Magnetisation in the same units system than [29] obtained in the case of normal Hb (black rectangle) plus two cases of abnormal Hb TM1 and TM2 (open circle and black triangle) and their corresponding linear fit. two volunteers suffering beta thalassemia major (TM1 and TM2, respectively), taken from [29]. So these parameters are introduced in our BD simulation model to determine the paramagnetic component of both, the normal and the abnormal HHb. In the graphs displayed in Fig. 4, are shown three magnetisation curves obtained from our BD simulation model for the cases discussed in the previous paragraph. The corresponding measured values of χp per erythrocyte are shown in the fourth column of the Table I in CGS units. We find that our predictions are very close to those obtained using a vibrating sample magnetometer. Particularly, for the normal state our prediction is with χN F 1 = 1.13 × 10⁻¹⁷ (emu*Oe−1 ) only 9 % bigger than the experimental one and for the cases of beta thalassemia major χT M 1 = 1.01 × 10⁻¹⁷ (emu*Oe−1 ) and Conclusion In this work we have introduced a single approximation for modelling the magnetic behaviour of the human blood as a suspension made up of soft-core particles with a magnetic dipole. The magnetisation curve and the magnetic susceptibility were calculated and, in general, our results are in very good agreement with those data obtained experimentally or by means of Monte Carlo computer simulations. Furthermore, the value obtained for the magnetic susceptibility is in the interval reported by several authors [14-18]. Moreover, here we have shown that this simple model can be used to account quantitatively the magnetic properties of human blood samples under different health conditions. Finally, we should stress that our BD computer simulation scheme for human blood can be easily used and extended to study other magnetic properties of the blood, such as the magnetic mobility or the magnetophoretic velocity when a gradient of magnetic field is introduced. Work along these lines is in process. Acknowledgement This work was partially supported by, CONACYT (grants “APOY-COMPL-2009: 118168”, 61418/2007, 102339/2008). 1. C. K. Mathews, K. E. van Holde and K. G. Ahern Biochemistry Vol. 1 (San Francisco: Addison Wesley Longman, 2002). 4. L. Pauling and C. D. Coryell, Proc. Nat. Acad. Sci. USA 22 (1936) 210. 2. K. Shikama, Prog. Biophys. Mol. Biol. 91 (2006) 83. 5. Z. Zhang, Ph.D. thesis, Boston (MA: Northeastern University, 2009). 3. K. Shikama, Crit. Rev. Biochem. Mol. Biol. 39 (2004) 217. Rev. Mex. Fis. 58 (2012) 391–396 396 M.E. CANO, R. CASTAÑEDA-PRIEGO, A. BARRERA, J.C. ESTRADA, P. KNAUTH, AND M.A. SOSA 6. M. Cerdonio, S. Morante, D. Torresani, S. Vitale, A. de Young and R. W. Noble, Proc. Nat. Acad. Sci. USA 82 (1985) 102. 7. M. Cerdonio, S. Morante and S. Vitale, Methods Enzymol. 76 (1981) 354. Chemical, Physical and Biological Processes under High Magnetic Fields (1999, Omiya, Saitama, Japan, Submitted January 27, 2000). 8. L. Sakhnini and R. Khuzaie, Eur. Biophys J. 30 (2001) 467. 23. M. E. Cano, T. Cordova-Fraga, M. Sosa, J. Bernal-Alvarado, and O. Baffa, Eur. J. Phys. 29 (2008) 345. 9. T. Higashi et al., Blood 82 (1993) 1328. 24. M. Sosa et al., Rev. Mex. Fis. E 52 (2006) 111. 10. Y. Haik, V. Pai and C. J. Chen, J. Magnetism Magnet. Mat. 225 (2001) 180. 11. H. Watarai and M. Namba, J. Chromatogr. A. 961 (2002) 3. 12. C. S. Owen, Biophys. J. 22 (1978) 171. 13. E. P. Furlani, J. Phys. D: Appl. Phys. 40 (2007) 1313. 14. W. M. Spees, D. A. Yablonskiy, M. C. Oswood, and J. H. Ackerman, Magnet. Reson. Med. 45 (2001) 533. 15. M. Zborowski, G. R. Ostera, L. R. Moore, S. Milliron, J. J. Chalmers and A. N. Schechter, Biophys. J. 84 (2003) 2638. 16. Y. Haik, V. Pai, C. J. Chen, Journal of Magnetism and Magnetic Materials 194 (1999) 254. 17. W. K. Purves, D. Sadava, G. H. Orians, H. C. Heller Life: The Science of Biology 7th ed. (Sunderland, Mass: Sinauer Associates, 2004). pp. 954. 18. D. Melville, F. Paul and S. Roath, IEEE Transactions on Magnetics 11 (1975) 1701. 19. C. S. Owen, J. Appl. Phys. 53 (1992) 3884. 20. D. S. Taylor and C. D. Coryell, J. Am. Chem. SOC., 60 (1938) 1177. 21. D. Melville, F. Paul and S. Roath, IEEE TRANSACTIONS ON MAGNETICS 6 (1982) 1680. 22. M. Takayasu, D. R. Kelland, J. V. Minervini, F. J. Friedlaender, and S. R. Ash, Proceeding of the International Workshop on 25. R. S. Davis, Am. J. Phys. 60 (1992) 365. 26. M. E. Cano, A. Gil-Villegas, M. A. Sosa, J. C. Villagómez and O. Baffa, Chem. Phys. Lett. 432 (2006) 548. 27. M. E. Cano et al., Photochemistry and Photobiology, 84 (2008) 627. 28. D. Frenkel, B. Smit, Understanding Molecular Simulation Vol. 1 (Academic Press, 1996). 29. L. Sakhnini, Journ. of Appl. Phys. 93 (2003) 6721. 30. M. P. Allen M P and D.J. Tildeslay, Computer Simulation of Liquids Vol. 1 (Oxford Science Publications, 1987). 31. D. L. Ermak and J. A. McCammon, J. Chem. Phys. 69 (1978) 1352. 32. E. Ermakova, A. G. Krushelnitsky and V. D. Fedotov, Molecular physics 100 (2002) 2849. 33. L. F. Rojas-Ochoa, R. Castañeda-Priego, V. Lobaskin, A. Stradner, F. Scheffold and P. Schurtenberger, Phys. Rev. Lett. 100 (2008) 178304. 34. B. Bernu, J. P. Hansen, Y. Hiwatari and G. Pastore, Phys. Rev. A 36 (1987) 4891. 35. H. Miyagawa and Y. Hiwatari, Phys. Rev. A 40 (1989) 6007. 36. S. D. Cullity Introduction to magnetic materials Vol. 1 (Addison-Wesley, New York, 1972). pp. 100-110. 37. J. F. Schenck, J. Magnet. Reson. Imaging 12 (2000) 2. Rev. Mex. Fis. 58 (2012) 391–396
