Archivo pdf
Anuncio

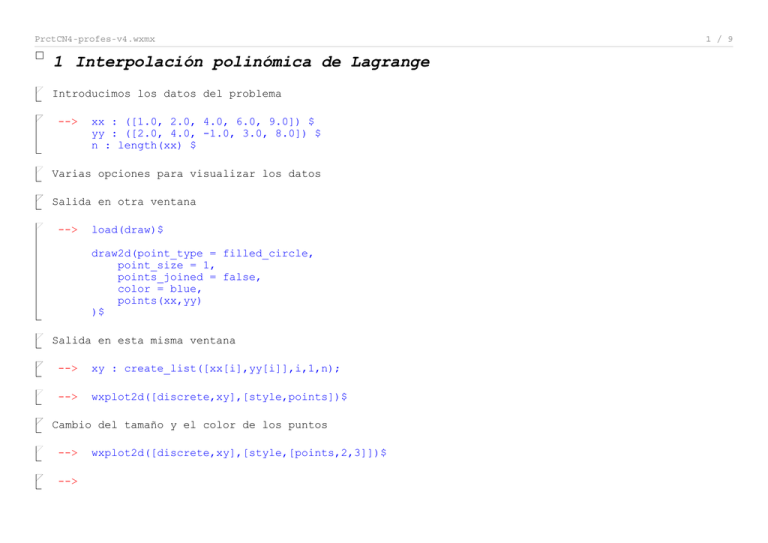
PrctCN4-profes-v4.wxmx 1 Interpolación polinómica de Lagrange Introducimos los datos del problema --> xx : ([1.0, 2.0, 4.0, 6.0, 9.0]) $ yy : ([2.0, 4.0, -1.0, 3.0, 8.0]) $ n : length(xx) $ Varias opciones para visualizar los datos Salida en otra ventana --> load(draw)$ draw2d(point_type = filled_circle, point_size = 1, points_joined = false, color = blue, points(xx,yy) )$ Salida en esta misma ventana --> xy : create_list([xx[i],yy[i]],i,1,n); --> wxplot2d([discrete,xy],[style,points])$ Cambio del tamaño y el color de los puntos --> --> wxplot2d([discrete,xy],[style,[points,2,3]])$ 1 / 9 PrctCN4-profes-v4.wxmx 1.1 Fórmula de Lagrange Base de Lagrange --> xx : [1.0, 2.0, 4.0, 6.0, 9.0] $ yy : ([2.0, 4.0, -1.0, 3.0, 8.0]) $ n : length(xx) $ xy : create_list([xx[i],yy[i]],i,1,n); --> l(i,x) := product((x-xx[j])/(xx[i]-xx[j]),j,1,i-1) * product((x-xx[j])/(xx[i]-xx[j]),j,i+1,n)$ Polinomio interpolante --> pol1(x) := sum(yy[i]*l(i,x),i,1,n)$ --> pol1(x)$ --> expand(pol1(x)); Gráficas (dando varias opciones para hacerlas) --> load(draw)$ draw2d(point_type = filled_circle, point_size = 1, points_joined = false, color = blue, points(xx,yy), color = red, explicit(pol1(x), x, xx[1], xx[n]) )$ 2 / 9 PrctCN4-profes-v4.wxmx --> wxplot2d( [[discrete,xy], pol1], [x, xx[1], xx[n]], [style, [points,3,2], [lines,1,1]]) $ --> wxplot2d( [[discrete,xy],pol1], [x, xx[1], xx[n]], [y,-3,15], [style, [points,3,1], [lines,1,2]]) $ 1.2 Fórmula de Newton --> xx : ([1.0, 2.0, 4.0, 6.0, 9.0]) $ yy : ([2.0, 4.0, -1.0, 3.0, 8.0]) $ n : length(xx) $ xy : create_list([xx[i],yy[i]],i,1,n); Construimos la tabla de diferencias divididas --> tdd : zeromatrix(n, n) $ tdd[1] : yy $ tdd : transpose(tdd) $ for j : 2 thru n do( for i : j thru n do( tdd[i,j] : (tdd[i-1, j-1]-tdd[i,j-1])/(xx[i-j+1]-xx[i]) ) )$ tdd; --> pol2(x) := sum(tdd[i,i]*prod((x-xx[j]),j,1,i-1),i,1,n)$ --> expand(pol2(x)); --> 3 / 9 PrctCN4-profes-v4.wxmx Gráficas --> load(draw)$ draw2d(point_type = filled_circle, point_size = 1, points_joined = false, color = blue, points(xx,yy), color = green, explicit(pol2(x), x, xx[1], xx[n]) )$ --> wxplot2d( [[discrete,xy],pol2], [ x, xx[1], xx[n]], [style, [points,3,1], [lines,1,3]]) $ 2 Interpolación con funciones Spline 2.1 Potencias truncadas --> potr(x, x0, m) := if x<x0 then 0 else (x-x0)^m $ 2.2 Spline lineal --> xx : ([1.0, 2.0, 4.0, 6.0, 9.0]) $ yy : ([2.0, 4.0, -1.0, 3.0, 8.0]) $ n : length(xx) $ xy : create_list([xx[i],yy[i]],i,1,n); --> /* Para evitar la racionalización de números decimales en coma flotante */ keepfloat : true $ 4 / 9 PrctCN4-profes-v4.wxmx --> c1 : makelist(c1[i], i, 1, n)$ s1(x) := c1[1] + c1[n]*x + sum(c1[i]*potr(x,xx[i],1),i,2,n-1)$ eqn1 : makelist(s1(xx[i])= yy[i], i, 1, n)$ coef1 : linsolve(eqn1,c1)$ --> s1(x); Gráficas --> load(draw)$ draw2d( point_type = filled_circle, point_size = 1, points_joined = false, color = blue, points(xx,yy), color = magenta, explicit(subst(coef1,s1(x)), x, xx[1], xx[n]) )$ --> --> ss1(x) := subst(coef1,s1(x)) $ wxplot2d( [[discrete,xy],ss1], [x, xx[1], xx[n]], [y,-3,15], [style, [points,3,1], [lines,1,4]]) $ 5 / 9 PrctCN4-profes-v4.wxmx 2.3 Spline cuadrático --> xx : ([1.0, 2.0, 4.0, 6.0, 9.0]) $ yy : ([2.0, 4.0, -1.0, 3.0, 8.0]) $ n : length(xx) $ xy : create_list([xx[i],yy[i]],i,1,n); --> dpotr(x, x0, m) := if x<x0 then 0 else m*(x-x0)^(m-1) $ --> keepfloat : true $ --> c2 : makelist(c2[i],i,1,n+1)$ s2(x) := c2[1] + c2[n]*x + c2[n+1]*x^2 + sum(c2[i]*potr(x,xx[i],2),i,2,n-1)$ ds2(x) := c2[n] + 2*c2[n+1]*x + sum(c2[i]*dpotr(x,xx[i],2),i,2,n-1)$ --> eqn2 : append(makelist(s2(xx[i])= yy[i], i, 1, n), [ds2(xx[1])= (xx[1]-xx[2])/(yy[1]-yy[2])])$ coef2 : linsolve(eqn2,c2)$ --> 6 / 9 PrctCN4-profes-v4.wxmx Gráficas --> load(draw)$ draw2d( point_type = filled_circle, point_size = 1, points_joined = false, color = blue, points(xx,yy), color = cyan, explicit(subst(coef2,s2(x)), x, xx[1], xx[n]) )$ --> ss2(x) := subst(coef2,s2(x)) $ wxplot2d( [[discrete,xy],ss2], [x, xx[1], xx[n]], [y,-6,17], [style, [points,3,1], [lines,1,6]]) $ 2.4 Spline cúbico sujeto --> xx : ([1.0, 2.0, 4.0, 6.0, 9.0]) $ yy : ([2.0, 4.0, -1.0, 3.0, 8.0]) $ n : length(xx) $ xy : create_list([xx[i],yy[i]],i,1,n); --> keepfloat : true $ 7 / 9 PrctCN4-profes-v4.wxmx --> c3 : makelist(c3[i],i,1,n+2)$ s3(x) := c3[1] + c3[n]*x + c3[n + 1]*x^2 + c3[n + 2]*x^3 + sum(c3[i]*potr(x, xx[i], 3), i, 2, n - 1)$ ds3(x) := c3[n] + 2*c3[n+1]*x + 3*c3[n+2]*x^2 + sum(c3[i]*dpotr(x,xx[i],3),i,2,n-1)$ eqn3 : append(makelist(s3(xx[i])= yy[i], i, 1, n), [ds3(xx[1])= 0, ds3(xx[n])=0])$ coef3 : linsolve(eqn3,c3)$ Gráficas --> load(draw)$ draw2d( point_type = filled_circle, point_size = 1, points_joined = false, color = blue, points(xx,yy), color = green, explicit(subst(coef3,s3(x)), x, xx[1], xx[n]) )$ --> --> ss3(x) := subst(coef3,s3(x)) $ wxplot2d( [[discrete,xy],ss3], [x, xx[1], xx[n]], [y,-3,15], [style,[points,3,1],[lines,1,3]]) $ 8 / 9 PrctCN4-profes-v4.wxmx Gráficas conjuntas de los splines --> load(draw)$ draw2d( point_type = filled_circle, point_size = 1, points_joined = false, color = blue, points(xx,yy), color = magenta, explicit(subst(coef1,s1(x)), x, xx[1], xx[n]), color = cyan, explicit(subst(coef2,s2(x)), x, xx[1], xx[n]), color = green, explicit(subst(coef3,s3(x)), x, xx[1], xx[n]) )$ --> wxplot2d( [[discrete,xy],ss1,ss2,ss3],[x, xx[1], xx[n]], [style, [points,3,1],[lines,1,4],[lines,1,6],[lines,1,3]]) $ --> wxplot2d( [[discrete,xy],ss1,ss2,ss3],[x, xx[1], xx[n]], [y,-6,20], [style, [points,3,1],[lines,1,4],[lines,1,6],[lines,1,3]]) $ 9 / 9


