September 7, 2016 Dear CPS Families, We hope that you and your
Anuncio
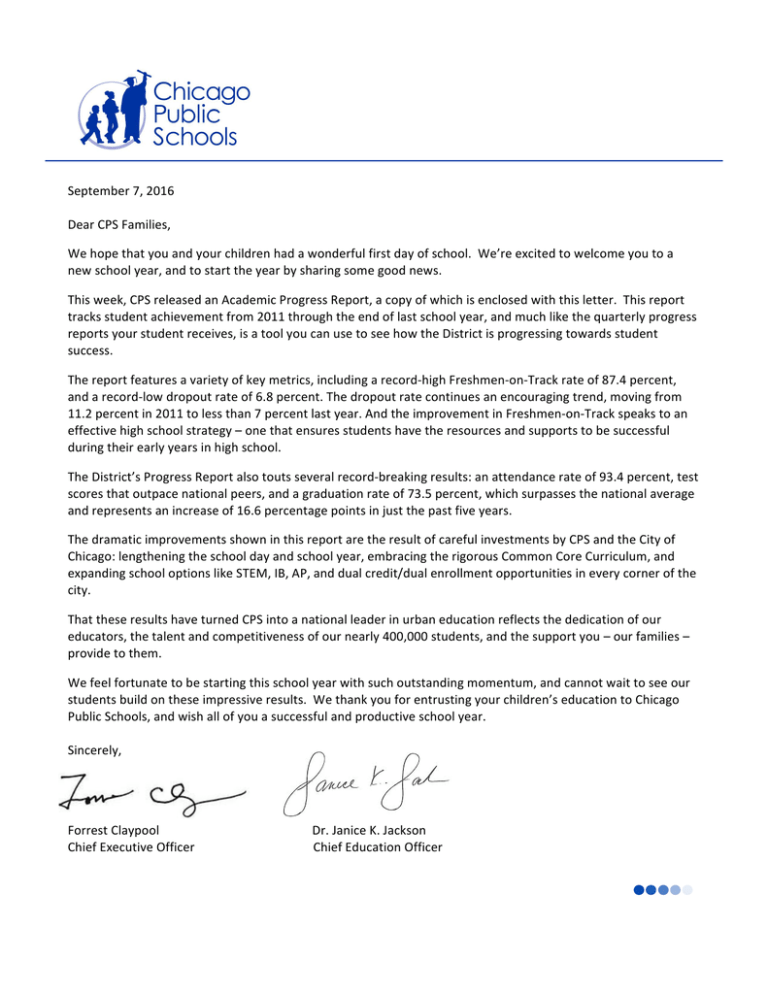
September 7, 2016 Dear CPS Families, We hope that you and your children had a wonderful first day of school. We’re excited to welcome you to a new school year, and to start the year by sharing some good news. This week, CPS released an Academic Progress Report, a copy of which is enclosed with this letter. This report tracks student achievement from 2011 through the end of last school year, and much like the quarterly progress reports your student receives, is a tool you can use to see how the District is progressing towards student success. The report features a variety of key metrics, including a record-­‐high Freshmen-­‐on-­‐Track rate of 87.4 percent, and a record-­‐low dropout rate of 6.8 percent. The dropout rate continues an encouraging trend, moving from 11.2 percent in 2011 to less than 7 percent last year. And the improvement in Freshmen-­‐on-­‐Track speaks to an effective high school strategy – one that ensures students have the resources and supports to be successful during their early years in high school. The District’s Progress Report also touts several record-­‐breaking results: an attendance rate of 93.4 percent, test scores that outpace national peers, and a graduation rate of 73.5 percent, which surpasses the national average and represents an increase of 16.6 percentage points in just the past five years. The dramatic improvements shown in this report are the result of careful investments by CPS and the City of Chicago: lengthening the school day and school year, embracing the rigorous Common Core Curriculum, and expanding school options like STEM, IB, AP, and dual credit/dual enrollment opportunities in every corner of the city. That these results have turned CPS into a national leader in urban education reflects the dedication of our educators, the talent and competitiveness of our nearly 400,000 students, and the support you – our families – provide to them. We feel fortunate to be starting this school year with such outstanding momentum, and cannot wait to see our students build on these impressive results. We thank you for entrusting your children’s education to Chicago Public Schools, and wish all of you a successful and productive school year. Sincerely, Forrest Claypool Dr. Janice K. Jackson Chief Executive Officer Chief Education Officer 7 de septiembre de 2016 Estimadas familias de CPS, Confiamos en que ustedes y sus hijos hayan tenido un maravilloso primer día de clases. Estamos muy entusiasmados en darles la bienvenida a un nuevo año escolar y en comenzar el año compartiendo algunas buenas noticias. Esta semana, CPS divulgó un Reporte de Progreso Académico, cuya copia adjuntamos a esta carta. Este reporte hace un seguimiento de los logros estudiantiles desde el 2011 hasta el final del último año escolar, y como los informes trimestrales de progreso que reciben los estudiantes, esta es una herramienta que usted puede usar para ver cómo progresa el Distrito hacia el éxito de su alumnado. El reporte incluye una variedad de métricas, incluyendo una tasa record de 87.4 por ciento de estudiantes de primer año (Freshmen) en camino a la graduación, y una tasa de 6.8 por ciento de abandonos en el primer año, que es récord por lo baja. La tasa de abandono escolar continúa en una tendencia alentadora, pasando del 11.2 por ciento en 2011 a menos del 7 por ciento el año pasado. Y el mejoramiento de estos estudiantes habla de una estrategia efectiva, que asegura que todos los estudiantes dispongan de los recursos y apoyos necesarios para ser exitosos durante sus primeros años en la escuela superior. El Reporte de Progreso del Distrito también destaca varios resultados que son récord: una tasa de asistencia del 93.4 por ciento, calificaciones en pruebas que superan a las logradas por sus pares a nivel nacional, y una tasa de graduación del 73.5 por ciento, que supera el promedio nacional y representa un incremento de 16.6 puntos de porcentaje en los últimos cinco años. Estas mejoras impresionantes que muestra el reporte son resultado de inversiones cuidadosas realizadas por CPS y la ciudad de Chicago: la extensión del día y año escolar, la adopción del riguroso currículo de Estándares Estatales Comunes y la expansión de opciones escolares como STEM, Bachillerato Internacional y Ubicación Avanzada, así como oportunidades de participar en doble crédito/doble matrícula en cada esquina de la ciudad. Que estos resultados hayan convertido a CPS en un líder nacional de educación urbana refleja la dedicación de nuestros educadores, el talento y competitividad de nuestros casi 400,000 estudiantes y el apoyo que ustedes – nuestras familias – les dan. Nos sentimos afortunados de comenzar este año escolar en un momento tan destacado, y no podemos esperar para ver el provecho que podrán sacar nuestros estudiantes de estos resultados impresionantes. Les agradecemos que hayan confiado la educación de sus hijos a las Escuelas Públicas de Chicago, y les deseamos a todos un exitoso y productivo año escolar. Atentamente, Forrest Claypool Dr. Janice K. Jackson Chief Executive Officer Chief Education Officer 2016 District Academic Progress Report CPS: Success Starts Here Chicago Public Schools (CPS) is the third –largest school district in the country, serving 396,000 students in 660 schools in the 2015-2016 school year. Our schools reflect our city’s diversity: our students are 46% Hispanic, 39% African-American, 10% White and 4% Asian. 81% of our students are low-income, 17% are English learners and 13% are diverse learners. We are proud of the academic gains all of our students have made, thanks to the dedication of educators, staff, families and partners from across the city of Chicago—and we look forward to building on these trends in the years to come. Student Outcomes: High School Graduation 2011 2012 2013 2014 2015 2016 56.9% 59.3% 62.5% 66.3% 69.9% 73.5% 2011 2012 2013 2014 2015 2016 District Attendance Rate (K-12) 91.7% 92.5% 92.5% 93.1% 93.2% 93.4% Freshmen On-Track to Graduate 69.0% 74.5% 79.8% 82.6% 84.1% 87.4% One-Year Dropout Rate 11.2% 10.5% 8.4% 8.0% 7.9% 6.8% 2011 2012 2013 2014 2015 2016 NAEP Scale Score Grade 4 - Reading 203 — 206 — 213 — NAEP Scale Score Grade 8 - Reading 253 — 253 — 257 — NAEP Scale Score Grade 4 - Math 224 — 231 — 232 — NAEP Scale Score Grade 8 - Math 270 — 269 — 275 — Percent of Students Graduating in 5 years Progress to Graduation Progress in the Classroom National Assessment of Educational Progress (NAEP)* Northwest Evaluation Association (NWEA) Measure of Academic Progress (MAP) % of Students At/Above National Avg. - Reading — — 45.6% 51.5% 54.0% 59.1% % of Students At/Above National Avg. on - Math — — 45.1% 48.6% 52.2% 54.6% % of Students Making National Avg. Growth - Reading — — — 62.0% 56.1% 61.8% % of Students Making National Avg. Growth - Math — — — 55.4% 54.7% 56.4% — — 196 333 377 398 Arts: Number of Schools earning Strong or Excelling Creative Schools Certification Note that this document will be updated throughout the school year as we receive additional results for the District. Key — No data available * NAEP data released every other year Definitions of Reported Data Academic Measure Definition Percent of Students Graduating in 5 years This is the 5-year cohort graduation rate. It measures the percent of students who graduate within 5 years of their freshman year. CPS, like the State of Illinois and other districts across the country, reports both a 4-year and a 5-year graduation rate. CPS uses the 5-year rate as its official graduation rate because it is the best measure of the percent of students who go onto graduate. District Attendance Rate (K-12) This is the percent of students who attend school on an average school day. Freshmen On-Track to Graduate This is the percent of students who earn five or more credits and fail no more than 0.5 core courses during their 9th grade year. Being on-track in the freshman year is highly predictive of graduation, and this metric is nationally recognized for guiding individual schools to improve their graduation rates. One-Year Dropout Rate This is the percent of students in grades 9-12 that drop out during the year. This includes “unverified transfers” which are students who may have transferred, but for whom the school cannot verify the transfer occurred. NAEP The National Assessment of Educational Progress (NAEP) is also sometimes called the “Nation’s Report Card.” It is administered by the US Department of Education every other year to a representative sample of students in grades 4 and 8 in reading and mathematics. The results for NAEP are only provided at the District, State and National levels, not at the school and student levels. NWEA MAP The Northwest Evaluation Association Measure of Academic Progress (NWEA MAP) is CPS's primary assessment measure for students in grades 2 through 8. The NWEA MAP is administered in the spring of each school year district-wide, and optionally in schools in the middle of the school year. The results are used at the classroom level to track students' progress toward learning goals and to tailor instruction to individual students. NWEA MAP results are also used in several of the indicators included in the SQRP. For more information on the NWEA MAP, visit www.nwea.org/assessments/map Arts: Number of Schools earning Strong or Excelling Creative Schools Certification The Creative Schools Certification measures the level at which individual schools meet the goals and priorities outlined in the CPS Art Education Plan. To learn more, visit www.cpsarts.org/creative-schools-certification. More data is available at www.cps.edu/schooldata. You can also visit each school’s progress report online at www.cps.edu and searching for a school. The data on these websites will be updated as more data becomes available throughout the school year. Learn more about CPS’s vision for achieving its mission of providing a high-quality public education for every child in every neighborhood, that prepares them for success in college, career, and community at www.cps.edu/vision. Reporte del Progreso Académico del Distrito en 2016 CPS: El Éxito Comienza Aquí Las Escuelas Públicas de Chicago (CPS) son el tercer distrito escolar del país en tamaño, con 396,000 estudiantes en 660 escuelas durante el año escolar 2015-2016. Nuestras escuelas reflejan la diversidad de la ciudad: nuestros estudiantes son 46% hispanos, 39% afroamericanos, 10% blancos y 4% asiáticos. 81% de nuestros estudiantes tienen bajos ingresos, 17% son aprendices de inglés y 13% son aprendices diversos. Estamos orgullosos de los logros académicos de todos nuestros estudiantes, gracias a la dedicación de los educadores, personal, familias y asociados de toda la ciudad de Chicago, y esperamos construir sobre esas tendencias en los años venideros. Logros estudiantiles: Graduación de escuela superior 2011 2012 2013 56.9% 59.3% 62.5% 66.3% 69.9% 73.5% 2011 2012 2013 Tasa de asistencia del Distrito (K-12) 91.7% 92.5% 92.5% 93.1% 93.2% 93.4% Freshmen en camino a la graduación 69.0% 74.5% 79.8% 82.6% 84.1% 87.4% Tasa de abandono en un año 11.2% 10.5% 8.4% 8.0% 7.9% 6.8% 2011 2012 2013 2014 2015 2016 Escala de notas NAEP Grado 4 - Lectura 203 — 206 — 213 — Escala de notas NAEP Grado 8 - Lectura 253 — 253 — 257 — Escala de notas NAEP Grado 4 - Matemáticas 224 — 231 — 232 — Escala de notas NAEP Grado 8 - Matemáticas 270 — 269 — 275 — Porcentaje de estudiantes que se gradúan en 5 años 2014 2015 2016 Progreso hacia la graduación 2014 2015 2016 Progreso en los salones de clase Evaluación Nacional del Progreso Educativo (NAEP)* Medida de Progreso Académico (MAP) de la Asociación de Evaluación del Noroeste (NWEA) % estud. en/o supera promedio nacional - Lectura — — 45.6% 51.5% 54.0% 59.1% % estud. en/o supera promedio nacional – Mat. — — 45.1% 48.6% 52.2% 54.6% % estud. alcanza promedio nacional de crecimiento - Lectura — — — 62.0% 56.1% 61.8% % estud. alcanza promedio nacional de crecimiento – Mat. — — — 55.4% 54.7% 56.4% Artes: Cantidad de escuelas que obtienen certificado de Sólidas o con Excelencia Creativa — — 196 Notar que este documento será actualizado durante el año escolar cuando se reciban resultados adicionales del Distrito. 333 377 398 Clave — No datos disponibles * Datos NAEP divulgados año por medio Definiciones de los datos reportados Medida académica Definición Porcentaje de estudiantes que se gradúan en cinco años Tasa de graduación de los cohortes (grupos) de 5 años. Mide el porcentaje de estudiantes que se gradúan dentro de los cinco años de su año freshman. CPS, como el estado de Illinois y otros distritos del país, reporta la tasa de graduación de cuatro y cinco años. CPS usa la de cinco años como su tasa oficial porque es la mejor medida del porcentaje de estudiantes que se gradúan. Tasa de asistencia del Distrito (K-12) Es el porcentaje de estudiantes que asisten a la escuela en un día promedio. Porcentaje de estudiantes que obtienen cinco o más créditos y no pierden más de 0.5 cursos básicos durante el año de noveno grado. Estar en camino en el año Freshmen en camino a la graduación freshman es altamente predictivo de graduación y esta métrica es reconocida nacionalmente para guiar a las escuelas en la mejora de sus tasas de graduación. Tasa de abandono de un año Porcentaje de estudiantes, de los grados 9-12, que abandonan la escuela durante el año. Esto incluye “transferencias no verificadas”, que son estudiantes que pueden haberse transferido pero la escuela no lo pudo verificar. NAEP La Evaluación Nacional del Progreso Educativo (NAEP) es también llamada “Boletín de Calificaciones de la Nación”. Es administrada en lectura y matemáticas por el Departamento de Educación de los EE.UU, año por medio, a una muestra de estudiantes de los grados 4 y 8. Los resultados son solamente provistos al Distrito, al Estado y a nivel nacional, no a las escuelas o estudiantes. NWEA MAP Arte: Cantidad de escuelas que obtienen certificados de Sólidas o con Excelencia Creativa La Medida de Progreso Académico (MAP) de la Asociación de Evaluación del Noroeste (NWEA) es una evaluación primaria de CPS para estudiantes en los grados 2 al 8. El examen es administrado en la primavera en cada año escolar de todo el distrito, y opcionalmente a mediados del año escolar. Los resultados son usados en los salones para seguir el progreso de los estudiantes hacia las metas de aprendizaje y ajustar la instrucción en casos individuales. Los resultados NWEA MAP también se usan en varios de los indicadores incluidos en los estándares de calidad escolar. Por más información sobre NWEA MAP, visite www.nwea.org/assessments/ map El Certificado de Escuelas Creativas mide el nivel de cumplimiento individual de las metas y prioridades establecidas en el Plan de Enseñanza de Arte de CPS. Para saber más, visite www.cpsarts.org/creative-schools-certification. Más información disponible en www.cps.edu/schooldata. También puede visitar el informe de progreso escolar de cada escuela que se encuentra en línea en www.cps.edu y buscar la escuela. La información en estos portales será actualizada a medida que esté disponible durante el año escolar. Infórmese más sobre la visión de CPS para lograr su misión de proveer a cada niño, en cada vecindario, una educación pública de calidad que los prepare para el éxito en la universidad, carreras y la comunidad, en www.cps.edu/vision.
