Salidas del R para los laboratorios (clase prctica del 13/11/2012)
Anuncio

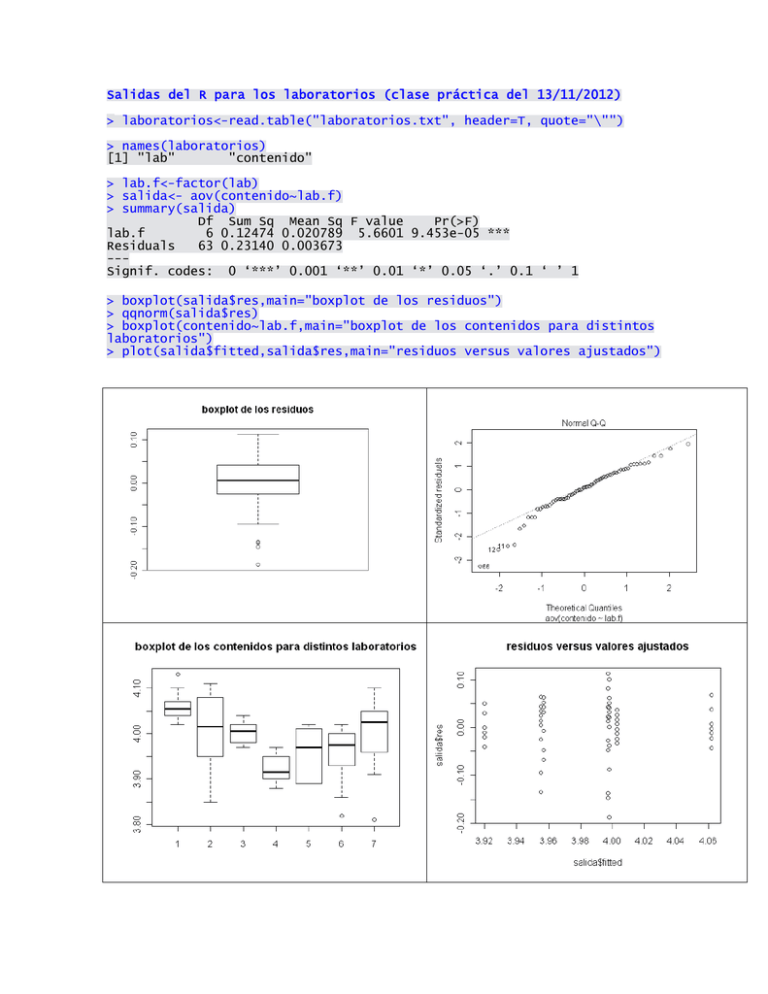
Salidas del R para los laboratorios (clase práctica del 13/11/2012) > laboratorios<-read.table("laboratorios.txt", header=T, quote="\"") > names(laboratorios) [1] "lab" "contenido" > lab.f<-factor(lab) > salida<- aov(contenido~lab.f) > summary(salida) Df Sum Sq Mean Sq F value Pr(>F) lab.f 6 0.12474 0.020789 5.6601 9.453e-05 *** Residuals 63 0.23140 0.003673 --Signif. codes: 0 ‘***’ 0.001 ‘**’ 0.01 ‘*’ 0.05 ‘.’ 0.1 ‘ ’ 1 > boxplot(salida$res,main="boxplot de los residuos") > qqnorm(salida$res) > boxplot(contenido~lab.f,main="boxplot de los contenidos para distintos laboratorios") > plot(salida$fitted,salida$res,main="residuos versus valores ajustados") > shapiro.test(salida$res) Shapiro-Wilk normality test data: salida$res W = 0.9525, p-value = 0.009873 > bartlett.test(contenido,lab.f) Bartlett test of homogeneity of variances data: contenido and lab.f Bartlett's K-squared = 24.3697, df = 6, p-value = 0.0004465 > install.packages("lawstat") > library("lawstat") > levene.test(contenido,lab.f) modified robust Brown-Forsythe Levene-type test based on the absolute deviations from the median data: contenido Test Statistic = 2.2445, p-value = 0.05018 > kruskal.test(contenido,lab.f) Kruskal-Wallis rank sum test data: contenido and lab.f Kruskal-Wallis chi-squared = 29.606, df = 6, p-value = 4.67e-05 > library(pgirmess) > install.packages("pgirmess") > kruskalmc(contenido,lab.f,probs=0.05) Multiple comparison test after Kruskal-Wallis p.value: 0.05 Comparisons obs.dif critical.dif difference 1-2 20.25 27.65037 FALSE 1-3 20.85 27.65037 FALSE 1-4 44.35 27.65037 TRUE 1-5 33.45 27.65037 TRUE 1-6 33.30 27.65037 TRUE 1-7 18.25 27.65037 FALSE 2-3 0.60 27.65037 FALSE 2-4 24.10 27.65037 FALSE 2-5 13.20 27.65037 FALSE 2-6 13.05 27.65037 FALSE 2-7 2.00 27.65037 FALSE 3-4 23.50 27.65037 FALSE 3-5 12.60 27.65037 FALSE 3-6 12.45 27.65037 FALSE 3-7 2.60 27.65037 FALSE 4-5 10.90 27.65037 FALSE 4-6 11.05 27.65037 FALSE 4-7 26.10 27.65037 FALSE 5-6 0.15 27.65037 FALSE 5-7 15.20 27.65037 FALSE 6-7 15.05 27.65037 FALSE

