Quantitative comparison of sensitivity and saturation for
Anuncio
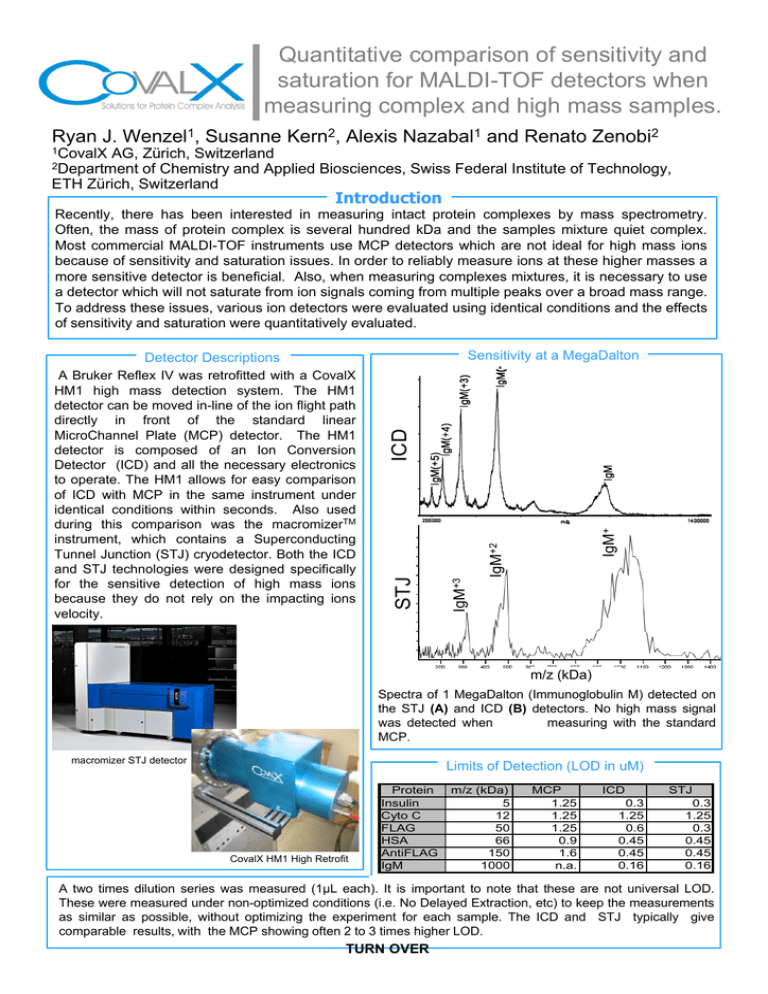
Quantitative comparison of sensitivity and saturation for MALDI-TOF detectors when measuring complex and high mass samples. Ryan J. Wenzel1, Susanne Kern2, Alexis Nazabal1 and Renato Zenobi2 1CovalX AG Zürich, AG, Zürich Switzerland of Chemistry and Applied Biosciences, Swiss Federal Institute of Technology, ETH Zürich, Switzerland 2Department Introduction Recently, there has been interested in measuring intact protein complexes by mass spectrometry. Often, the mass of protein complex is several hundred kDa and the samples mixture quiet complex. Most commercial MALDI-TOF instruments use MCP detectors which are not ideal for high mass ions g masses a because of sensitivityy and saturation issues. In order to reliablyy measure ions at these higher more sensitive detector is beneficial. Also, when measuring complexes mixtures, it is necessary to use a detector which will not saturate from ion signals coming from multiple peaks over a broad mass range. To address these issues, various ion detectors were evaluated using identical conditions and the effects of sensitivity and saturation were quantitatively evaluated. IgM+3 IgM+2 IgM+ ICD Sensitivity at a MegaDalton STJ Detector Descriptions A Bruker Reflex IV was retrofitted with a CovalX HM1 high mass detection system. The HM1 detector can be moved in-line of the ion flight path directly in front of the standard linear MicroChannel Plate (MCP) detector. The HM1 detector is composed of an Ion Conversion Detector (ICD) and all the necessary electronics to operate. The HM1 allows for easy comparison of ICD with MCP in the same instrument under identical conditions within seconds. Also used during this comparison was the macromizerTM instrument, which contains a Superconducting Tunnel Junction (STJ) cryodetector. Both the ICD and STJ technologies were designed specifically for the sensitive detection of high mass ions because they do not rely on the impacting ions velocity. velocity m/z (kDa) Spectra of 1 MegaDalton (Immunoglobulin M) detected on the STJ (A) and ICD (B) detectors. No high mass signal was detected when measuring with the standard MCP. macromizer STJ detector Limits of Detection (LOD in uM) CovalX HM1 High Retrofit Protein Insulin Cyto C FLAG HSA AntiFLAG IgM m/z (kDa) 5 12 50 66 150 1000 MCP 1.25 1.25 1.25 09 0.9 1.6 n.a. ICD 0.3 1.25 0.6 0 45 0.45 0.45 0.16 STJ 0.3 1.25 0.3 0 45 0.45 0.45 0.16 A two times dilution series was measured (1µL each). It is important to note that these are not universal LOD. These were measured under non-optimized conditions (i.e. No Delayed Extraction, etc) to keep the measurements as similar as possible, without optimizing the experiment for each sample. The ICD and STJ typically give comparable results, with the MCP showing often 2 to 3 times higher LOD. TURN OVER Insulin / BSA Saturation Test Insulin and Bovine Serum Albumin (BSA) were mixed at high concentrations (19µM BSA and 18 or 9µM Insulin) and the relative intensity of BSA was monitored as the laser power was changed (Figure below). At higher laser powers relatively more BSA ions are created, as detected by the ICD. The MCP shows virtually no BSA signal at any laser power because the MCP is saturated from the earlier arriving Insulin ions; with no Insulin the MCP easily detects the BSA. Spectra (shown on right) demonstrating this saturation can be seen in to the right where the MCP shows no peaks above the insulin signals because of detector saturation. 100 BSA?? Measurements taken on same spot in same instrument with exact same instrumental values within seconds of each other. 90 BSA Relative Intensity (%) MCP Insulin 80 HM1 Insulin 70 60 50 Insulin Adducts BSA+1 40 BSA+2 30 2BSA+ 20 10 3BSA+ 0 60 65 Blue = BSA measured using HM1 Red = BSA measured using MCP 70 75 80 85 90 Laser Power (%) Spectra from Multicomponent Mixture STJ AntiFLAG(+2) AntiFLAG ICD FLAG HSA A MCP Insulin Lysozyme Both the ICD and STJ show easily identifiable signals corresponding to each of the five proteins in the mixture. The MCP is only able to detect the two lower mass proteins. Many mixtures of different relative concentrations were measured, always with the same results. It is believed the large difference in detection is because of t ti off th h l as th bl tto d t t each h off th di id l proteins t i att th l saturation the MCP channels the MCP was able detect these iindividual these llevels when measured separately. It is important to note that all these samples were measured from the exact same solutions within minutes of one another, and the MCP and ICD were taken on the exact same instrument with absolutely no changes to operating conditions. Conclusions DYNAMIC RANGE: Samples extending over nearly three orders of magnitude in mass range (5kDa to 1MDa) were easily detected. SENSITIVITY: Both the ICD and STJ detectors show similar LOD with detection up to 1MDa. The MCP is usually 2 to 3 times less sensitive for pure samples under identical conditions. p component p mixtures are measured a strong g sensitivityy SATURATION: When multiple decrease is seen for the MCP. It is believed this is due to substantial detector saturation. PRACTICAL ASPECTS: The STJ and ICD provide comparable data. The STJ was an expensive instrument which is no longer being produced. The ICD is an affordable alternative which can easily be retrofit to most major MALDI TOF instruments. MCP is good for simple low mass analysis, but not sensitive for high mass and saturates highly with complex mixtures.
