Crosstabs
Anuncio

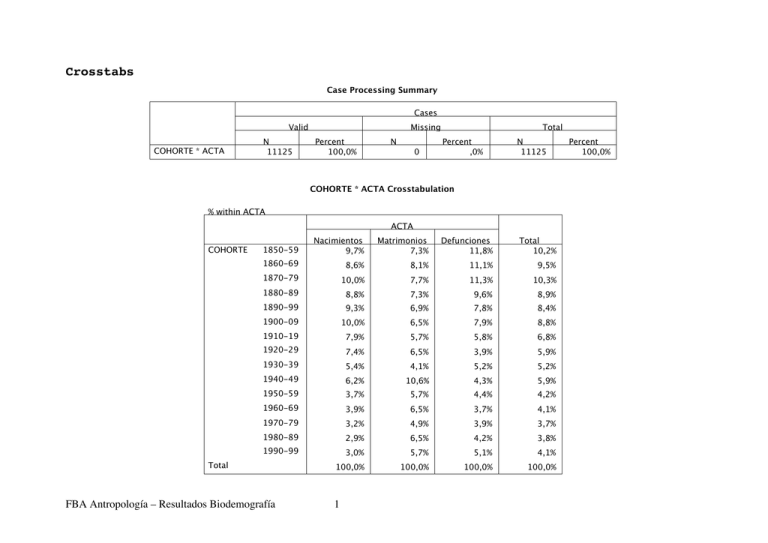
Crosstabs Case Processing Summary Cases Valid COHORTE * ACTA N 11125 Missing Percent 100,0% N 0 Total Percent ,0% N 11125 COHORTE * ACTA Crosstabulation % within ACTA ACTA COHORTE 1850-59 Nacimientos 9,7% Matrimonios 7,3% Defunciones 11,8% Total 10,2% 1860-69 8,6% 8,1% 11,1% 9,5% 1870-79 10,0% 7,7% 11,3% 10,3% 1880-89 8,8% 7,3% 9,6% 8,9% 1890-99 9,3% 6,9% 7,8% 8,4% 1900-09 10,0% 6,5% 7,9% 8,8% 1910-19 7,9% 5,7% 5,8% 6,8% 1920-29 7,4% 6,5% 3,9% 5,9% 1930-39 5,4% 4,1% 5,2% 5,2% 1940-49 6,2% 10,6% 4,3% 5,9% 1950-59 3,7% 5,7% 4,4% 4,2% 1960-69 3,9% 6,5% 3,7% 4,1% 1970-79 3,2% 4,9% 3,9% 3,7% 1980-89 2,9% 6,5% 4,2% 3,8% 1990-99 3,0% 5,7% 5,1% 4,1% 100,0% 100,0% 100,0% 100,0% Total FBA Antropología – Resultados Biodemografía 1 Percent 100,0% 14 Percent Graph 12 10 8 6 ACTA 4 Naci mientos Defunci on es 2 9 -9 90 9 1 9 0 -8 8 9 1 9 -7 70 9 1 9 -6 60 9 1 9 0 -5 5 9 1 9 -4 40 9 1 9 0 -3 3 9 1 9 0 -2 2 9 1 9 -1 10 9 1 9 0 -0 0 9 1 9 0 -9 9 9 1 8 -8 80 9 1 8 -7 70 9 1 8 0 -6 6 9 1 8 -5 50 18 C OHORTE 2 FBA Antropología – Resultados Biodemografía Crosstabs Case Processing Summary Cases Valid COHORTE * CAUSADEF N 4320 Missing Percent 38,8% N 6805 Total Percent 61,2% N 11125 Percent 100,0% COHORTE * CAUSADEF Crosstabulation % within COHORTE CAUSADEF COHORTE Total 1850-59 Infecciosas 52,9% Tumores 1,0% Circulatorio 6,9% Respiratorio 9,8% Cong y Perinat 4,9% Accidentes 2,9% Otras 21,6% Total 100,0% 1860-69 49,0% 1,0% 6,3% 12,5% 4,2% 2,1% 25,0% 100,0% 1870-79 38,8% 1,0% 8,2% 11,2% 5,1% 3,1% 32,7% 100,0% 1880-89 34,9% 2,4% 7,2% 13,3% 4,8% 2,4% 34,9% 100,0% 1890-99 37,3% 1,5% 10,4% 17,9% 4,5% 3,0% 25,4% 100,0% 1900-09 33,8% 1,5% 8,8% 19,1% 2,9% 1,5% 32,4% 100,0% 1910-19 30,0% 4,0% 12,0% 20,0% 4,0% 4,0% 26,0% 100,0% 1920-29 26,5% 2,9% 14,7% 26,5% 2,9% 2,9% 23,5% 100,0% 1930-39 22,2% 4,4% 15,6% 15,6% 4,4% 26,7% 11,1% 100,0% 1940-49 24,3% 5,4% 24,3% 18,9% 2,7% 5,4% 18,9% 100,0% 1950-59 15,8% 5,3% 31,6% 15,8% 5,3% 2,6% 23,7% 100,0% 1960-69 12,5% 6,3% 40,6% 15,6% 3,1% 6,3% 15,6% 100,0% 1970-79 5,9% 5,9% 47,1% 20,6% 5,9% 2,9% 11,8% 100,0% 1980-89 8,3% 8,3% 50,0% 11,1% 5,6% 2,8% 13,9% 100,0% 1990-99 2,3% 6,8% 47,7% 6,8% 2,3% 2,3% 31,8% 100,0% 31,8% 3,0% 17,0% 14,7% 4,3% 4,2% 25,0% 100,0% FBA Antropología – Resultados Biodemografía 3 Count Graph 300 CAUSADEF 200 Infecciosas Tumores Circulatorio 100 Respiratorio Cong y Perinat Accidentes 0 Otras 9 -9 90 9 19 -8 80 9 19 0-7 7 9 19 -6 60 9 19 -5 50 9 19 -4 40 9 19 -3 30 9 19 -2 20 9 19 -1 10 9 19 -0 00 9 19 -9 90 9 18 -8 80 9 18 -7 70 9 18 -6 60 9 18 -5 50 18 COHORTE FBA Antropología – Resultados Biodemografía 4 Crosstabs Case Processing Summary Cases Valid N COHORTE * PARENT 1230 Missing Percent 11,1% N Total Percent 88,9% 9895 N 11125 Percent 100,0% COHORTE * PARENT Crosstabulation % within PARENT PARENT COHORTE 1850-59 SIN CONS 7,5% 1860-69 8,2% 1870-79 7,7% 1880-89 7,3% 1890-99 M33 6,3% Total 7,3% 6,3% 8,1% 12,5% 9,4% 7,7% 8,3% 12,5% 6,3% 7,3% 6,7% 8,3% 12,5% 12,5% 6,9% 1900-09 6,2% 8,3% 25,0% 12,5% 6,5% 1910-19 5,3% 16,7% 12,5% 15,6% 5,7% 1920-29 6,3% 25,0% 12,5% 6,3% 6,5% 1930-39 4,0% 16,7% 3,1% 4,1% 1940-49 10,6% 8,3% 9,4% 10,6% 1950-59 5,8% 6,3% 5,7% 1960-69 6,7% 3,1% 6,5% 1970-79 5,1% 1980-89 6,7% 1990-99 5,9% Total FBA Antropología – Resultados Biodemografía M22 M23 8,3% 12,5% 4,9% 3,1% 6,5% 5,7% 100,0% 100,0% 5 100,0% 100,0% 100,0% Means Case Processing Summary Cases Included ALFAX100 * COHORTE N 1230 Excluded Percent 11,1% N 9895 Total Percent 88,9% Report ALFAX100 90 Std. Deviation ,23161149 ,0937500 100 ,65955607 1870-79 ,0822368 95 ,41829655 1880-89 ,1388889 90 ,76419030 1890-99 ,1838235 85 ,81446380 1900-09 ,2343750 80 ,89982308 1910-19 ,3348214 70 1,15627011 1920-29 ,3125000 80 1,25296326 1930-39 ,2812500 50 1,25039853 1940-49 ,1081731 130 ,65076675 1950-59 ,0446429 70 ,26218987 1960-69 ,0195312 80 ,17469281 1970-79 ,0000000 60 ,00000000 1980-89 ,0195312 80 ,17469281 1990-99 ,0000000 70 ,00000000 Total ,1219512 1230 ,70260895 COHORTE 1850-59 Mean ,0347222 1860-69 FBA Antropología – Resultados Biodemografía 6 N N 11125 Percent 100,0% ,4 ,3 Mean ALFAX100 Graph ,2 ,1 0,0 9 -9 90 19 - 89 80 19 - 79 70 19 - 69 60 19 - 59 50 19 - 49 40 19 - 39 30 19 - 29 20 19 - 19 10 19 - 09 00 19 - 99 90 18 - 89 80 18 - 79 70 18 - 69 60 18 - 59 50 18 COHOR TE 7 FBA Antropología – Resultados Biodemografía Factor Analysis Communalities Nacimientos Initial 1,000 Extraction ,977 Defunciones 1,000 ,931 CRECVEG 1,000 ,874 M22 1,000 ,841 M33 1,000 ,752 ALFA 1,000 ,925 Extraction Method: Principal Component Analysis. Total Variance Explained Initial Eigenvalues Extraction Sums of Squared Loadings Rotation Sums of Squared Loadings Total 3,579 % of Variance 59,647 Cumulative % 59,647 Total 3,579 % of Variance 59,647 Cumulative % 59,647 Total 3,173 % of Variance 52,878 Cumulative % 52,878 2 1,722 28,702 88,349 1,722 28,702 88,349 2,128 35,471 88,349 3 ,507 8,443 96,792 4 ,155 2,581 99,372 5 3,766E-02 ,628 100,000 6 8,327E-17 1,388E-15 100,000 Component 1 Extraction Method: Principal Component Analysis. FBA Antropología – Resultados Biodemografía 8 Component Matrix a Rotated Component Matrix a Component Nacimientos 1 Component 2 ,765 ,626 Nacimientos Defunciones ,267 ,927 Defunciones CRECVEG ,901 -,251 M22 ,779 M33 ALFA ,911 -,197 ,945 CRECVEG ,914 ,200 -,484 M22 ,915 -6,371E-02 ,838 ,226 M33 ,635 ,591 ,896 -,349 ALFA ,955 ,111 Extraction Method: Principal Component Analysis. Rotation Method: Varimax with Kaiser Normalization. a. Rotation converged in 3 iterations. Component Transformation Matrix 2 2 ,383 Extraction Method: Principal Component Analysis. a. 2 components extracted. Component 1 1 1 2 ,884 ,468 -,468 ,884 Extraction Method: Principal Component Analysis. Rotation Method: Varimax with Kaiser Normalization. FBA Antropología – Resultados Biodemografía 9 Component Plot in Rotated Space 1,0 nacimientos defunciones m33 ,5 crecveg alfa 0,0 m22 -,5 -1,0 -1,0 -,5 0,0 ,5 1,0 Component 1 FBA Antropología – Resultados Biodemografía 10

