Contrastes 1 F. de Mendiburu
Anuncio

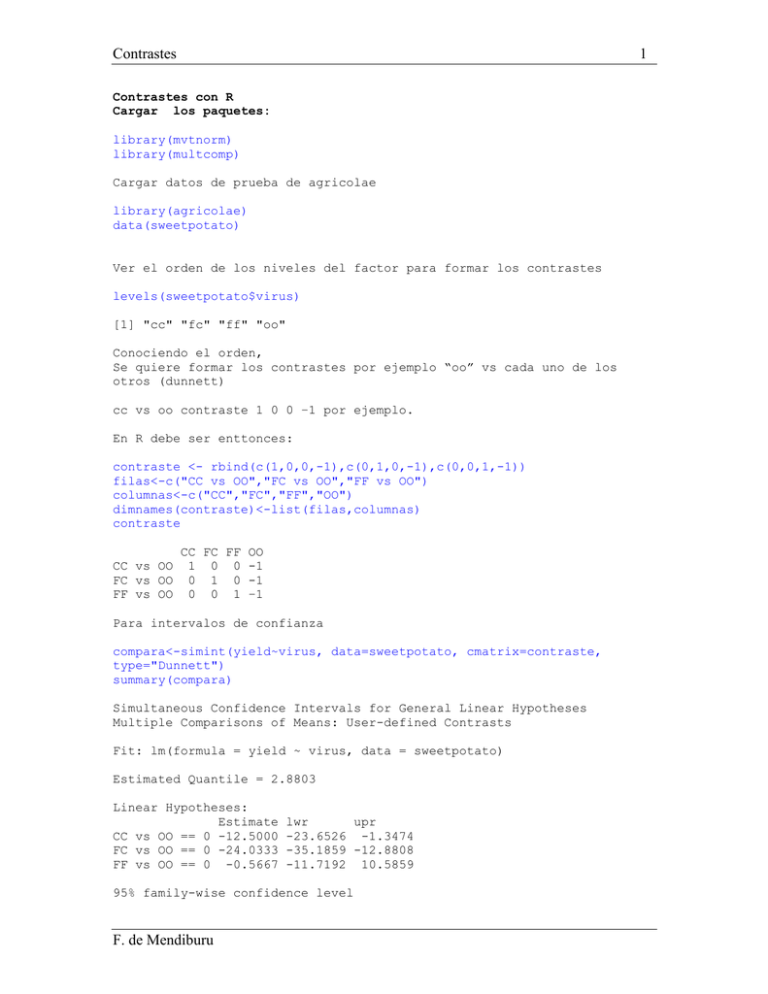
Contrastes 1 Contrastes con R Cargar los paquetes: library(mvtnorm) library(multcomp) Cargar datos de prueba de agricolae library(agricolae) data(sweetpotato) Ver el orden de los niveles del factor para formar los contrastes levels(sweetpotato$virus) [1] "cc" "fc" "ff" "oo" Conociendo el orden, Se quiere formar los contrastes por ejemplo “oo” vs cada uno de los otros (dunnett) cc vs oo contraste 1 0 0 –1 por ejemplo. En R debe ser enttonces: contraste <- rbind(c(1,0,0,-1),c(0,1,0,-1),c(0,0,1,-1)) filas<-c("CC vs OO","FC vs OO","FF vs OO") columnas<-c("CC","FC","FF","OO") dimnames(contraste)<-list(filas,columnas) contraste CC vs OO FC vs OO FF vs OO CC FC FF OO 1 0 0 -1 0 1 0 -1 0 0 1 –1 Para intervalos de confianza compara<-simint(yield~virus, data=sweetpotato, cmatrix=contraste, type="Dunnett") summary(compara) Simultaneous Confidence Intervals for General Linear Hypotheses Multiple Comparisons of Means: User-defined Contrasts Fit: lm(formula = yield ~ virus, data = sweetpotato) Estimated Quantile = 2.8803 Linear Hypotheses: Estimate CC vs OO == 0 -12.5000 FC vs OO == 0 -24.0333 FF vs OO == 0 -0.5667 lwr upr -23.6526 -1.3474 -35.1859 -12.8808 -11.7192 10.5859 95% family-wise confidence level F. de Mendiburu Contrastes Prueba de hipotesis compara<-simtest(yield~virus, data=sweetpotato, cmatrix=contraste, type="Dunnett") summary(compara) Simultaneous Tests for General Linear Hypotheses Multiple Comparisons of Means: User-defined Contrasts Fit: lm(formula = yield ~ virus, data = sweetpotato) Linear Hypotheses: Estimate Std. Error t value p value CC vs OO == 0 -12.5000 3.8721 -3.228 0.0298 * FC vs OO == 0 -24.0333 3.8721 -6.207 <0.001 *** FF vs OO == 0 -0.5667 3.8721 -0.146 0.9976 --Signif. codes: 0 '***' 0.001 '**' 0.01 '*' 0.05 '.' 0.1 ' ' 1 (Adjusted p values reported) Otra forma que sugiere R. model<- aov(yield~virus, data=sweetpotato) compara<-glht(model, linfct = mcp(virus = contraste)) summary(compara) Simultaneous Tests for General Linear Hypotheses Multiple Comparisons of Means: User-defined Contrasts Fit: aov(formula = yield ~ virus, data = sweetpotato) Linear Hypotheses: Estimate Std. Error t value p value CC vs OO == 0 -12.5000 3.8721 -3.228 0.0298 * FC vs OO == 0 -24.0333 3.8721 -6.207 <0.001 *** FF vs OO == 0 -0.5667 3.8721 -0.146 0.9976 --Signif. codes: 0 '***' 0.001 '**' 0.01 '*' 0.05 '.' 0.1 ' ' 1 (Adjusted p values reported) F. de Mendiburu 2
