Bloque2 no AR
Anuncio

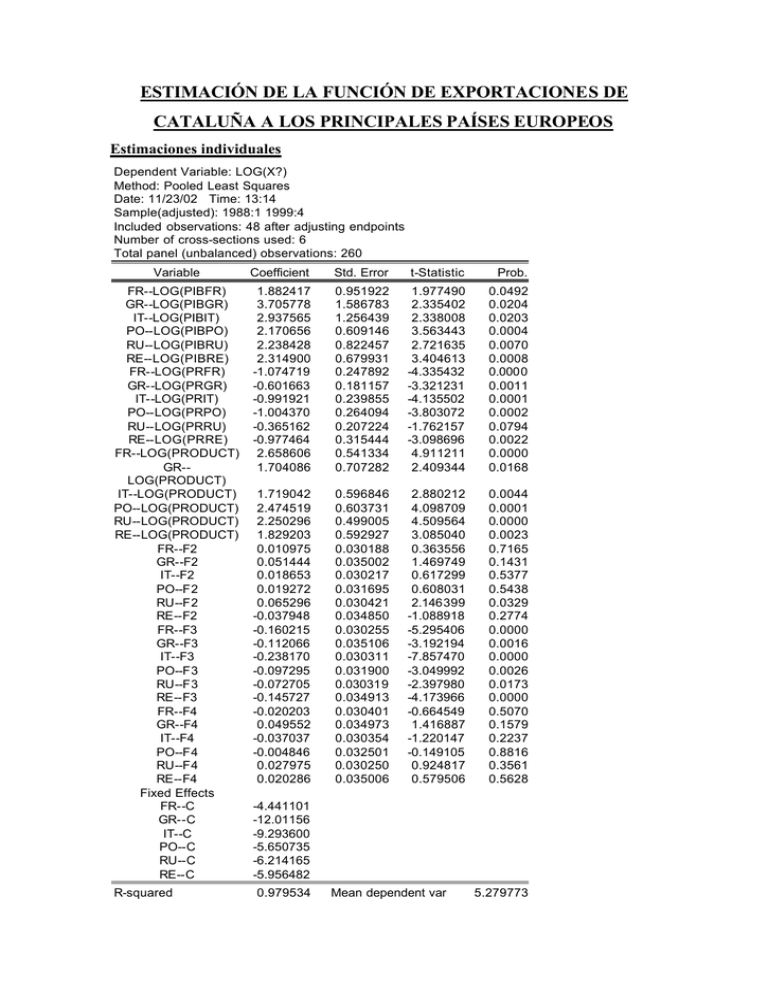
ESTIMACIÓN DE LA FUNCIÓN DE EXPORTACIONES DE CATALUÑA A LOS PRINCIPALES PAÍSES EUROPEOS Estimaciones individuales Dependent Variable: LOG(X?) Method: Pooled Least Squares Date: 11/23/02 Time: 13:14 Sample(adjusted): 1988:1 1999:4 Included observations: 48 after adjusting endpoints Number of cross-sections used: 6 Total panel (unbalanced) observations: 260 Variable Coefficient Std. Error t-Statistic Prob. FR--LOG(PIBFR) GR--LOG(PIBGR) IT--LOG(PIBIT) PO--LOG(PIBPO) RU--LOG(PIBRU) RE--LOG(PIBRE) FR--LOG(PRFR) GR--LOG(PRGR) IT--LOG(PRIT) PO--LOG(PRPO) RU--LOG(PRRU) RE--LOG(PRRE) FR--LOG(PRODUCT) GR-LOG(PRODUCT) IT--LOG(PRODUCT) PO--LOG(PRODUCT) RU--LOG(PRODUCT) RE--LOG(PRODUCT) FR--F2 GR--F2 IT--F2 PO--F2 RU--F2 RE--F2 FR--F3 GR--F3 IT--F3 PO--F3 RU--F3 RE--F3 FR--F4 GR--F4 IT--F4 PO--F4 RU--F4 RE--F4 Fixed Effects FR--C GR--C IT--C PO--C RU--C RE--C 1.882417 3.705778 2.937565 2.170656 2.238428 2.314900 -1.074719 -0.601663 -0.991921 -1.004370 -0.365162 -0.977464 2.658606 1.704086 0.951922 1.586783 1.256439 0.609146 0.822457 0.679931 0.247892 0.181157 0.239855 0.264094 0.207224 0.315444 0.541334 0.707282 1.977490 2.335402 2.338008 3.563443 2.721635 3.404613 -4.335432 -3.321231 -4.135502 -3.803072 -1.762157 -3.098696 4.911211 2.409344 0.0492 0.0204 0.0203 0.0004 0.0070 0.0008 0.0000 0.0011 0.0001 0.0002 0.0794 0.0022 0.0000 0.0168 1.719042 2.474519 2.250296 1.829203 0.010975 0.051444 0.018653 0.019272 0.065296 -0.037948 -0.160215 -0.112066 -0.238170 -0.097295 -0.072705 -0.145727 -0.020203 0.049552 -0.037037 -0.004846 0.027975 0.020286 0.596846 0.603731 0.499005 0.592927 0.030188 0.035002 0.030217 0.031695 0.030421 0.034850 0.030255 0.035106 0.030311 0.031900 0.030319 0.034913 0.030401 0.034973 0.030354 0.032501 0.030250 0.035006 2.880212 4.098709 4.509564 3.085040 0.363556 1.469749 0.617299 0.608031 2.146399 -1.088918 -5.295406 -3.192194 -7.857470 -3.049992 -2.397980 -4.173966 -0.664549 1.416887 -1.220147 -0.149105 0.924817 0.579506 0.0044 0.0001 0.0000 0.0023 0.7165 0.1431 0.5377 0.5438 0.0329 0.2774 0.0000 0.0016 0.0000 0.0026 0.0173 0.0000 0.5070 0.1579 0.2237 0.8816 0.3561 0.5628 R-squared -4.441101 -12.01156 -9.293600 -5.650735 -6.214165 -5.956482 0.979534 Mean dependent var 5.279773 Adjusted R-squared S.E. of regression Log likelihood Durbin-Watson stat 0.975685 0.073868 331.4048 1.593010 S.D. dependent var Sum squared resid F-statistic Prob(F-statistic) 0.473719 1.189505 254.4880 0.000000 Estimación modelo de efectos fijos Dependent Variable: LOG(X?) Method: Pooled Least Squares Date: 11/23/02 Time: 13:15 Sample(adjusted): 1988:1 1999:4 Included observations: 48 after adjusting endpoints Number of cross-sections used: 6 Total panel (unbalanced) observations: 260 Variable Coefficient Std. Error t-Statistic Prob. LOG(PIB?) LOG(PR?) LOG(PRODUCT) F2 F3 F4 Fixed Effects FR--C GR--C IT--C PO--C RU--C RE--C 1.980629 -0.836394 2.384713 0.021157 -0.141288 0.003113 0.246744 0.074905 0.149943 0.014209 0.014221 0.014267 8.027043 -11.16602 15.90418 1.489009 -9.935353 0.218218 0.0000 0.0000 0.0000 0.1378 0.0000 0.8274 R-squared Adjusted R-squared S.E. of regression Log likelihood Durbin-Watson stat 0.972045 0.970805 0.080942 290.8658 1.397077 -4.863775 -4.171899 -4.990902 -4.694532 -4.971188 -4.583994 Mean dependent var S.D. dependent var Sum squared resid F-statistic Prob(F-statistic) 5.279773 0.473719 1.624784 783.9548 0.000000 Test paso de ecuaciones individuales a efectos fijos S1 =1.189505 S0 =1.624784 Número de restricciones =35 Test F= (1.624784 − 1.189505) / 30 = 2.63 ≈ F35, 216 = 1.6 al nivel del 1%, lo que permite 1.189505 /( 260 − 44) rechazar la hipótesis nula. Ecuaciones individuales estimadas por SURE Dependent Variable: LOG(X?) Method: Seemingly Unrelated Regression Date: 11/23/02 Time: 13:15 Sample: 1988:1 1999:4 Included observations: 48 Number of cross-sections used: 6 Total panel (unbalanced) observations: 260 Convergence achieved after 9 iterations Variable Coefficient Std. Error t-Statistic Prob. FR--LOG(PIBFR) GR--LOG(PIBGR) IT--LOG(PIBIT) PO--LOG(PIBPO) RU--LOG(PIBRU) RE--LOG(PIBRE) FR--LOG(PRFR) GR--LOG(PRGR) IT--LOG(PRIT) PO--LOG(PRPO) RU--LOG(PRRU) RE--LOG(PRRE) FR--LOG(PRODUCT) GR-LOG(PRODUCT) IT--LOG(PRODUCT) PO--LOG(PRODUCT) RU--LOG(PRODUCT) RE--LOG(PRODUCT) FR--F2 GR--F2 IT--F2 PO--F2 RU--F2 RE--F2 FR--F3 GR--F3 IT--F3 PO--F3 RU--F3 RE--F3 FR--F4 GR--F4 IT--F4 PO--F4 RU--F4 RE--F4 Fixed Effects FR--C GR--C IT--C PO--C RU--C RE--C 1.167642 1.929829 2.658298 1.817725 1.940344 2.235873 -0.752582 -0.353883 -0.945127 -0.720418 -0.467143 -0.488137 3.084926 2.594159 0.586848 1.232500 0.758756 0.464508 0.658669 0.717407 0.156075 0.146365 0.137816 0.196012 0.162555 0.335446 0.339807 0.554226 1.989682 1.565784 3.503498 3.913224 2.945856 3.116604 -4.821939 -2.417809 -6.857884 -3.675385 -2.873754 -1.455187 9.078464 4.680685 0.0479 0.1188 0.0006 0.0001 0.0036 0.0021 0.0000 0.0164 0.0000 0.0003 0.0045 0.1471 0.0000 0.0000 1.808447 2.914045 2.393136 2.240104 0.013116 0.041346 0.022676 0.029980 0.063013 -0.051607 -0.155076 -0.121737 -0.230899 -0.084485 -0.070859 -0.151520 -0.015226 0.038822 -0.030130 0.012979 0.028520 0.006449 0.362200 0.457589 0.401638 0.621911 0.024002 0.030554 0.020209 0.028436 0.029633 0.039703 0.024048 0.030605 0.020266 0.028576 0.029583 0.039769 0.024134 0.030523 0.020304 0.029078 0.029549 0.039867 4.992951 6.368251 5.958441 3.601968 0.546433 1.353205 1.122093 1.054288 2.126404 -1.299827 -6.448602 -3.977647 -11.39319 -2.956467 -2.395275 -3.810033 -0.630868 1.271897 -1.483934 0.446344 0.965181 0.161757 0.0000 0.0000 0.0000 0.0004 0.5853 0.1774 0.2631 0.2929 0.0346 0.1950 0.0000 0.0001 0.0000 0.0035 0.0175 0.0002 0.5288 0.2048 0.1393 0.6558 0.3355 0.8716 -1.180585 -4.037323 -8.003288 -4.064179 -4.821155 -5.721833 Weighted Statistics Unweighted Statistics R-squared Adjusted R-squared 0.978614 0.974592 Mean dependent var S.D. dependent var 5.279773 0.473719 S.E. of regression Durbin-Watson stat 0.075511 1.560778 Sum squared resid 1.243015 Modelo de efectos fijos estimado por SURE Dependent Variable: LOG(X?) Method: Seemingly Unrelated Regression Date: 11/23/02 Time: 13:17 Sample: 1988:1 1999:4 Included observations: 48 Number of cross-sections used: 6 Total panel (unbalanced) observations: 260 Convergence achieved after 13 iterations Variable Coefficient Std. Error t-Statistic Prob. LOG(PIB?) LOG(PR?) LOG(PRODUCT) F2 F3 F4 Fixed Effects FR--C GR--C IT--C PO--C RU--C RE--C 1.722563 -0.779774 2.461583 0.023580 -0.182183 -0.013648 0.198322 0.066306 0.117279 0.017676 0.017691 0.017720 8.685685 -11.76016 20.98910 1.333993 -10.29807 -0.770225 0.0000 0.0000 0.0000 0.1834 0.0000 0.4419 -3.645788 -2.984256 -3.780512 -3.465484 -3.740933 -3.387267 Weighted Statistics Unweighted Statistics R-squared Adjusted R-squared S.E. of regression Durbin-Watson stat 0.969970 0.968638 0.083892 1.399660 Mean dependent var S.D. dependent var Sum squared resid 5.279773 0.473719 1.745402 Test paso de las ecuaciones individuales estimadas por SURE a Efectos Fijos estimados por SURE A través de las siguientes instrucciones: Pr ocs → MakeSystem → Estimate se obtiene: ∑1 = 1.39·10−15 ∑0 = 1.63·10 −14 LR=2·(L* 1 – L* 0 ) = T·ln rechazar la hipótesis nula. ∑0 ∑1 = 118.16 ≈ χ 30 = 51 al nivel del 1%, lo que permite AHORRO Y CRECIMIENTO SEGÚN EL MODELO DE CICLO VITAL Economía sin crecimiento Economía con crecimiento Por tanto, a pesar de que cada generación consuma su ahorro y legue herencias nulas, si la economía crece el ahorro agregado es positivo porque lo que las generaciones jóvenes ahorran sistemáticamente excede a lo que las generaciones de retirados desahorran. ESTIMACIÓN DE LOS EFECTOS DEL CRECIMIENTO SOBRE LA TASA DE AHORRO EN LOS PAÍSES DE LA UNIÓN EUROPEA Los datos empleados están formados por medias de diez años de las tasa de ahorro nacional bruto con relación al PIB y por medias de crecimiento referido al PIB para estos mismos periodos. Las medias contempladas hacen referencia a las décadas de los sesenta (1961-1970), de los setenta (1971-1980) y de los ochenta (1981-1990). Estimación modelo de efectos fijos por MCO Dependent Variable: S? Method: Pooled Least Squares Date: 05/20/02 Time: 17:19 Sample: 1 3 Included observations: 3 Number of cross-sections used: 14 Total panel (balanced) observations: 42 Variable G? Fixed Effects AT--C BE--C DK--C ES--C FI--C FR--C GR--C IR--C IT--C NL--C PO--C SE--C UK--C WD--C R-squared Adjusted R-squared S.E. of regression F-statistic Prob(F-statistic) Coefficient 1.239689 22.16908 16.76770 15.80490 17.89743 20.26384 19.39717 20.69743 12.71865 20.16521 21.03437 19.90680 17.64623 14.90078 20.72363 0.770909 0.652121 2.269542 6.489782 0.000018 Std. Error 0.264353 t-Statistic 4.689514 Mean dependent var S.D. dependent var Sum squared resid Durbin-Watson stat Prob. 0.0001 23.10000 3.847901 139.0722 3.327183 Estimación modelo de efectos estocásticos Dependent Variable: S? Method: GLS (Variance Components) Date: 05/20/02 Time: 17:20 Sample: 1 3 Included observations: 3 Number of cross-sections used: 14 Total panel (balanced) observations: 42 Variable C G? Random Effects AT--C BE--C DK--C ES--C FI--C FR--C GR--C IR--C IT--C NL--C PO--C SE--C UK--C WD--C GLS Transformed Regression R-squared Adjusted R-squared S.E. of regression Durbin-Watson stat Unweighted Statistics including Random Effects R-squared Adjusted R-squared S.E. of regression Durbin-Watson stat Coefficient 18.42008 1.283006 Std. Error 1.186678 0.255349 t-Statistic 15.52239 5.024526 Prob. 0.0000 0.0000 2.792944 -1.394419 -2.127053 -0.560253 1.304259 0.631665 1.612743 -4.567024 1.223237 1.916813 0.995792 -0.696937 -2.815270 1.683502 0.664940 0.656564 2.255003 2.286839 Mean dependent var S.D. dependent var Sum squared resid 23.10000 3.847901 203.4015 0.747002 0.740677 1.959495 Mean dependent var S.D. dependent var Sum squared resid 23.10000 3.847901 153.5848 3.028598 Estimación del modelo de efectos fijos por MC ponderados Dependent Variable: S? Method: GLS (Cross Section Weights) Date: 05/20/02 Time: 17:21 Sample: 1 3 Included observations: 3 Number of cross-sections used: 14 Total panel (balanced) observations: 42 Convergence achieved after 6 iterations Variable G? Fixed Effects AT--C BE--C DK--C ES--C FI--C FR--C GR--C IR--C IT--C NL--C PO--C SE--C UK--C WD--C Weighted Statistics Coefficient 1.330743 Std. Error 0.082269 t-Statistic 16.17554 Prob. 0.0000 R-squared Adjusted R-squared S.E. of regression F-statistic Prob(F-statistic) Unweighted Statistics 0.999262 0.998879 2.274509 2609.683 0.000000 Mean dependent var S.D. dependent var Sum squared resid Durbin-Watson stat 52.19698 67.92257 139.6816 3.058891 R-squared Adjusted R-squared S.E. of regression Durbin-Watson stat 0.769902 0.650592 2.274523 3.352997 Mean dependent var S.D. dependent var Sum squared resid 23.10000 3.847901 139.6833 21.85343 16.46419 15.54085 17.47858 19.92087 19.05420 20.27858 12.33319 19.81010 20.73086 19.47884 17.38520 14.67314 20.44136 Tipo modelo Efectos fijos Coef. Beta 1.24 Error estándar 0.264 Efectos estocásticos 1.28 0.255 Efectos fijos ponderados 1.33 0.082
