INTRODUCCIÓN
Anuncio
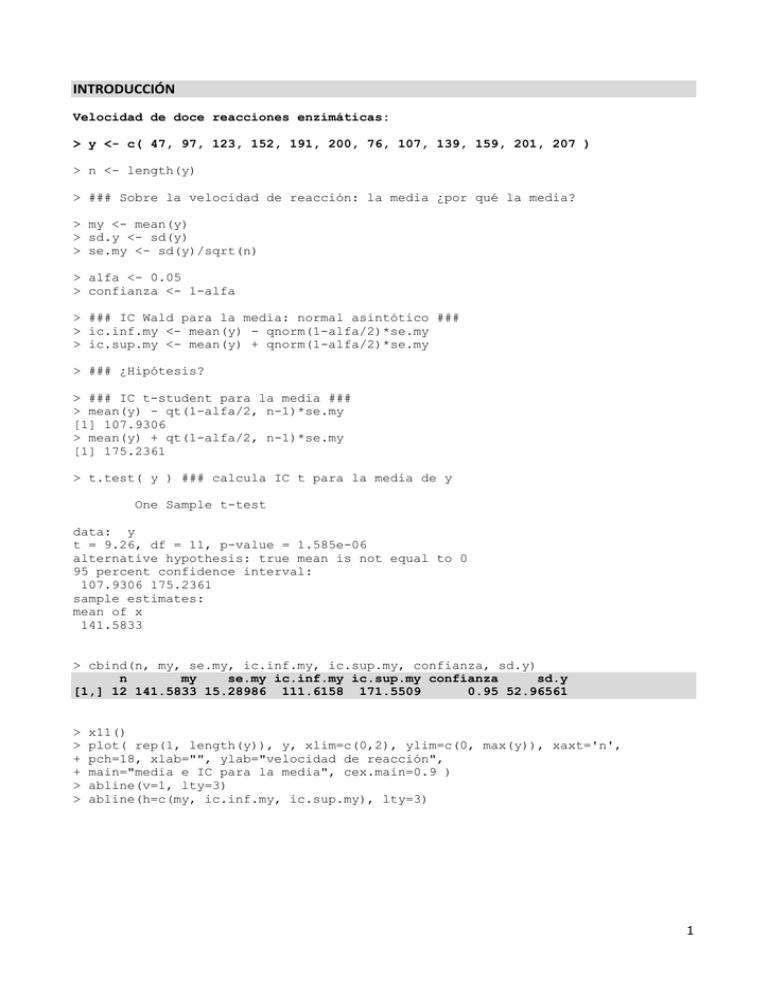
INTRODUCCIÓN Velocidad de doce reacciones enzimáticas: > y <- c( 47, 97, 123, 152, 191, 200, 76, 107, 139, 159, 201, 207 ) > n <- length(y) > ### Sobre la velocidad de reacción: la media ¿por qué la media? > my <- mean(y) > sd.y <- sd(y) > se.my <- sd(y)/sqrt(n) > alfa <- 0.05 > confianza <- 1-alfa > ### IC Wald para la media: normal asintótico ### > ic.inf.my <- mean(y) - qnorm(1-alfa/2)*se.my > ic.sup.my <- mean(y) + qnorm(1-alfa/2)*se.my > ### ¿Hipótesis? > ### IC t-student para la media ### > mean(y) - qt(1-alfa/2, n-1)*se.my [1] 107.9306 > mean(y) + qt(1-alfa/2, n-1)*se.my [1] 175.2361 > t.test( y ) ### calcula IC t para la media de y One Sample t-test data: y t = 9.26, df = 11, p-value = 1.585e-06 alternative hypothesis: true mean is not equal to 0 95 percent confidence interval: 107.9306 175.2361 sample estimates: mean of x 141.5833 > cbind(n, my, se.my, ic.inf.my, ic.sup.my, confianza, sd.y) n my se.my ic.inf.my ic.sup.my confianza sd.y [1,] 12 141.5833 15.28986 111.6158 171.5509 0.95 52.96561 > > + + > > x11() plot( rep(1, length(y)), y, xlim=c(0,2), ylim=c(0, max(y)), xaxt='n', pch=18, xlab="", ylab="velocidad de reacción", main="media e IC para la media", cex.main=0.9 ) abline(v=1, lty=3) abline(h=c(my, ic.inf.my, ic.sup.my), lty=3) 1 > ### ¿comodidad? > m.lm <- lm( y ~ 1 ) ### ¿null model? > summary( m.lm ) Call: lm(formula = y ~ 1) Residuals: Min 1Q Median 3Q Max -94.583 -37.083 3.917 51.667 65.417 Coefficients: Estimate Std. Error t value Pr(>|t|) (Intercept) 141.58 15.29 9.26 1.59e-06 *** Residual standard error: 52.97 on 11 degrees of freedom > confint.default( m.lm ) 2.5 % 97.5 % (Intercept) 111.6158 171.5509 > confint( m.lm ) 2.5 % 97.5 % (Intercept) 107.9306 175.2361 100 50 0 velocidad de reacción 150 200 media e IC para la media 2 > ### ¿normalidad? > ks.test( y, pnorm, my, sd.y ) One-sample Kolmogorov-Smirnov test data: y D = 0.1579, p-value = 0.8809 alternative hypothesis: two-sided > shapiro.test( y ) Shapiro-Wilk normality test data: y W = 0.9408, p-value = 0.5081 > x11() > qqnorm( (y-my)/sd.y ) > abline( 0, 1, lty=3 ) 0.0 -0.5 -1.0 -1.5 Sample Quantiles 0.5 1.0 Normal Q-Q Plot -1.5 -1.0 -0.5 0.0 0.5 1.0 1.5 Theoretical Quantiles 3 > ### bootstrap sobre la media > ### inútil para estimar el error estándar > R <- 5000 > set.seed( 57823 ) > MatrixBoot <- matrix(sample(y,R*n,replace=T), nrow=R, ncol=n) > m.boot <- apply(MatrixBoot, 1, mean) > length(m.boot) [1] 5000 > > > > x11() hist( m.boot, probability=T, breaks=50 ) abline( v=my, lty=2, col="blue" ) curve( dnorm(x,my,se.my), add=T, col="blue" ) > mean( m.boot ) ### esto es ¡INÚTIL!!! [1] 141.6745 > sd( m.boot ) ### esta estimación del se de la media es ¡INÚTIL!! [1] 14.54795 > quantile( m.boot, c(0.025,0.05,0.5,0.95,0.975) ) 2.5% 5% 50% 95% 97.5% 112.7479 117.1667 142.0833 165.0042 168.8354 > rug( quantile( m.boot, c(0.025,0.05,0.5,0.95,0.975) ) ) 4 > ################################################################### > ### Sobre la velocidad de reacción: diferencia entre dos grupos ### > G <- as.factor( rep(c(0,1), 6) ) > g <- as.numeric( G ) ### numérica con valores 1,2 > data.frame(G, g, y) ### distinto de cbind(G, g, y) G g y 1 0 1 47 2 1 2 97 3 0 1 123 4 1 2 152 5 0 1 191 6 1 2 200 7 0 1 76 8 1 2 107 9 0 1 139 10 1 2 159 11 0 1 201 12 1 2 207 > > + + x11() plot( g, y, xlim=c(0,3), ylim=c(0, max(y)), xaxt='n', pch=18, xlab="", ylab="velocidad de reacción", main="Velocidad de reacción de dos grupos", cex.main=0.9 ) > axis( 1, at=c(1, 2), lab=c("Grupo: 1", "Grupo: 2"), cex.axis=0.9 ) > abline(v=c(1,2), lty=3) > my.1 <- tapply(y, g, mean)[1] > my.2 <- tapply(y, g, mean)[2] > points(c(1,2), c(my.1,my.2), pch=3, col="blue", lwd=2) > abline( lm(y ~ g)$coef, lty=3) ### igual que lsfit(g, y)$coef > cbind(n, my, my.1, my.2) n my my.1 my.2 1 12 141.5833 129.5 153.6667 > ### comparación de medias de ambos grupos > t.test( y[g==1], y[g==2], var.equal=T ) Two Sample t-test data: y[g == 1] and y[g == 2] t = -0.7759, df = 10, p-value = 0.4558 alternative hypothesis: true difference in means is not equal to 0 95 percent confidence interval: -93.56980 45.23647 sample estimates: mean of x mean of y 129.5000 153.6667 > n1 <- length(y[g==1]) > s2.g1 <- var(y[g==1]) > n2 <- length(y[g==2]) > s2.g2 <- var(y[g==2]) 5 > s2.tot <- ( (n1-1)*s2.g1 + (n2-1)*s2.g2 ) / (n1+n2-2) > TT <- as.numeric( (my.1-my.2) /( sqrt(s2.tot)*sqrt( (1/n1)+(1/n2) ) ) ) > TT [1] -0.7758538 > > 2*( 1-pt( abs(TT), n1+n2-2 ) ) [1] 0.4557924 > ### Test F de igualdad de varianzas > var.test( y[g==1], y[g==2] ) F test to compare two variances data: y[g == 1] and y[g == 2] F = 1.7957, num df = 5, denom df = 5, p-value = 0.5362 alternative hypothesis: true ratio of variances is not equal to 1 95 percent confidence interval: 0.2512722 12.8326677 sample estimates: ratio of variances 1.795687 > FF <- s2.g1 / s2.g2 > FF [1] 1.795687 > 2*(1-pf( FF, 5, 5 )) [1] 0.5361563 100 50 0 velocidad de reacción 150 200 Velocidad de reacción de dos grupos Grupo: 1 Grupo: 2 6 > y.G.lm <- lm( y ~ G ) ### var explicativa factor 0, 1. ¿ANOVA un factor? > summary( y.G.lm ) Call: lm(formula = y ~ G) Residuals: Min 1Q -82.500 -48.375 Median 1.833 3Q 48.083 Max 71.500 Coefficients: Estimate Std. Error t value Pr(>|t|) (Intercept) 129.50 22.03 5.880 0.000155 *** G1 24.17 31.15 0.776 0.455792 Residual standard error: 53.95 on 10 degrees of freedom Multiple R-squared: 0.05678, Adjusted R-squared: -0.03755 F-statistic: 0.6019 on 1 and 10 DF, p-value: 0.4558 > confint( y.G.lm ) 2.5 % 97.5 % (Intercept) 80.42457 178.5754 G1 -45.23647 93.5698 > g01 <- g-1 ### codificación 0,1 de los grupos: var explicativa numérica > y.g01.lm <- lm( y ~ g01 ) ### igual que y.G.lm 7 > ### otra variable explicativa: xx ################################## > ### supongamos que la respuesta media depende de xx (índice de condiciones ambientales) > xx <- c( 1, 3.5, 3.1, 5.5, 5.1, 7, 1.8, 4.2, 4, 6, 5.6, 8 ) > > + + x11() plot( xx, y, pch=18, xlim=c(min(xx), max(xx)), ylim=c(0, max(y)), xlab="var explicativa: xx", ylab="velocidad de reacción", main="modelos: NULL, FULL, ¿lineal? E(Y/xx) = a + b*xx", cex.main=0.9 ) > abline( h=my, lty=3 ) ### NULL model > lines( xx[order(xx)], y[order(xx)], lty=3 ) ### FULL model > points( mean(xx), my, pch=3 ) > y.xx <- lm( y ~ xx ) ### ¿regresión lineal? > summary( y.xx ) Call: lm(formula = y ~ xx) Residuals: Min 1Q Median 3Q Max -25.860 -16.371 -4.745 12.251 36.728 Coefficients: Estimate Std. Error t value Pr(>|t|) (Intercept) 32.937 15.970 2.062 0.0661 . xx 23.791 3.214 7.403 2.31e-05 *** Residual standard error: 21.82 on 10 degrees of freedom Multiple R-squared: 0.8457, Adjusted R-squared: 0.8303 F-statistic: 54.81 on 1 and 10 DF, p-value: 2.306e-05 > abline( coef(y.xx) ) 100 50 0 velocidad de reacción 150 200 modelos: NULL, FULL, ¿lineal? E(Y/xx) = a + b*xx 1 2 3 4 5 var explicativa: xx 6 7 8 8 > y.full <- lm( y ~ factor(xx) ) > summary( y.full ) ### ¿full model? Call: lm(formula = y ~ factor(xx)) Residuals: ALL 12 residuals are 0: no residual degrees of freedom! Coefficients: (Intercept) factor(xx)1.8 factor(xx)3.1 factor(xx)3.5 factor(xx)4 factor(xx)4.2 factor(xx)5.1 factor(xx)5.5 factor(xx)5.6 factor(xx)6 factor(xx)7 factor(xx)8 Estimate Std. Error t value Pr(>|t|) 47 NA NA NA 29 NA NA NA 76 NA NA NA 50 NA NA NA 92 NA NA NA 60 NA NA NA 144 NA NA NA 105 NA NA NA 154 NA NA NA 112 NA NA NA 153 NA NA NA 160 NA NA NA Residual standard error: NaN on 0 degrees of freedom Multiple R-squared: 1, Adjusted R-squared: F-statistic: NaN on 11 and 0 DF, p-value: NA NaN > cbind( y, predict( y.full ) ) y 1 47 47 2 97 97 3 123 123 4 152 152 5 191 191 6 200 200 7 76 76 8 107 107 9 139 139 10 159 159 11 201 201 12 207 207 > xx2 <- xx^2 > y.xx2 <- lm( y ~ xx + xx2 ) > summary( y.xx2 ) ### ¿regresión lineal? Call: lm(formula = y ~ xx + xx2) Residuals: Min 1Q Median 3Q -30.786 -16.148 2.327 8.026 Max 32.281 Coefficients: Estimate Std. Error t value Pr(>|t|) (Intercept) 12.312 28.337 0.434 0.6742 xx 35.324 13.421 2.632 0.0273 * xx2 -1.297 1.465 -0.886 0.3989 Residual standard error: 22.06 on 9 degrees of freedom Multiple R-squared: 0.8581, Adjusted R-squared: 0.8265 F-statistic: 27.21 on 2 and 9 DF, p-value: 0.0001529 9 > anova( y.xx, y.xx2 ) Analysis of Variance Table Model 1: Model 2: Res.Df 1 10 2 9 y ~ xx y ~ xx + xx2 RSS Df Sum of Sq F Pr(>F) 4761.5 4379.8 1 381.7 0.7843 0.3989 ### ¿mejor modelo? > #################################################################### > ### ¿efecto de G? > > + + x11() plot(xx[g==1],y[g==1],pch="1",xlim=c(min(xx), max(xx)), ylim=c(0, max(y)), xlab="var explicativa: xx", ylab="velocidad de reacción", main="dos modelos para E(Y/xx,G)", cex.main=0.9 ) > points(xx[g==2],y[g==2],pch="2") > points( mean(xx[g==1]), my.1, pch=3, lwd=2 ) > points( mean(xx[g==2]), my.2, pch=3, lwd=2 ) > y.xx.G <- lm( y ~ xx + G ) > summary( y.xx.G ) ### ¿ ANCOVA ¿ Call: lm(formula = y ~ xx + G) Residuals: Min 1Q -16.551 -4.833 Median 1.269 3Q 5.959 Max 10.859 Coefficients: Estimate Std. Error t value Pr(>|t|) (Intercept) 25.180 6.865 3.668 0.00517 ** xx 30.384 1.670 18.196 2.09e-08 *** G1 -44.705 6.546 -6.829 7.65e-05 *** Residual standard error: 9.251 on 9 degrees of freedom Multiple R-squared: 0.975, Adjusted R-squared: 0.9695 F-statistic: 175.8 on 2 and 9 DF, p-value: 6.134e-08 > a <- y.xx.G$coef[1] > bx <- y.xx.G$coef[2] > bG <- y.xx.G$coef[3] > abline(a, bx, lty=3) > abline(a+bG, bx, lty=3) > anova( y.xx, y.xx.G ) Analysis of Variance Table Model 1: y ~ xx Model 2: y ~ xx + G Res.Df RSS Df Sum of Sq F Pr(>F) 1 10 4761.5 2 9 770.3 1 3991.2 46.633 7.653e-05 *** 10 > ### interacción xx*G > y.xx.G.inter <- lm( y ~ xx * G ) > summary( y.xx.G.inter ) Call: lm(formula = y ~ xx * G) Residuals: Min 1Q -9.5030 -3.6579 Median 0.1873 3Q Max 3.9284 11.5904 Coefficients: Estimate Std. Error t value Pr(>|t|) (Intercept) 14.364 6.774 2.121 0.0668 . xx 33.535 1.777 18.875 6.42e-08 *** G1 -13.032 13.179 -0.989 0.3517 xx:G1 -6.809 2.612 -2.607 0.0313 * Residual standard error: 7.215 on 8 degrees of freedom Multiple R-squared: 0.9865, Adjusted R-squared: 0.9814 F-statistic: 194.9 on 3 and 8 DF, p-value: 8.121e-08 > pred0 <- predict( y.xx.G.inter, list(xx=c(1,8), G=c("0","0")) ) Mensajes de aviso perdidos In model.frame.default(Terms, newdata, na.action = na.action, xlev = object$xlevels) : character variable 'G' changed to a factor > lines(c(1,8), pred0, col="red", lwd=2) > pred1 <- predict( y.xx.G.inter, list(xx=c(1,8), G=c("1","1")) ) > lines(c(1,8), pred1, col="blue", lwd=2) > anova( y.xx, y.xx.G, y.xx.G.inter ) Analysis of Variance Table Model 1: Model 2: Model 3: Res.Df 1 10 2 9 3 8 y ~ xx y ~ xx + G y ~ xx * G RSS Df Sum of Sq F Pr(>F) 4761.5 770.3 1 3991.2 76.6653 2.267e-05 *** 416.5 1 353.8 6.7961 0.03128 * > library( MASS ) > stepAIC( y.xx.G.inter ) Start: AIC=50.56 y ~ xx * G Df Sum of Sq <none> - xx:G 1 RSS AIC 416.49 50.563 353.81 770.30 55.942 Call: lm(formula = y ~ xx * G) Coefficients: (Intercept) 14.364 xx 33.535 G1 -13.032 xx:G1 -6.809 11 200 dos modelos para E(Y/xx,G) 2 1 2 1 1 1 100 2 2 50 1 1 0 velocidad de reacción 150 2 2 1 2 3 4 5 6 7 8 var explicativa: xx 12 El Problema El problema es explicar el comportamiento de la velocidad de una reacción enzimática, al cambiar la concentración de puromicina en el sustrato en el que tiene lugar la reacción. Se dispone de dos observaciones diferentes para cada una de seis dosis de puromicina: cp <- c(0.02, 0.06, 0.11, 0.22, 0.56, 1.10) ### concentracion de puromycina v1 <- c(47, 97, 123, 152, 191, 200) ### velocidad de reaccion bajo cp v2 <- c(76, 107, 139, 159, 201, 207) ### velocidad de reaccion bajo cp 150 100 50 0 y: velocidad de reacción 200 Datos y modelos Null y Full 0.0 0.2 0.4 0.6 0.8 1.0 1.2 x: concentración de puromicina 13
