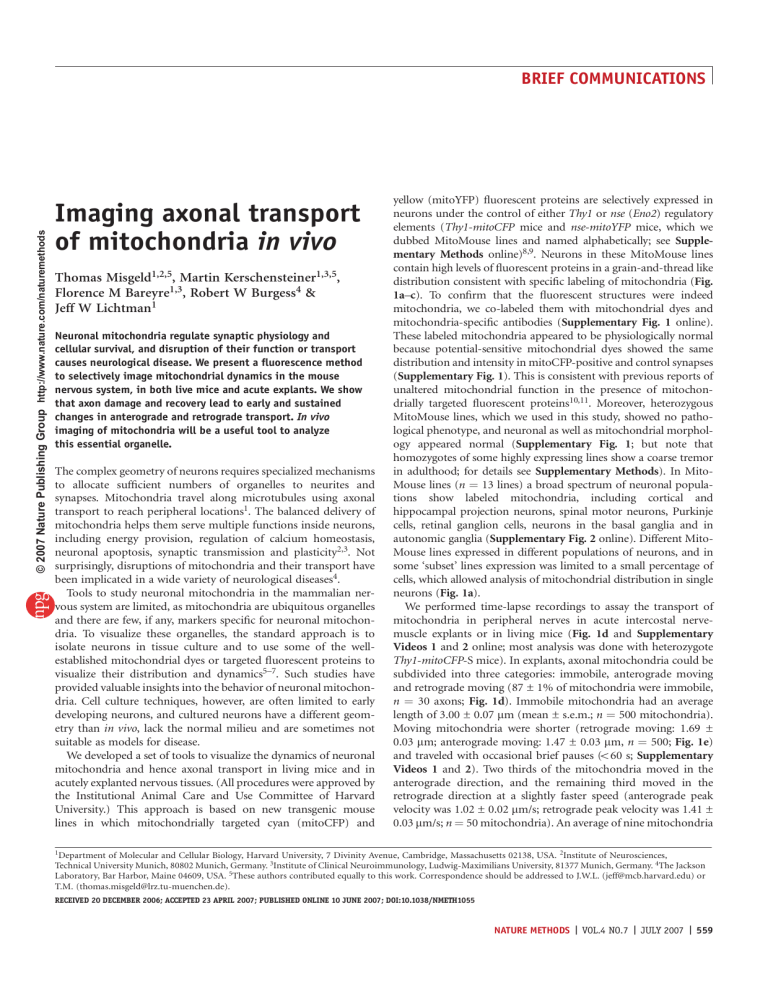
© 2007 Nature Publishing Group http://www.nature.com/naturemethods BRIEF COMMUNICATIONS Imaging axonal transport of mitochondria in vivo Thomas Misgeld1,2,5, Martin Kerschensteiner1,3,5, Florence M Bareyre1,3, Robert W Burgess4 & Jeff W Lichtman1 Neuronal mitochondria regulate synaptic physiology and cellular survival, and disruption of their function or transport causes neurological disease. We present a fluorescence method to selectively image mitochondrial dynamics in the mouse nervous system, in both live mice and acute explants. We show that axon damage and recovery lead to early and sustained changes in anterograde and retrograde transport. In vivo imaging of mitochondria will be a useful tool to analyze this essential organelle. The complex geometry of neurons requires specialized mechanisms to allocate sufficient numbers of organelles to neurites and synapses. Mitochondria travel along microtubules using axonal transport to reach peripheral locations1. The balanced delivery of mitochondria helps them serve multiple functions inside neurons, including energy provision, regulation of calcium homeostasis, neuronal apoptosis, synaptic transmission and plasticity2,3. Not surprisingly, disruptions of mitochondria and their transport have been implicated in a wide variety of neurological diseases4. Tools to study neuronal mitochondria in the mammalian nervous system are limited, as mitochondria are ubiquitous organelles and there are few, if any, markers specific for neuronal mitochondria. To visualize these organelles, the standard approach is to isolate neurons in tissue culture and to use some of the wellestablished mitochondrial dyes or targeted fluorescent proteins to visualize their distribution and dynamics5–7. Such studies have provided valuable insights into the behavior of neuronal mitochondria. Cell culture techniques, however, are often limited to early developing neurons, and cultured neurons have a different geometry than in vivo, lack the normal milieu and are sometimes not suitable as models for disease. We developed a set of tools to visualize the dynamics of neuronal mitochondria and hence axonal transport in living mice and in acutely explanted nervous tissues. (All procedures were approved by the Institutional Animal Care and Use Committee of Harvard University.) This approach is based on new transgenic mouse lines in which mitochondrially targeted cyan (mitoCFP) and yellow (mitoYFP) fluorescent proteins are selectively expressed in neurons under the control of either Thy1 or nse (Eno2) regulatory elements (Thy1-mitoCFP mice and nse-mitoYFP mice, which we dubbed MitoMouse lines and named alphabetically; see Supplementary Methods online)8,9. Neurons in these MitoMouse lines contain high levels of fluorescent proteins in a grain-and-thread like distribution consistent with specific labeling of mitochondria (Fig. 1a–c). To confirm that the fluorescent structures were indeed mitochondria, we co-labeled them with mitochondrial dyes and mitochondria-specific antibodies (Supplementary Fig. 1 online). These labeled mitochondria appeared to be physiologically normal because potential-sensitive mitochondrial dyes showed the same distribution and intensity in mitoCFP-positive and control synapses (Supplementary Fig. 1). This is consistent with previous reports of unaltered mitochondrial function in the presence of mitochondrially targeted fluorescent proteins10,11. Moreover, heterozygous MitoMouse lines, which we used in this study, showed no pathological phenotype, and neuronal as well as mitochondrial morphology appeared normal (Supplementary Fig. 1; but note that homozygotes of some highly expressing lines show a coarse tremor in adulthood; for details see Supplementary Methods). In MitoMouse lines (n ¼ 13 lines) a broad spectrum of neuronal populations show labeled mitochondria, including cortical and hippocampal projection neurons, spinal motor neurons, Purkinje cells, retinal ganglion cells, neurons in the basal ganglia and in autonomic ganglia (Supplementary Fig. 2 online). Different MitoMouse lines expressed in different populations of neurons, and in some ‘subset’ lines expression was limited to a small percentage of cells, which allowed analysis of mitochondrial distribution in single neurons (Fig. 1a). We performed time-lapse recordings to assay the transport of mitochondria in peripheral nerves in acute intercostal nervemuscle explants or in living mice (Fig. 1d and Supplementary Videos 1 and 2 online; most analysis was done with heterozygote Thy1-mitoCFP-S mice). In explants, axonal mitochondria could be subdivided into three categories: immobile, anterograde moving and retrograde moving (87 ± 1% of mitochondria were immobile, n ¼ 30 axons; Fig. 1d). Immobile mitochondria had an average length of 3.00 ± 0.07 mm (mean ± s.e.m.; n ¼ 500 mitochondria). Moving mitochondria were shorter (retrograde moving: 1.69 ± 0.03 mm; anterograde moving: 1.47 ± 0.03 mm, n ¼ 500; Fig. 1e) and traveled with occasional brief pauses (o60 s; Supplementary Videos 1 and 2). Two thirds of the mitochondria moved in the anterograde direction, and the remaining third moved in the retrograde direction at a slightly faster speed (anterograde peak velocity was 1.02 ± 0.02 mm/s; retrograde peak velocity was 1.41 ± 0.03 mm/s; n ¼ 50 mitochondria). An average of nine mitochondria 1Department of Molecular and Cellular Biology, Harvard University, 7 Divinity Avenue, Cambridge, Massachusetts 02138, USA. 2Institute of Neurosciences, Technical University Munich, 80802 Munich, Germany. 3Institute of Clinical Neuroimmunology, Ludwig-Maximilians University, 81377 Munich, Germany. 4The Jackson Laboratory, Bar Harbor, Maine 04609, USA. 5These authors contributed equally to this work. Correspondence should be addressed to J.W.L. (jeff@mcb.harvard.edu) or T.M. (thomas.misgeld@lrz.tu-muenchen.de). RECEIVED 20 DECEMBER 2006; ACCEPTED 23 APRIL 2007; PUBLISHED ONLINE 10 JUNE 2007; DOI:10.1038/NMETH1055 NATURE METHODS | VOL.4 NO.7 | JULY 2007 | 559 BRIEF COMMUNICATIONS 3 a Figure 1 | In vivo imaging of mitochondrial transport. (a) Layer V cortical neuron in a Thy1-mitoCFP-H mouse showing a dense accumulation of mitochondria that surrounds the nucleus (inset 1), multiple tracks of mitochondria in shafts of proximal dendrites (inset 2) and single files of mitochondria in distal dendrites (inset 3). (b) Soma of a cortical neuron expressing both mitochondrial CFP (cyan) and cytoplasmic YFP (yellow; Thy1-mitoCFP-S Thy1-YFP-H). (c) Peripheral motor nerve fascicle in a Thy1-mitoCFP-S mouse. Mitochondria align inside motor axons (inset 1), and a high density of mitochondria fills the terminal branches of neuromuscular junctions (inset 2; acetylcholine receptors labeled with a-bungarotoxin; red). Calculations based on the integrated fluorescence intensity in Thy1-mitoCFP neuromuscular junctions estimate the number of mitochondria within an individual neuromuscular junction to several hundred (343 ± 45 mitochondria). (d) Time-lapse series of mitochondria in the proximal part of an intercostal axon in a nerve-muscle explant. An averaged still frame of the imaged axon segment (top), and the filtered and intensity-inverted version of the image (middle) are shown. Image series of the boxed areas are shown in the bottom panels (frame rate, 1 Hz; Supplementary Video 2). (e) Size histogram of axonal mitochondria (n ¼ 500). (f) The number of mitochondria transported in the anterograde and retrograde direction in a single axon varies, but does not correlate with the cross-sectional area of the axon (n ¼ 117 axons). Scale bars, 25 mm (a), 5 mm (b,d and insets in a), 10 mm (c) and 1 mm (insets in c). Nonlinear gamma settings were used in all panels. 1 c 1 2 2 1 2 2 d 1 Stationary b 40 Moving Stationary 20 0 <1 <2 <3 <4 <5 <6 Length (µm) Anterograde Retrograde Anterograde f 10 Mitochondria (min–1) e Frequency (%) © 2007 Nature Publishing Group http://www.nature.com/naturemethods 3 20 0 10 40 60 Axon area (µm2) Retrograde passed through an axonal cross-section per minute in explanted axons (mean ¼ 9.0 ± 0.3 mitochondria/min; anterograde moving: 5.9 ± 0.2 mitochondria/min; retrograde moving: 3.1 ± 0.1 mitochondria/min; n ¼ 117 axons). In living mice, we observed similar mitochondrial behavior and morphology, although both anterograde and retrograde transport rates were slightly lower (anterograde: 4.1 ± 0.2 per min; retrograde: 2.3 ± 0.1 per min; n ¼ 67 axons). Transport rates varied in different axons (3–18 per min; s.d. ¼ 2.9), but the anterograde and retrograde rates for each axon correlated (Spearman R ¼ 0.64; P o 0.0001). To our surprise the average number of mitochondria moving within an axon did not correlate with the axonal cross-sectional area (Fig. 1f), meaning that on average small-caliber axons had many more mitochondria passing through a given volume of axoplasm than larger axons. At the same time, in all axons, the number of transported mitochondria per axonal cross-section dropped in a proximal-todistal direction as the stream of mitochondrial cargo is divided at 560 | VOL.4 NO.7 | JULY 2007 | NATURE METHODS each axonal branch point (Supplementary Fig. 3 and Supplementary Video 3 online). To explore mitochondrial changes that accompany axonal degeneration and regeneration, we transected intercostal nerves in vivo and then studied axonal transport of mitochondria at various times thereafter in acutely explanted preparations (Fig. 2). In the distal axon segment, we noted dramatic changes in mitochondrial transport before the onset of Wallerian degeneration. Anterograde transport was already reduced two- to threefold by 3 h after transection and more than 20-fold by 6 h (Fig. 2b), likely because the supply of mitochondria is interrupted. During the same time period, retrograde transport remained largely unchanged but then dropped substantially between 6 and 12 h after transection. This argues that sufficient energy substrates are available in the distal nerve segment to uphold transport at least for the first 6 h after transection. In parallel, the appearance of mitochondria in degenerating axons and synapses changed. The distal axons no longer possessed long, extended mitochondria; rather the mitochondrial staining appeared as small, relatively immobile grains (Fig. 2c). In contrast to the degeneration of the nerve distal to a cut, the proximal segments mounted a vigorous growth response and, within a week, formed a complex tangle of axonal sprouts, which were quickly populated by mitochondria (Fig. 2d and Supplementary Video 4 online). By 12 h after nerve cut, anterograde transport in the uninjured proximal nerve increased by more than 80% (Fig. 2b; lesioned axons at 12 h, 12.1 ± 0.7 mitochondria/minute, versus control axons in unlesioned nerves of the same mice, 7.0 ± 0.6 mitochondria/min, n 4 14 axons per time point; P o 0.0001, Mann-Whitney U test). This increase was sustained at 24 h and 48 h and declined only slightly during the subsequent weeks. Retrograde transport in the proximal axon stump, which initially dropped (because the retrograde stream of mitochondria was cut off), then followed the increase in anterograde transport with a 12 h phase shift and also remained elevated. The in vivo time-lapse imaging method we describe permits study of mitochondrial transport in situ and reveals phenomena that were not previously known. For example, the number of transported BRIEF COMMUNICATIONS a c Anterograde Retrograde d 00:00 c Control Above 06.17 Below 6h 13:46 6h 24 h 21:01 30:21 39:28 46:30 24 h b Above inset 20 Mitochondria (min–1) 55:12 Mitochondria (min–1) © 2007 Nature Publishing Group http://www.nature.com/naturemethods Day 7 62:40 20 71:23 Below 10 10 0 12 24 Time after lesion (h) 79:10 Day 7 85:23 5 10 Total Anterograde Retrograde 91:28 98:34 0 7 14 Time after lesion (d) 21 0 12 24 106:13 Time after lesion (h) organelles is the same in large- and small-caliber motor axons. Because axon caliber correlates with motor unit size, this result indicates a greater mitochondrial turnover in small (and based on the size principle, frequently firing) motor neurons, which appear to have significantly greater mitochondrial flux than larger and less frequently-firing motor axons12. We also found that anterograde transport of mitochondria exceeded retrograde transport throughout the branching arbor of mature motor axons (including in preterminal axons). The difference between anterograde and retrograde transport suggests that some portion of the mitochondria are degraded along the axon or in the synapses. These observations stress that measuring transport in axons with realistic geometries in situ will provide new insights in neuronal cell biology. Additionally, it is likely that an important application of in vivo imaging of mitochondria will be the mechanistic analysis of neurological diseases. We show that alterations of mitochondrial transport during axonal degeneration and regeneration indicate early stages of neuronal dysfunction and recovery. For example, the increase in mitochondrial transport following axonal transection occurs well before axonal regrowth is initiated and can serve as a peripheral readout of the central ‘injury response’. Likewise, axonal transport in disconnected axon segments stalls, and mitochondria change their morphology before axonal fragmentation sets in. Similar changes in mitochondrial morphology can be observed using MitoMouse lines in a genetic model of amyotrophic lateral sclerosis (T.M., M.K., J. Song and J.W.L.; unpublished observations). Imaging mitochondria and axonal transport at single-particle level in living mice is now possible (for an example of repetitive imaging in living mice, see Supplementary Fig. 4 online; for a similar approach in flies, see ref. 13) and can be complemented by subsequent morphological, electrophysiological and biochemical analysis of fluorescently labeled mitochondria10,11,14. This approach will be useful to clarify the role of neuronal mitochondria in synaptic Figure 2 | Imaging mitochondrial pathology after axonal injury. (a) Intercostal nerves were transected in living mice, and mitochondrial transport was measured above (proximal) and below (distal) the lesion in an acute nerve muscle explant. (b) Quantification of mitochondrial transport in transected axons. Time course of transport changes above (left) and below (right) the lesion (inset, first 24 h after lesion). Only axons that were not fragmented in the field of view were included in this analysis. Data points are mean ± s.e.m. (n ¼ 6–63 axons per data point). (c) Large panels show morphology of mitochondria in neuromuscular junctions (Thy1-mitoCFP-S Thy1-YFP-H; left, merge; right, mitoCFP alone), 6 h (top), 24 h (middle) and 7 d (bottom) after transection. Small panels below show axonal mitochondria. YFP, yellow; CFP, cyan; bungarotoxin, red. (d) Timelapse of a growth cone (location indicated by a bracket at the bottom of a) over 106 min (Thy1mitoCFP-S Thy1-YFP-H). Mitochondria (cyan) rapidly change their position as the growth cone (cytoplasm, yellow) advances, and the organelles fill the axon tip soon after extension (Supplementary Video 4). Time is given as minutes:seconds. Scale bars, 100 mm (a), 10 mm (larger panels in c); 2.5 mm (smaller panels in c), and 5 mm (d). Nonlinear gamma settings were used in all panels. physiology and the suspected pathogenic role of this organelle in amyotrophic lateral sclerosis, Parkinson’s and Alzheimer’s disease2,4. Note: Supplementary information is available on the Nature Methods website. ACKNOWLEDGMENTS We thank P. Glass, K. Mahoney, D. Malkowski and S. Haddad for administrative support and animal husbandry, and J. Sanes for valuable suggestions. We thank C. McCann and J. Morgan for advice on anatomical analysis, and L. Godinho for critically reading the manuscript. We also thank the employees of electron microscopy and microinjection services at the Jackson Laboratory. This work was supported by grants from the Dana Foundation (T.M. and M.K.), the Emmy Noether program of the Deutsche Forschungsgemeinschaft (M.K.), the Alexandervon-Humboldt foundation (T.M.), the ‘‘Verein Therapieforschung für MS-Kranke e.V.’’ (M.K.), the European Molecular Biology Organization (F.M.B.), the ALS Association (R.W.B.) and the US National Institutes of Health (J.W.L.). COMPETING INTERESTS STATEMENT The authors declare no competing financial interests. Published online at http://www.nature.com/naturemethods Reprints and permissions information is available online at http://npg.nature.com/reprintsandpermissions 1. 2. 3. 4. 5. 6. 7. 8. 9. 10. 11. Hollenbeck, P.J. & Saxton, W.M. J. Cell Sci. 118, 5411–5419 (2005). Chan, D.C. Cell 125, 1241–1252 (2006). Li, Z., Okamoto, K., Hayashi, Y. & Sheng, M. Cell 119, 873–887 (2004). Beal, M.F. Ann. Neurol. 58, 495–505 (2005). Morris, R.L. & Hollenbeck, P.J. J. Cell Biol. 131, 1315–1326 (1995). Ligon, L.A. & Steward, O. J. Comp. Neurol. 427, 340–350 (2000). Miller, K.E. & Sheetz, M.P. J. Cell Sci. 117, 2791–2804 (2004). Feng, G. et al. Neuron 28, 41–51 (2000). Forss-Petter, S. et al. Neuron 5, 187–197 (1990). Shitara, H. et al. FEBS Lett. 500, 7–11 (2001). Chandrasekaran, K., Hazelton, J.L., Wang, Y., Fiskum, G. & Kristian, G. J. Neurosci. 26, 13123–13127 (2006). 12. Bawa, P., Binder, M.D., Ruenzel, P. & Henneman, E. J. Neurophysiol. 52, 410–420 (1984). 13. Pilling, A.D., Horiuchi, D., Lively, C.M. & Saxton, W.M. Mol. Biol. Cell 17, 2057– 2068 (2006). 14. Cavelier, L., Johannisson, A. & Gyllensten, U. Exp. Cell Res. 259, 79–85 (2000). NATURE METHODS | VOL.4 NO.7 | JULY 2007 | 561
