Diagnostic Test Rating Index: Youden's J Statistic
Anuncio
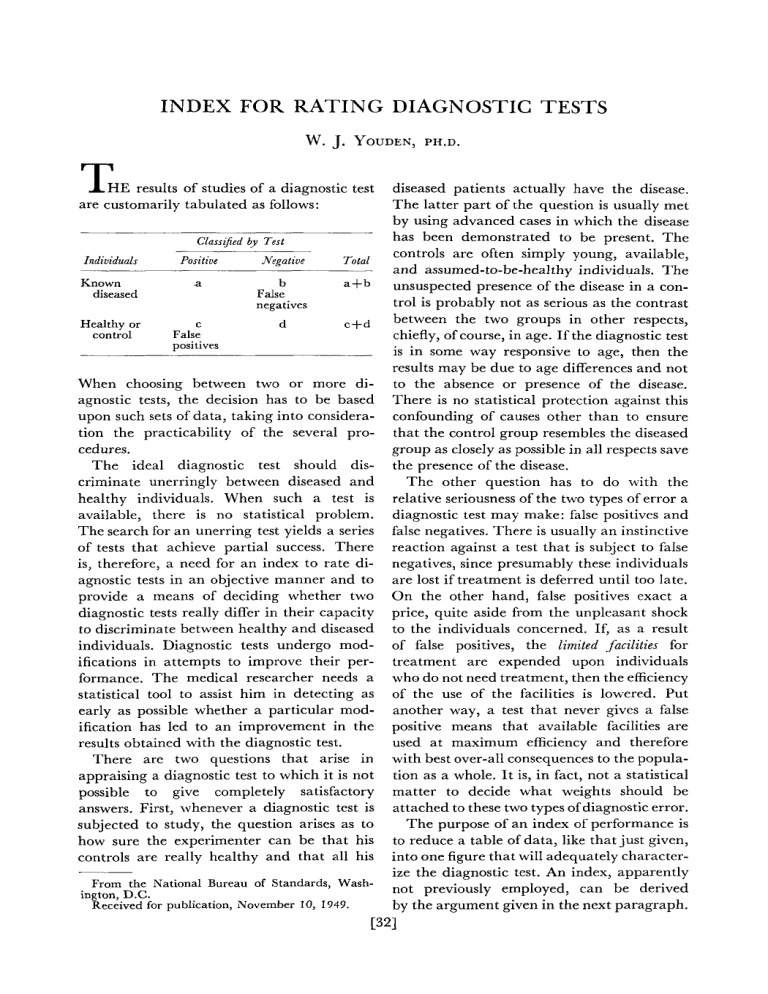
INDEX FOR RATING DIAGNOSTIC TESTS W. J. YOUDEN,PH.D. THE results of studies of a diagnostic test are customarily tabulated as follows: ClassiJed by Test Individuals Positive Negative Total Known diseased .a b False negatives a f b C d c+d Healthy or control False positives When choosing between two or more diagnostic tests, the decision has to be based upon such sets of data, taking into consideration the practicability of the several procedures. The ideal diagnostic test should discriminate unerringly between diseased and healthy individuals. When such a test is available, there is no statistical problem. The search for an unerring test yields a series of tests that achieve partial success. There is, therefore, a need for an index to rate diagnostic tests in an objective manner and to provide a means of deciding whether two diagnostic tests really differ in their capacity to discriminate between healthy and diseased individuals. Diagnostic tests undergo modifications in attempts to improve their performance. The medical researcher needs a statistical tool to assist him in detecting as early as possible whether a particular modification has led to an improvement in the results obtained with the diagnostic test. There are two questions that arise in appraising a diagnostic test to which it is not possible to give completely satisfactory answers. First, whenever a diagnostic test is subjected to study, the question arises as to how sure the experimenter can be that his controls are really healthy and that all his From the National Bureau of Standards, Washington, D.C. Received for publication, November 10, 1949. diseased patients actually have the disease. The latter part of the question is usually met by using advanced cases in which the disease has been demonstrated to be present. T h e controls are often simply young, available, and assumed-to-be-healthy individuals. The unsuspected presence of the disease in a control is probably not as serious as the contrast between the two groups in other respects, chiefly, of course, in age. If the diagnostic test is in some way responsive to age, then the results may be due to age differences and not to the absence or presence of the disease. There is no statistical protection against this confounding of causes other than to ensure that the control group resembles the diseased group as closely as possible in all respects save the presence of the disease. The other question has to do with the relative seriousness of the two types of error a diagnostic test may make: false positives and false negatives. There is usually an instinctive reaction against a test that is subject to false negatives, since presumably these individuals are lost if treatment is deferred until too late. O n the other hand, false positives exact a price, quite aside from the unpleasant shock to the individuals concerned. If, as a result of false positives, the limited facilities for treatment are expended upon individuals who do not need treatment, then the efficiency of the use of the facilities is lowercd. Put another way, a test that never gives a false positive means that available facilities are used at maximum efficiency and therefore with best over-all consequences to the population as a whole. I t is, in fact, not a statistical matter to decide what weights should be attached to these two types of diagnostic error. T h e purpose of an index of performance is to reduce a table of data, like that just given, into one figure that will adequately characterize the diagnostic test. An index, apparently not previously employed, can be derived by the argument given in the next paragraph. c321 Youden INDEX FOR RATING DIAGNOSTIC TESTS The proportion of diseased individuals correctly classified is a/a+b. I t seems appropriate to charge against this the proportion, b/a +b, incorrectly classified, leava-b ing ___ as a measure of the success of' the a+b test on the diseased group. As further evidence that this is a reasonable measure, note that, if a =b, or in other words if the test is equally likely to report a diseased individual negative as positive, it has no discriminative power on the diseased group. A similar argument for d-c the control group gives -as a measure of c+d success with that group. Let the average of these two be taken as the index. This assumes false positives to be as undesirable as false negatives. J=+[-+-] a-b a+b d-c c+d c33 Group Diagnosis + - +- 40 8 Total 10 2 50 10 3. The index becomes unity only when both false positives and false negatives are not present. If only one type of error is made, the index is controlled by that error. Group Diagnosis + - +- Total 50 0 10 40 50 50 d -- a -a+b+c+d-' The index, J, is seen to be also equal to the sum, diminished by unity, of the two fractions showing the proportions correctly diagnosed for the diseased and control groups. The expression may also be written as a fraction in which the numerator is made up of the product of the numbers correctly diagnosed diminished by the product of the numbers incorrectly classified. The denominator is the product of the totals in the diseased and control groups. 'This index has certain desirable features.* 1. The possible range of values for the index is from zero to one inclusive. (It is expected that the test will show a greater proportion of positive results for the diseased group than for the control.) 2. The index has the value zero whenever a diagnostic test gives the same proportion of positives for both diseased and control groups regardless of what that proportion is. Such a test is obviously worthless. *These include those listed bv M. G. Kendall: The Advanced Theory of Statist&. London. Charles Griffin and Co., Ltd. 194'7; Vol. I, p. 310. 4. The index is independent of the relative sizes of the control and diseased groups. __ Group Diag. Total Group + +J= 90 10 Diag. Total + - 10 40 100 50 3600-100 =o.70 5000 +- 9 10 1 1 0 40 50 360-10 J =~0.70 500 5. The index is independent of the absolute sizes of the control and diseased groups. Group Diag. Total -__ Group + + - 23 1 2 9 J=-207-220.82 250 Diag. Total + 25 10 + - 230 10 20 90 250 100 20700-200J =--0.82 25000 6. All tests that have the same index make the same total number of misclassifications per hundred patients (figured separately for diseased and control groups). 341 CANCER Group Diag. Total Misclassifi- Total cations per Index + - ~. + - January 1950 loo+ 100- 0 50 15 35 50 1750 o.70 2500 SO 0 -= 30 30 Group Diag. Total + + - 80 20100 7200-200=0~70 20 10 90100 10000 10 30 the groups are not too small (20 or more), and the index not close to zero or one, the binomial distribution approximates the normal distribution and the usual procedures are employed for setting up confidence limits, The following data* were obtained with a proposed diagnostic test for cancer and with a modified version of the test. __ Group + - - 1 0 1 30 70100 -= 70 100 0 0.70 30 30 +- 7. It is possible to calculate a standard error for the index. Naturally, the larger the groups, the more reliable, in the sense of being free from random sampling variation, is the experimental value of the index. Any index is incomplete unless there is also available some means of setting up confidence limits for the estimate of the index. The index, when written in the form a d f-a + b c+d J=- 1 is seen to be, apart from the constant, the sum of two fractions that refer to the proportions correctly diagnosed for the diseased and control groups. These proportions are properties of a diagnostic test. A D represent the true If A+B and _ C+D _ proportions, then the standard errors of estimates of the proportions are respectively ’ CD dT+ AB (A+B) 95 75 CD m‘ In practice, the data available from the study of a test are used as an estimate of the true proportions. So long as the numbers in 6 33 Diag. Group + - __ + 101 108 Total -_ 40 7 _ 11 23 . ~ 51 30 3135-450=0,246 10908 S.E.j S.E.j 570 2475 1030 30 1 ‘1259712 = -\/.OOOSS3+.001965 = -\/.003317+.005963 = -\//.oozsls0.050 = -\/.009280 95’%con- 0.148-0.344 fidence interval =0.0963 0.362-0.740 T o obtain 95 per cent confidence intervals for the indexes twice (more accurately 1.96), the standard error is added and subtracted from the index. The intervals do not overlap, so that we may conclude that the improvement in the index shown by the modified test is a real effect. The proper way to compare two indexes is by means of the 1 test. 1= (The standard error of an observed proportion, p, binomially distributed, is dP(1 -P)/N ). The standard error of their sum, and consequently of the index “J” is = Total _ J= S.E.., Diag. + - Group Diag. Total + MODIFIED TEST ORIGINAL TEST difference between indexes S.E. of their difference - 0.551 -0.246 0.109 - 0.305 0.109=2’80 where S.E. d , ( f = .\i(S.E.),’+(S.E.),z = 1/.002518+.009280 =.\/.011798 =0.109 The 5 per cent value for t is 1.96, the 1 per cent value is 2.58. Since the value of t for these indexes is 2.80, the difference between *Courtesy of Dr. F. Homburger, Tufts College Medical School. See Evaluation of Diagnostic Tests for Cancer. 111. pp. 15-25, this issue of CANCER. INDEX FOR RATING DIAGNOSTIC TESTS them is said to be significant at the 1 per cent level, meaning that there is less than one chance in a hundred that a difference as large as this would have been found if the two tests were in reality equally effective. The formula given for the standard error of the index is not suitable for use with small numbers, say when there are fewer than 20 in a group. With small numbers, the standard error will be very large, and special statistical procedures are required to compare two diagnostic tests. SUMMARY In summary, the paper proposes a new index for measuring the performance of diagnostic tests. Diagnostic tests have the task of correctly designating which are the diseased individuals in a population. These tests may err in giving negative tests for Youden [35 diseased individuals (false negatives) and in giving positive tests for healthy individuals (false positives). The formula for the index of performance is where, of (a+b) diseased patients, “a” are correctly diagnosed and “b” are false negatives, and where of (c+d) controls, “d” are correctly reported and “c” are false positives. The index has the value zero if the test reports the same proportion of positive tests for both control and diseased groups. It has the value unity when, and only when, there are neither false positives nor false negatives resulting from the test. The difference hetween two diagnostic tests may be evaluated by means of the standard errors of the indexes.

