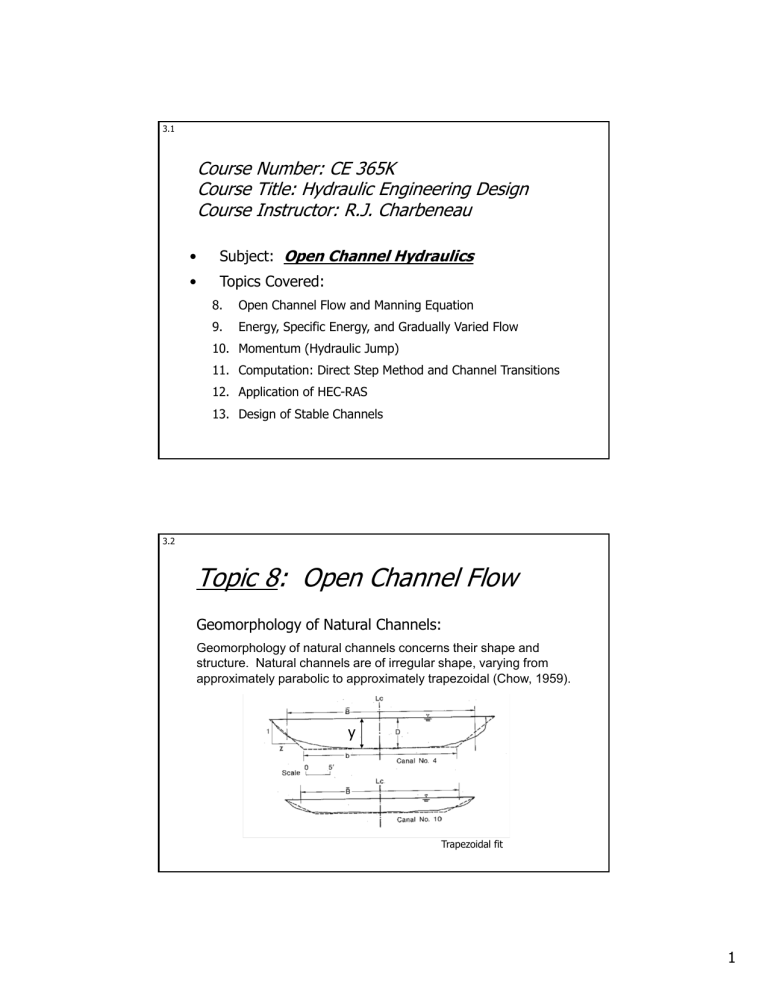
3.1 Course Number: CE 365K Course Title: Hydraulic Engineering Design Course Instructor: R.J. Charbeneau • Subject: Open Channel Hydraulics • Topics Covered: 8. Open Channel Flow and Manning Equation 9. Energy, Specific Energy, and Gradually Varied Flow 10. Momentum (Hydraulic Jump) 11. Computation: Direct Step Method and Channel Transitions 12. Application of HEC-RAS 13. Design of Stable Channels 3.2 Topic 8: Open Channel Flow Geomorphology of Natural Channels: Geomorphology of natural channels concerns their shape and structure. Natural channels are of irregular shape, varying from approximately parabolic to approximately trapezoidal (Chow, 1959). y Trapezoidal fit 1 3.3 Channel Geometry Characteristics • • • • Depth, y Area, A Wetted perimeter, P Top width, T Hydraulic Radius, Rh = Area / Wetted perimeter Hydraulic Depth, Dh = Area / Top width 3.4 Trapezoidal Channel 2 3.5 Parabolic Channel z If 0 < (4 a y) 1/2 < 1 Then 3.6 Example #12: Parabolic Channel A grassy swale with parabolic cross-section shape has top width T = 6 m when depth y = 0.6 m while carrying stormwater runoff. What is the hydraulic radius? 3 3.7 Flow in Open Channels: Manning Equation Manning’s equation is used to relate the average channel (conduit) velocity to energy loss, Sf = hf/L. Manning equation (metric units: m, s) UNITS ?!!? Does “n” have units? Tabulated values? 3.8 Manning Equation (Cont.) To change to US Customary units multiply by General case = 1 (metric) or 1.486 (English) 4 3.9 Channel Conveyance, K For Manning’s equation, K combines roughness and geometric characteristics of the channel K = (/n) A Rh2/3 Manning’s equation: Q = K Sf1/2 3.10 Roughness and Manning’s n Equivalence between roughness size (k) and Manning’s n: n = 0.034 k 1/6 (k in ft) Strickler (1923) Examples n k (cm) Concrete (finished) 0.012 0.06 Asphalt 0.016 0.3 Earth channel (gravel) 0.025 5 Natural channel (clean) 0.030 15 Floodplain (light brush) 0.050 300 * Compare with Manning’s n for sheet flow 5 3.11 Grassed Channels Vegetal Retardance Class (Table 8.4) SCS (after Chow, 1959) English Units (ft, s) , V Rh Figure 8.11, page 311 3.12 Example #13: Estimate the channel discharge capacity for So = 0.008 Drainage channel from Far West Pond 6 3.13 Example #13: Qmax (cfs) = 1. For grass channels, use Slide 3.11. Guess an initial value n = 0.05 2. Geometry: Bottom width, b = 5 ft (~) Side slope (z:1), z = 2 Q = 240 ft3/s Maximum depth, y = 4 ft --------------------------------------Hydraulic radius, Rh = 2.3 ft Velocity, V = 4.6 ft/s V Rh = 10.6 ft2/s 3.14 Example #13 (Cont.) V Rh > 10 ft2/s n = 0.03 (slide 3.11) Qmax = 400 cfs 7 3.15 Normal Depth Normal depth is the depth of uniform flow in an prismatic open channel. Since the flow is uniform, the depth and discharge are related through Manning’s equation with Sf = So. Given Q, n, A(y), Rh(y) and So: solve for yn 3.16 Waves (Small Disturbances) in a Moving Stream V y c Wave (disturbance) can move upstream if Froude Number 8 3.17 Critical Depth – Froude number Critical flow occurs when the velocity of water is the same as the speed at which disturbances of the free surface will move through shallow water. The speed or celerity of disturbances in shallow water is given by c = (g Dh)1/2, where Dh is the hydraulic depth. Critical flow occurs when v = c, or more generally Importantly, critical depth is independent of the channel slope. 3.18 Topic 9: Energy, Specific Energy, and Gradually Varied Flow 1D Energy Equation: Closed Conduit: Open Channel Flow: zB z hereafter 9 3.19 Energy in Open Channels Friction Slope: =H Sf = - dH/dx Channel Slope: x Kinetic Energy Correction Factor So = - dz/dx Specific Energy 3.20 What do we do with ? • For simple channels assume = 1 • For complex channels (main channel plus left and right-bank floodplains), velocity variation at a given station can be significant, and should be calculated and used in a 1D energy equation (HEC-RAS does this automatically!) 10 3.21 Kinetic Energy Coefficient, 1 Left Overbank 2 3 Main Channel A1, P1, n1 Right Overbank A3, P3, n3 A2, P2, n2 3.22 Specific Energy, E Hydraulic energy head measured with respect to the local channel bottom, as a function of depth y y For fixed Q Alternate depths E 11 3.23 Specific Energy at Critical Flow Rectangular channel: Dh = y E = V2/2g + y = [(1/2) (V2/gy) + 1] y = (1/2 + 1) y Froude Number For critical flow (in a rectangular channel): y = (2/3) E V2/2g = (1/3) E 3.24 Energy Equation E2 + z2 = E1 + z1 + hL(2 1) E = Specific Energy = y + V2/2g Head Loss: • Major Losses – friction losses along channel • Minor Losses – channel expansion and contraction 12 3.25 Friction Losses in Open Channel Flow: Slope of the EGL: Sf = hf / L Manning’s equation: Q = K Sf1/2 Bed-friction head loss: hf = (Q/K)2 L 3.26 Minor (Expansion and Contraction) Losses Energy losses at channel expansions and contractions Default values: Channel Contraction Channel Expansion - C = 0.1 C = 0.3 Abrupt Expansion: (C = 1) 13 3.27 Gradually Varied Flow Profiles Physical laws governing the head variation in open channel flow 1) Gravity (So) is the driving force for flow 2) If So = Sf then dE/dx = 0 and flow is uniform (normal depth) 3) Gravity (So) is balanced by friction resistance (Sf ) and longitudinal adjustment in specific energy (dE/dx) 4) Adjustments in specific energy are constrained through specific energy diagram 3.28 Gradually Varied Flow: Mild Slope (yn > yc) 1. Point 1 (M1 Curve): y > yn Sf < So dE/dx > 0 depth increases downstream 2. Point 2 (M2 Curve): y < yn Sf > So dE/dx < 0 depth decreases downstream y 3. Point 3 (M3 Curve): y < yc < yn Sf > So dE/dx < 0 depth increases downstream yn 1 2 yc 3 For fixed Q E 14 3.29 Mild Slope Note that for the M1 and M2 curves, the depth approaches normal depth in the direction of flow computation for subcritical flow. 3.30 Gradually Varied Flow: Steep Slope (yn < yc) 1. Point 1 (S1 Curve): y > yc > yn Sf < So dE/dx > 0 depth increases downstream 2. Point 2 (S2 Curve): y > yn Sf < So dE/dx > 0 depth decreases downstream 3. Point 3 (S3 Curve): y < yn Sf > So dE/dx < 0 depth increases downstream y For fixed Q 1 yc yn 2 3 E 15 3.31 Steep Slope Note that for curves S2 and S3 the depth approaches normal depth in the direction for flow computation for supercritical flow 3.32 Horizontal Slope (So = 0) y 2 yc 3 E 16 3.33 Topic 10: Momentum and Hydraulic Jump yp = depth to pressure center (X-section centroid) FB v1 v2 Momentum Equation: F = Q (V2 – V1) yp1 A1 – yp2 A2 – FB = Q2 (1/A2 – 1/A1) Write as: M1 = M2 + FB/ Specific Force: M = yp A + Q2/(g A) 3.34 Hydraulic Jump y 2 Sequent depths (Conjugate) 1 Specific force, M 17 3.35 Energy Loss and Length y2 yj y1 Lj Energy Loss: Rectangular Channel Exercise: convince yourself that this is the same as E = E1 – E2. Lj Jump Length: Lj = 6.9 yj = 6.9 (y2 – y1) yj 3.36 Example #14: Normal depth downstream in a trapezoidal channel is 1.795 m when the discharge is 15 m3/s. What is the upstream sequent depth? Answer: 1.065 m How do you find the energy loss? E = 0.14 m Power = 20.6 kW 18 3.37 Topic 11: Direct Step Method and Channel Transitions Returning to the Energy Equation Step calculation Solve for x: 3.38 Direct Step Method: Approach In this case you select a sequence of depths and solve for the distance between them: y1, y2, y3, … • With known y: E1, E2, Q2/2gA2, etc. are calculated • The average friction slope is calculated from 19 3.39 Example #15: Channel Transition What is the headwater upstream of a control section in a downstream box culvert: Q = 10 m3/s; channel n = 0.025 Headwater = ? z1 = 1 Control section – Fr = 1 5m b2 = 2.5 m b1 = 2 m upstream downstream Control Section: V = (g Dh)0.5 = (g y)0.5 Q = (g y)0.5 (b y) y = [Q / b g0.5]2/3 = 1.37 m 3.40 Example #15 (Cont.): Specific Energy A 1.37 m depth in the upstream channel (Section 1, blue) corresponds to specific energy E = 1.55 m, compared with E = 2.05 m in the control section. The upstream E2 must exceed 2.05 m, which requires an increase in depth. 20 3.41 Example #15 (Cont.): Direct Step Method Assume a 5-m long transition section. Adjust depth until x = 5 m y2 = 2.051 m Resulting upstream specific energy is E2 = 2.110 m. Contraction losses at entrance ~ 6 cm Friction losses in transition section ~ 1 cm 3.42 Example #16: Specific Energy and Channel Transitions • Trapezoidal channel with b = 8 ft, z = 2, n = 0.030. Normal depth occurs upstream and downstream. • Rectangular culvert (b = 5 ft, n = 0.012) added with concrete apron extending 10 feet downstream from culvert outlet. • Develop flow profile, especially downstream of the culvert, for Q = 250 cfs. 21 3.43 Ex. #16 (Cont.): Normal and Critical Depth in Main Channel Upstream and Downstream channel have yn = 3.13 ft yc = 2.51 ft yn > yc Mild Slope Downstream Control 3.44 Ex. # 16 (Cont.): Normal and Critical Depth in Culvert yn = 4.22 ft yc = 4.26 ft yn < yc Steep Slope Upstream control 22 3.45 Ex. #16 (Cont.): Specific Energy Diagram Normal depth: E = 3.13 ft Minimum specific energy in culvert: E = 6.40 ft To enter the culvert from upstream, specific energy increased through M1 curve Normal depth upstream and downstream Culvert 1 Channel (Culvert as “choke”) 3.46 Ex. #16 (Cont.) Upstream Transition and Entry to Culvert Trapezoidal Channel M1 Curve Headwater = 6.51 ft Culvert 2 M1 curve Control in culvert 1 Channel 23 3.47 Ex. #16 (Cont.): Control in Culvert yn < yc Steep Slope Control at Culvert Entrance S2 curve in culvert; normal depth reached before culvert end 3.48 Ex. #16 (Cont.): Possible Depths at Concrete Apron Set y2 = yn in culvert and adjust y1 = ya until x = 10 ft for depth at end of concrete apron Possible depths for ya = 1.389 ft or 5.74 ft 24 3.49 Ex. #16 (Cont.): Which Depth for ya? How do you determine which depth at the end of the culvert apron is correct? The flow profile downstream of the apron must follow an M-curve (since yc < yn in the downstream channel) and the depth must end in normal depth. Normal depth is yn = 3.13 ft while ya = 1.39 ft or 5.74 ft. Cannot reach normal depth from y = 5.74 ft following an M1 curve. Correct depth is ya = 1.39 ft, which will follow an M3 curve leading to a hydraulic jump, which must end at normal depth (no M-curves approach normal depth in the downstream direction). 3.50 Ex. #16 (Cont.): Transition to Apron (Pt. 5) End of culvert apron at Pt. 5. M3 Curve leading to Hydraulic Jump, which in turn exits at normal depth for the downstream channel Culvert 2 M1 curve 3 Control in culvert 4 1 5 S2 curve Channel 25 3.51 Ex. #16 (Cont.): M3 Profile to Hydraulic Jump • How far does the flow profile follow the M3 curve downstream of the concrete apron? • From this supercritical flow profile, the flow must reach subcritical flow at normal depth through a hydraulic jump. • The flow profile must follow the M3 curve until the depth is appropriate for the jump to reach yn (this is the sequent depth to yn). 3.52 Ex. #16 (Cont.): Estimation of Sequent Depth Plot y versus specific force values. For y = 3.13 ft, the specific force (M) value is 103.1 ft3. Look for the sequent depth on the supercritical limb of the specific-force curve, to find ys = 1.97 feet. Conclusion: the M3 curve is followed from a depth of ya = 1.39 ft to a depth of ys = 1.97 ft, which marks the entry to a hydraulic jump. Sequent Depths 26 3.53 Ex. #16 (Cont.): Distance along M3 Curve and Jump Length The Direct Step method may be used to estimate the distance along the M3-curve from the culvert apron to the entrance of the hydraulic jump. Taking a single step, this distance is estimated to be 44 feet. The jump length is calculated as Lj = 6.9 (3.13 – 1.97) = 8 ft 3.54 Ex. #16 (Cont.): Transition Example 1 Upstream normal 2 Upstream culvert 3 Culvert entrance (control) Culvert 2 4 Culvert exit 5 Culvert apron 6 Jump upstream 7 Jump downstream (normal depth) M1 curve 3 1 7 Jump 6 Control in culvert 4 M3 curve 5 S2 curve Channel 27 3.55 Ex. #16 (Cont.): Hydraulic Profile of Channel Transition 3.56 Ex. #16 (Cont.): Energy Loss through Jump E2 + z2 = E1 + z1 + hL(2 1) hL = Eu – Ed + zu – zd = Eu – Ed + So x hL = 3.724 – 3.62 + 0.005 x 8 = 0.144 ft Very weak hydraulic jump 28 3.57 Ex. #16 (Cont.): Discussion • Tired yet?? • Advantages of hand/spreadsheet calculation include control of each step in calculations • Disadvantages include 1) tedious, and 2) requires some level of expert knowledge • Alternatives? Computer application using HEC-RAS (River Analysis System) 3.58 Topic 12: Solve Energy (and Momentum) Equations Using HEC-RAS E2 + z2 = E1 + z1 + hL(2 1) E = Specific Energy = y + v2/2g Head Loss: • Major Losses – friction losses along channel • Minor Losses – channel expansion and contraction 29 3.59 Computation Problem For subcritical flow, compute from downstream to upstream. Discharge may vary from station to station, but are assumed known. The depth, area, etc. at station 1 (downstream) are known. Energy Equation: WS = Water Surface = y + z Unknowns at Station 2: WS, A, K, (Rh) This is what HEC-RAS does. 3.60 Compound Channel Section For one-dimensional flow modeling, the slope of the EGL is uniform across the channel section 1 Left Overbank 2 Main Channel A1, P1, n1 3 Right Overbank A3, P3, n3 A2, P2, n2 Thus 30 3.61 Example # 17: Same problem (Ex. #16) using HEC-RAS • • • • • 3.62 Create a Project Enter “Reach” on Geometric Data Enter X-Section information for stations Enter Discharge and Boundary Conditions Compute Ex. #17 (Cont.): Simple Run on Straight Channel Entry Data: Q = 250 cfs BC: Normal depth downstream with So = 0.005 Conclusion: HEC-RAS correctly computes normal depth yn 31 3.63 Ex. #17 (Cont.): Add X-Section Data for Culvert 3.64 Ex. #17 (Cont.): Compute for channel with culvert section Headwater = 6.51 ft Tailwater = 3.13 ft Depth = 6.51 ft Conclusion: Headwater correctly calculated but tailwater uniform at normal depth need more X-sections 32 3.65 Ex. #17 (Cont.): Add X-sections and Compute Need to change computation method to “mixed flow” 3.66 Ex. #17 (Cont.): Results - 1 6.51’ 3.13’ 4.26’ 1.77’ 1.34’ 4.28’ Culvert 33 3.67 Ex. #17 (Cont.): Results - 2 Bed Shear Stress is Important in assessing channel stability to erosion End of Jump High Erosion Potential Culvert 3.68 Ex. #17 (Cont.): Discussion • Hand/Spreadsheet calculation and HECRAS calculation give equivalent results • Both are a “pain” (1st for computation and 2nd for set-up) • Life as a Hydraulic Engineer is a “pain” • HEC-RAS CAN SIMULATE FLOWS IN COMPLEX CHANNELS THAT CONNOT BE ADDRESSED THROUGH SIMPLE ALTERNATIVES 34 3.69 Topic 13: Design of Stable Channels • A stable channel is an unlined channel that will carry water with banks and bed that are not scoured objectionably, and within which objectionable deposition of sediment will not occur (Lane, 1955). • Objective: Design stable channels with earth, grass and riprap channel lining under design flow conditions 3.70 (Two) Methods of Approach • Maximum Permissible Velocity – maximum mean velocity of a channel that will not cause erosion of the channel boundary. • Critical Shear Stress – critical value of the bed and side channel shear stress at which sediment will initiate movement. This is the condition of incipient motion. Following the work of Lane (1955), this latter method is recommended for design of erodible channels, though both methods are still used. 35 3.71 Bed Shear Stress Force balance in downstream direction: p1 w y – p2 w y + w g w y L sin() – w L = 0 = w g y sin() = w y So 3.72 Bed Shear Stress – Balance Between Gravity and Bed Shear Forces o P L = w A L sin() L Bed o shear stress o = w Rh S A P Wetted perimeter w A L sin() Gravity force 36 3.73 Calculation of Local Bed Shear Stress Uniform Flow: o = Rh S Local Bed Shear Stress: y Sf Manning Equation: Sf = V2 n2/(2 y4/3) Result: o = V2 n2/(2 y1/3) 3.74 Distribution of Tractive Force • Varies with side slope, channel width, and location around the channel perimeter • Following criteria for trapezoidal channels (Lane, 1955) Channel bottom - (o)max = w y So Channel sides - (o)max = 0.75 w y So (See Figure 8.6, page 303) 37 3.75 Maximum Permissible Velocity – Unlined (Earth-lined) Channel WB Table 9.1 (Fortier and Scobey, 1926) For well-seasoned channels of small slopes and for depths of flow less than 3 ft. Tractive force calculated from o = 30 n2 V2. 4.76 Example #18: Unlined Channel An earthen channel is to be excavated in a soil that consists of colloidal graded silts to cobbles. The channel is trapezoidal with side slope 2:1 and bottom slope 0.0016. If the design discharge is 400 cfs, determine the size for an unlined channel using the maximum permissible velocity. From the table we have V = 4 ft/s and n = 0.030. Required channel cross-section area: A = Q/V = 100 ft2 Manning equation to find hydraulic radius: Wetted perimeter: P = A/Rh = 100/2.87 = 34.8 ft 38 3.77 Example #18 (Cont.) Trapezoidal Channel: Combine into the quadratic equation (eliminating b) Solution: 3.78 Example #18 (Cont.) For this problem Channel base width (use y = 4 ft since y = 10 ft gives negative b) Bed shear stress Note: small velocity values are required for stable unlined channels 39 3.79 Grassed Channels Vegetal Retardance (Table 9.2) SCS (after Chow, 1959) , v Rh WB, Figure 9.3, page 332 3.80 Grassed Channels Permissible Velocities for Channels Lined with Grass (SCS, 1941) WB, Table 9.3 (from Chow, 1959) 40 3.81 Movement of Sediment – Incipient Motion Coefficient of Friction = Angle of Repose Sliding Downhill – F = 0 Force F necessary to move object 3.82 Application to Incipient Motion Shield’s Number, Sh The Shield’s number is analogous to the angle of internal friction 41 3.83 Shield’s Curve – Sh(Re*) o, d, , = Sh Sh depends on Shear Reynolds Motion number: No Motion 3.84 Shield’s Number, Sh The Shield’s parameter Sh As long as Sh < Shcritical (found from Shield’s Curve), there will be no motion of bed material Mobility of bed material depends on particle diameter and weight (specific gravity), and on channel flow depth (hydraulic radius) and slope 42 3.85 Design of Riprap Lining For Re* > 10, the critical Shield’s number satisfies For problems in Stormwater Management, Re* is very large (1000’s) and Shcritical = 0.06. For design purposes, a value Shc = 0.05 or 0.04 is often selected. Increased bed material size (riprap) results in decreased Sh (improved bed stability) but increases bed roughness (Manning’s n) 3.86 Design of Riprap Lining An approach to design of stable channels using riprap lining: 1. For specified discharge, channel slope and geometry, select a test median particle diameter d50 (the designation d50 means that 50 percent of the bed material has a smaller diameter) 2. Use Strickler’s equation to relate material size to Manning’s n: n = 0.034 d501/6 3. Use Manning’s equation to find the depth and Rh 4. Check bed stability using Shield’s curve 43 3.87 Example #19: Riprap Lining What size riprap is required for a channel carrying a discharge Q = 2,500 ft3/s on a slope So = 0.008. The channel has trapezoidal cross section with bottom width b = 25 ft and side slope z:1 = 3:1? Solution: 1. Select d50 = 3 inches (0.25 ft). 2. n = 0.034 (0.25)1/6 = 0.0270 3. For the discharge and slope, Manning’s equation gives y = 5.24 ft; Rh = 3.67 ft. 4. These values give Sh = 3.67 x 0.008/(1.65 x 0.25) = 0.071; Re* = (g Rh So)1/2 d50/ = (32.2 x 3.67 x 0.008)1/2 x 0.25/10-5 = 24,000. From the Shield’s curve, Sh > Shc, and the bed will erode. 3.88 Ex. #19 (Cont.): Riprap Lining 2.1 Try d50 = 6 inches (0.5 ft) 2.2 n = 0.034 (0.5)1/6 = 0.0303 2.3 From Manning’s equation, y = 5.56 ft; Rh = 3.85 ft 2.4 Sh = 0.037, Re* = 50,000 OK 3.1 Try d50 = 4 inches Channel Hydraulics.xls Check values here Enter d50 44 3.89 Design of Channel Lining Permissible Shear Stress for Lining Materials (US DOT, 1967) For Riprap Lining: Recommended Grading – allows voids between larger rocks to be filled with smaller rocks (Simons and Senturk, 1992) d20 = 0.5 d50 d100 = 2 d50 45

