Juan Esteban Salcedo Garavito, Alejandra Ramos
Sumas de Riemann - Aproximación Valor Integral Definida
In[30]:=
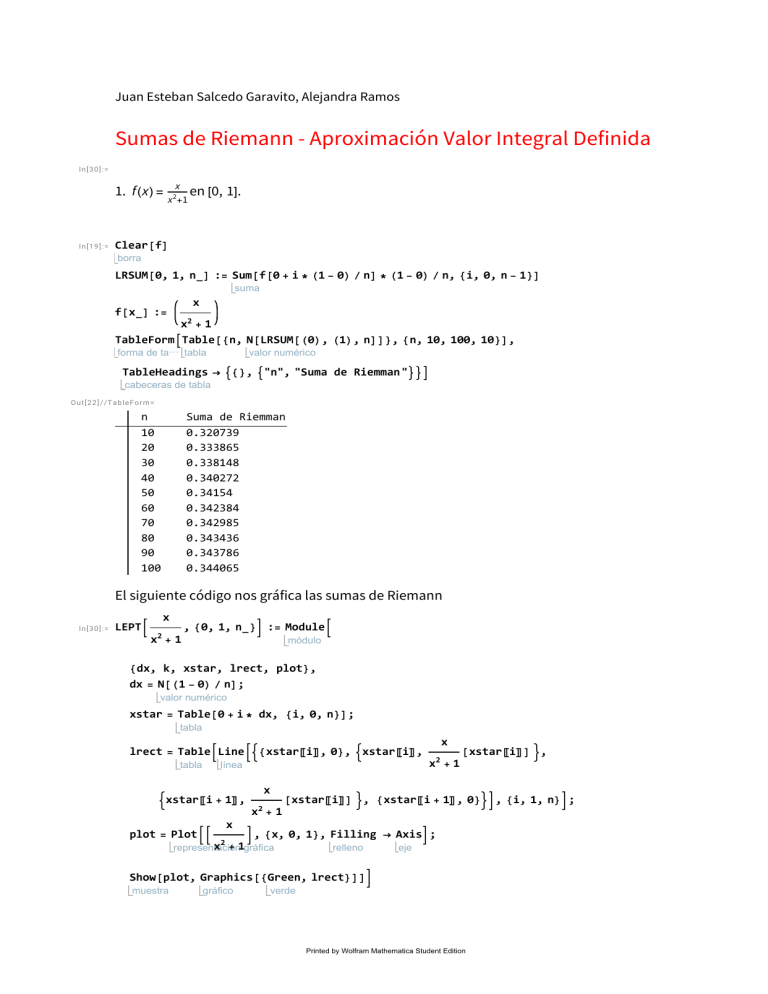
1. f (x ) =
In[19]:=
x
en [0,
x 2 +1
1].
Clear[f]
borra
LRSUM[0, 1, n_] := Sum[f[0 + i * (1 - 0) / n] * (1 - 0) / n, {i, 0, n - 1}]
suma
x
f[x_] :=
x2 + 1
TableFormTable[{n, N[LRSUM[(0), (1), n]]}, {n, 10, 100, 10}],
forma de ta⋯ tabla
valor numérico
TableHeadings {}, "n", "Suma de Riemman "
cabeceras de tabla
Out[22]//TableForm=
n
10
20
30
40
50
60
70
80
90
100
Suma de Riemman
0.320739
0.333865
0.338148
0.340272
0.34154
0.342384
0.342985
0.343436
0.343786
0.344065
El siguiente código nos gráfica las sumas de Riemann
In[30]:=
LEPT
x
x2 + 1
, {0, 1, n_} := Module
módulo
{dx, k, xstar, lrect, plot},
dx = N[(1 - 0) / n];
valor numérico
xstar = Table[0 + i * dx, {i, 0, n}];
tabla
lrect = TableLine{xstar〚i〛, 0}, xstar〚i〛,
tabla
línea
xstar〚i + 1〛,
x
x
[xstar〚i〛] ,
x2 + 1
[xstar〚i〛] , {xstar〚i + 1〛, 0}, {i, 1, n};
2
x +1
plot = Plot
x
2
, {x, 0, 1}, Filling Axis;
x + 1gráfica
representación
relleno
eje
Show[plot, Graphics[{Green, lrect}]]
muestra
gráfico
verde
Printed by Wolfram Mathematica Student Edition
2
TALLER WOLFRAM GRUPO 9.nb
El siguiente código nos genera un aplicativo dinámico de las Sumas de Riemann con
parámetro el número de subdivisiones
In[52]:=
ManipulateLEPT
manipula
x
2
, {0, 1, n} , {n, 1, 50, 5 }
x +1
Out[52]=
n
0.5
0.4
0.3
0.2
0.1
0.2
0.4
0.6
0.8
1.0
2. f (x ) = sin x en [0, π].
l siguiente código nos genera una tabla de valores que corresponden a las Sumas de Riemann
de una función f en cierto intervalo para valores de n desde 10 hasta 100 en intervalos de 10
unidades.
Printed by Wolfram Mathematica Student Edition
TALLER WOLFRAM GRUPO 9.nb
In[31]:=
Clear[f]
borra
LRSUM[0, π, n_] := Sum[f[0 + i * (1 - 0) / n] * (1 - 0) / n, {i, 0, n - 1}]
suma
f[x_] := (sin x)
TableFormTable[{n, N[LRSUM[(0), (π), n]]}, {n, 10, 100, 10}],
forma de ta⋯ tabla
valor numérico
TableHeadings {}, "n", "Suma de Riemman "
cabeceras de tabla
Out[34]//TableForm=
n
10
20
30
40
50
60
70
80
90
100
Suma de Riemman
0.45 sin
0.475 sin
0.483333 sin
0.4875 sin
0.49 sin
0.491667 sin
0.492857 sin
0.49375 sin
0.494444 sin
0.495 sin
El siguiente código nos gráfica las sumas de Riemann
LEPT[f_, {a_, b_, n_}] := Module[
módulo
{dx, k, xstar, lrect, plot},
dx = N[(b - a) / n];
valor numérico
xstar = Table[a + i * dx, {i, 0, n}];
tabla
lrect = Table[Line[{{xstar〚i〛, 0}, {xstar〚i〛, f[xstar〚i〛] },
tabla
línea
{xstar〚i + 1〛, f[xstar〚i〛] }, {xstar〚i + 1〛, 0}}], {i, 1, n}];
plot = Plot[f[x], {x, a, b}, Filling Axis];
representación gráfica
relleno
eje
Show[plot, Graphics[{Green, lrect}]]]
muestra
gráfico
verde
El siguiente código nos genera un aplicativo dinámico de las Sumas de Riemann con
parámetro el número de subdivisiones
In[53]:=
Manipulate[LEPT[sin x, 0, π, n] , {n, 1, 50, 5 }]
manipula
Printed by Wolfram Mathematica Student Edition
3
4
TALLER WOLFRAM GRUPO 9.nb
n
LEPT[sin x, 0, π, 1]
Integral Definida
1
1 - x2 x
1. ∫0
1
In[55]:=
1 - x2 x
0
Out[55]=
π
4
2. ∫-π sin 2 x x
π
π
In[63]:=
2
(Sin[x]) x
-π
Out[63]=
π
3
3. ∫0 x 3 - 4 x 2 + x d x
3
In[58]:=
3
2
x - 4 x + x x
0
Out[58]=
-
45
4
4. ∫1 4
1
4
In[59]:=
1
x
1
+2
x dx
+2
x
x
x
Out[59]=
34
3
π
5. ∫0 4 sec x d x
π
In[64]:=
4
Sec [x] x
0
secante
Out[64]=
π
2 ArcTanhTan
8
Printed by Wolfram Mathematica Student Edition
TALLER WOLFRAM GRUPO 9.nb
2
2
6. ∫0 4
1-4 x 2
2
In[65]:=
dx
2
4
0
x
1 - 4 x2
Out[65]=
π
4
7. ∫0
3
In[66]:=
3 1
x +1
1
x+1
0
dx
x
Out[66]=
Log[4]
8. ∫1 4 x1 + 2 x 2 d x
4
In[67]:=
1
x
1
+ 2 x2 x
Out[67]=
42 + Log[4]
9. ∫0 π ex sin x d x
π
In[68]:=
x
Sin[x] x
0
seno
Out[68]=
1
(1 + π )
2
Cálculo de Áreas entre curvas
Calcular el área acotada por las funciones f(x)=x 2 +1
y g(x)=x+3.
Printed by Wolfram Mathematica Student Edition
5
6
TALLER WOLFRAM GRUPO 9.nb
In[71]:=
Plotx2 + 1, x + 3, {x, - 1, 2}, PlotStyle {yellow, green},
representación gráfica
estilo de representación
PlotRange {- 2, 8}, Filling {1 {2}}, PlotLegends {"f(x)", "g(x)"}
rango de representación
relleno
leyendas de representación
Out[71]=
8
6
4
f(x)
g(x)
2
-1.0
0.5
-0.5
1.0
1.5
2.0
-2
Podemos calcular los puntos de corte.
In[74]:=
Solvex2 + 1 x + 3
resuelve
Out[74]=
{{x - 1}, {x 2}}
Cálculo formal del área de la región.
2
In[73]:=
((x + 3) - (x ^ 2 + 1)) x
-1
Out[73]=
9
2
Ejercicios
Visualizar, sombrear y calcular el área acotada por las funciones que se indican.
1. y = sin x y y = sin (2 x ) entre x = 0 y x = π .
Calcular el área acotada por las funciones
Printed by Wolfram Mathematica Student Edition
TALLER WOLFRAM GRUPO 9.nb
In[82]:=
Plot[{Sin[x], Sin[2 x]}, {x, 0, π}, PlotStyle {Golden, yellow},
repre⋯ seno
seno
estilo de representación
PlotRange {- 2, 8}, Filling {1 {2}}, PlotLegends {"f(x)", "g(x)"}]
rango de representación
relleno
leyendas de representación
Out[82]=
8
6
4
f(x)
g(x)
2
0.5
1.0
1.5
2.0
2.5
3.0
-2
Podemos calcular los puntos de corte.
In[77]:=
Solve[Sin[x] Sin[2 x], x]
resue⋯ seno
seno
Out[77]=
x 2 π 1 if 1 ∈ , x π
x
3
π
3
+ 2 π 1 if 1 ∈ ,
+ 2 π 1 if 1 ∈ , x π + 2 π 1 if 1 ∈
Cálculo formal del área de la región.
π
In[85]:=
π
3
(Sin[2 x] - Sin[x]) x + π (Sin[x] - Sin[2 x]) x
0
seno
seno
3
seno
seno
Out[85]=
5
2
Printed by Wolfram Mathematica Student Edition
7
