SOLUCION ASIGNACION 1
Anuncio

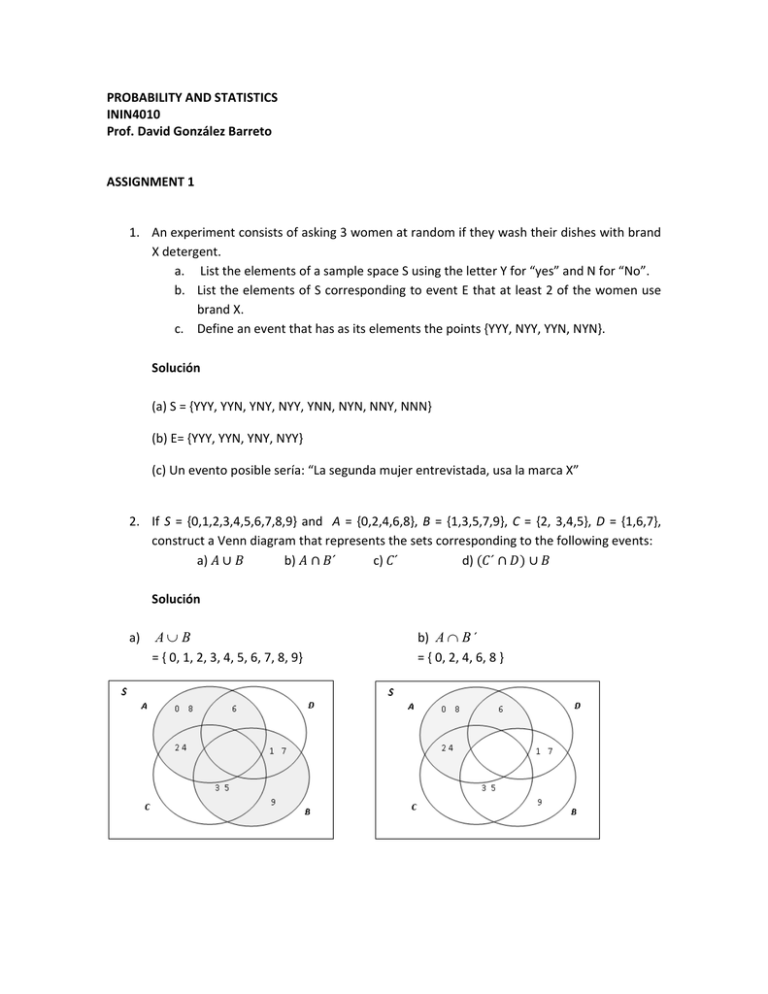
PROBABILITY AND STATISTICS ININ4010 Prof. David González Barreto ASSIGNMENT 1 1. An experiment consists of asking 3 women at random if they wash their dishes with brand X detergent. a. List the elements of a sample space S using the letter Y for “yes” and N for “No”. b. List the elements of S corresponding to event E that at least 2 of the women use brand X. c. Define an event that has as its elements the points {YYY, NYY, YYN, NYN}. Solución (a) S = {YYY, YYN, YNY, NYY, YNN, NYN, NNY, NNN} (b) E= {YYY, YYN, YNY, NYY} (c) Un evento posible sería: “La segunda mujer entrevistada, usa la marca X” 2. If S = {0,1,2,3,4,5,6,7,8,9} and A = {0,2,4,6,8}, B = {1,3,5,7,9}, C = {2, 3,4,5}, D = {1,6,7}, construct a Venn diagram that represents the sets corresponding to the following events: a)
b) ´ c) ´ d) ´
Solución b) A ∩ B ´ a) A ∪ B = { 0, 1, 2, 3, 4, 5, 6, 7, 8, 9} = { 0, 2, 4, 6, 8 } c)
C' = { 0, 1, 6, 7, 8, 9 } d) (C '∩ D) ∪ B = { 1, 3, 5, 6, 7, 9 } 3. Samples of a cast aluminum part are classified on the basis of surface finish (in microinches) and edge finish. The results of 140 parts are summarized as follows: Surface Finish Edge Finish Excellent Good Excellent 80 10 Good 10 40 a) Let A denote the event that a sample has excellent surface finish, and let B denote the event that a sample has excellent edge finish. Determine the number of samples in ´
, ’ and ´
. b) Assume that each of two samples is to be classified on the basis of surface finish, either excellent or good, edge finish, either excellent or good. Use a tree diagram to represent the possible outcomes of this experiment. Solución a) El siguiente diagrama representa la información correspondiente a las 140 partes que conforman la muestra: A B
10
80
10
40
De acuerdo con la figura anterior: ´
= 10 ’ = 50 ´
= 130 4. A car manufacturer offers four optional accessories: a) Automatic or manual transmission b) Air conditioning c) Stereo system (options A, B and C) d) Four exterior paint options If the sample space is composed by all the possible combinations, a) How many models are available? b) Construct a tree diagram that represents this sample space. Solución a) El número total de elementos del espeacio muestral, es igual al product: 2 x 2 x 3 x 4 = 48 b) El diagrama de árbol se muestra en la figura siguiente. PARTE B 4. Three events are shown in a Venn Diagram in the following figure: A B C Reproduce the figure and shade the region that corresponds to each of the following events: a) ` b)
c)
` d)
´ Solución a) ` b) c)
` d) ´ 5. The following data correspond to the amount of newspapers sold along 10 days in a store: 3, 12, 10, 9, 14, 12, 11, 12, 9, 13. a) Determine mean, variance, range, mode and median. b) Set aside the smallest observation (3 newspapers) and recompute the quantities in part a). Comment on your findings. How “different” are these results? c) Which ones of them are central trend measures and which ones are dispersion measures? Solución 3 12 10 9 14 12 11 12 9 13
10.5 10
3 10.5
12 10.5
…
13 10.5
9.61 10 1
14 3 11 12 11 12
11.5 2
Al realizar nuevamente los cálculos sin el valor mínimo, se obtienen los siguientes resultados: Media= 11.33 Varianza = 3 Rango = 5 Moda = 12 Mediana = 12 Al comparar los resultados se observa que las medidas que más habían sido impactadas por la observación atípica, son la varianza y el rango. Al sustraer dicha observación, la varianza se redujo a una tercera parte y el rango a la mitad. 6. Trees are subjected to different levels of carbon dioxide atmosphere with 6% of the trees in a minimal growth condition at 300 parts per million (ppm), 10% at 450 ppm (slow growth), and 37% at 650 ppm (rapid growth). What is the mean and standard deviation of the carbon dioxide atmosphere (in ppm) for these trees? Tip: Read section 3‐4, Montgomery(2007). Growth Condition Carbon dioxide Percentage (%) atmosphere (ppm) Minimal 300 6 Slow 450 10 Rapid 650 37 Solución Se calcula la frecuencia relativa correspondiente a cada una de las tres categorías, las cuales suman 53%. Para ello, cada uno de los porcentajes se divide entre este valor, con lo cual se obtiene: Growth Condition Minimal Slow Rapid Percentage (%) 6 10 37 f(x) 0.1132 0.1887 0.6981 Por lo tanto, para calcular la media, Se puede construir la siguiente tabla: X (Carbon dioxide atmosphere) 300 450 650 ∑ x f(x) f(x) x f(x) 0.1132 0.1887 0.6981 34.0 84.9 453.8 572.6 Para su cálculo, se puede construir la siguiente tabla: Minimal Slow Rapid ∑ x2 f(x) x 300 450 650 f(x) 0.1132 0.1887 0.6981 x2 90000
202500
422500
x2 f(x) 10188 38211.75 294947.3 343347 Por lo tanto, la varianza es igual a: 343347
572.6
15430.4 Entonces, la desviación estándar, es: √15430.4
124.22

