acbsacbsacbsacbs
Anuncio
SOLUCION ASIGNACION # 1
Ejercicio 2-19 pag 28
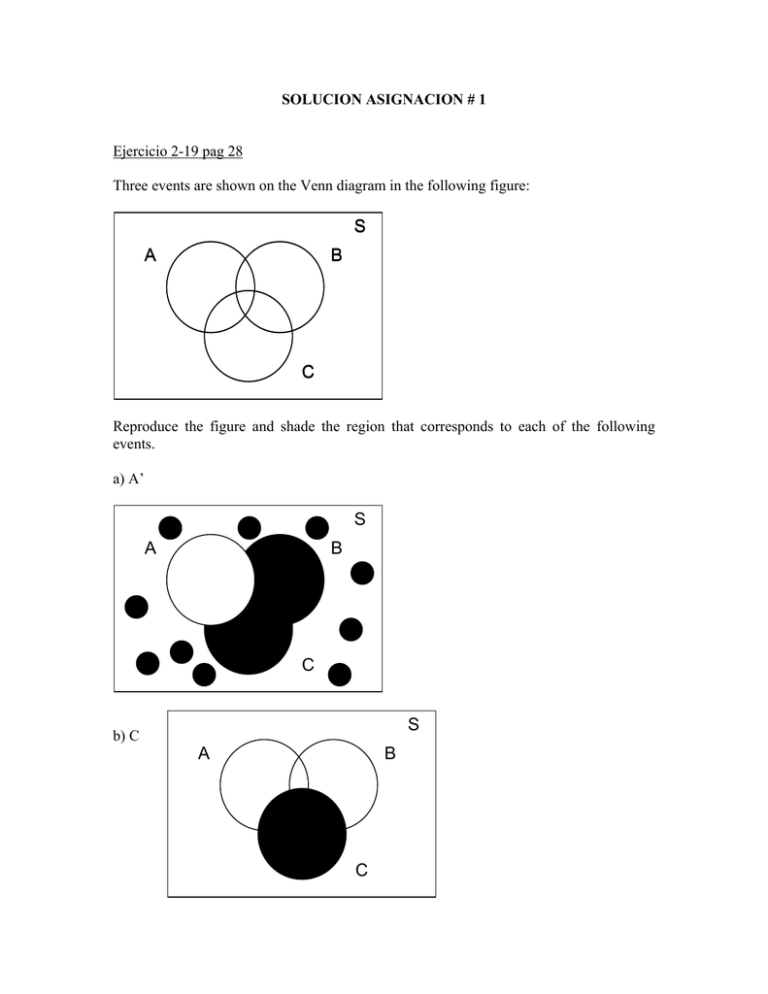
Three events are shown on the Venn diagram in the following figure:
S
A
B
C
Reproduce the figure and shade the region that corresponds to each of the following
events.
a) A’
S
A
B
C
S
b) C
A
B
C
c) ( A ∩ B ) U C
d) (B U C)’
S
A
B
C
e) ( A ∩ B )’ U C
Ejercicio 2-25 pag 29
In control replication, cells are replicated over a period of two days. Not until mitosis is
completed, can freshly – synthesized DNA be replicated again. Two control mechanisms
have been identified – one positive and one negative. Suppose that a replication is
observed in three cells. Let A denote the event that all cells are identified as positive and
let B denote the event that all cells are negative.
Describe the sample space graphically and display each of the following events:
a)
b)
c)
d)
A
B
A∩ B
AUB
A {todas las células son positivas (P)}
B {todas las células son negativas (N)}
A
B
S
El espacio muestral esta dado por:
S={PPP, PPN, PNP, NPP, PNN, NPN, NNP, NNN}.
(a)
(b)
(c)
(d)
A={ PPP }
B={ NNN }
A∩ B = Φ
A ∪ B = { PPP , NNN }
Ejercicio 2-27 pag 29
Samples of a cast aluminum part are classified on the basis of surface finish (in
microinches) and edge finish. The results of 100 parts are summarized as follows:
B
Surface finish
Excellent
Excellent
80
Good
10
Edge Finish
Good
2
A
8
a) Let A denote the event that a sample has excellent surface finish, and let B denote
the event that a sample has excellent edge finish. Determine the number of
samples in A'∩ B , B’ and A U B.
b) Assume that each of two samples is to be classified on the basis of surface finish,
either excellent or good, edge finish, either excellent or good. Use a tree diagram
to represent the possible outcomes of this experiment.
Solucion:
a) Numero de muestras en:
A'∩ B =10
B’ = 2+8 =10
A U B = 80+10+2=92
E (Edge finish)
b)
E
G (Edge finish)
Surface Finish
E (Edge finish)
G
G (Edge finish)
Ejercicio 2-126 pag 60
A sample of three calculators is selected from a manufacturing line, and each calculator is
classified as either defective or acceptable. Let A, B y C denote the events that the first,
second and third calculators respectively are defective.
a) Describe the sample space for this experiment with a tree diagram
b) Use the tree diagram to describe each of the following events:
•
•
•
•
A
B
A∩ B
BUC
a)
3d
2d
d
3n
3d
2n
1
n
2d
3n
3d
3n
2n
3d
3n
b) el espacio muestral esta compuesto por:
S = {1d2d3d, 1d2d3n, 1d2n3d, 1d2n3n, 1n2d3d, 1n2d3n, 1n2n3d, 1n2n3n}
A = {1d2d3d, 1d2d3n, 1d2n3d, 1d2n3n}
B = {1d2d3d, 1d2d3n, 1n2d3d, 1n2d3n}
C = {1d2d3d, 1d2n3d, 1n2d3d, 1n2n3d}
A ∩ B = {1d2d3d, 1d2d3n}
BUC = {1d2d3d, 1d2d3n, 1n2d3d, 1n2d3n, 1d2n3d, 1n2n3d}
Ejercicio 6-1 pag 203
Eight measurements were made on the inside diameter of forged piston rings used in an
automobile engine. The data (in millimeters) are 74.001, 74.003, 74.015, 74.000, 74.005,
74.002, 74.005 and 74.004. Calculate the sample mean and sample standard deviation,
construct a dot diagram and comment on the data.
Hint: The dot diagram consists in placing the data in one axis.
Solucion:
Para calcular el promedio de la muestra:
8
∑x
(74.001 + 74.003 + 74.015...)
= 74.0044mm
n
8
Para calcular la desviación estandar de la muestra se saca primero el calculo para la
varianza:
x=
i =1
i
=
8
s =
2
∑ ( x − x)
i
i =1
2
(74.001 − 74.0044) 2 + (74.003 − 74.0044) 2 ...
=
8 −1
n −1
0.0001518
=
= 0.0000217 mm 2
7
Ahora la desviación estándar será la raíz cuadrada de la varianza:
s = s 2 = 0.0000217 mm 2 = 0.0046mm
Ejercicio 6-11 pag 204
The pH of a solution is measured eight times by one operator using the same instrument.
She obtains the following data: 7.15, 7.20, 7.18, 7.19, 7.21, 7.20, 7.16 and 7.18.
Calculate the sample mean and sample standard deviation. Comment on potential major
sources of variability in this experiment.
8
x=
∑x
i =1
n
i
=
(7.15 + 7.20 + 7.18...) 57.47
=
= 7.1837
8
8
8
∑ ( x − x)
2
i
0.0002987
= 0.00043
n −1
7
s = 0.00043 = 0.02067
s2 =
i =1
=
Fuentes de variabilidad: la repetibilidad dada por el hecho de que el mismo operador este
midiendo la misma solución, el tiempo que se demore entre la medida de una muestra y
la otra lo cual puede hacer que el pH de la solución vaya cambiando, la habilidad del
operador al usar la maquina.
Ejercicio 6-13 pag 204
The following data are the joint temperatures of O-rings ( o F ) for each test firing or
actual launch of the space shuttle rocket motor. (from Presidential Commission on the
Space Shuttle Challenger Accident, Vol. 1 pp. 129-131):
84, 49, 61, 40, 83, 67, 45, 66, 70, 69, 80, 58, 68, 60, 67, 72, 73, 70, 57, 63, 70, 78, 52, 67,
53, 67, 75, 61, 70, 81, 76, 79, 75, 76, 58, 31.
a) Compute the sample mean and sample standard deviation and construct a dot
diagram of the temperature data.
b) Set aside the smallest observation (31 o F ) and recomputed the quantities in part
a). Comment on your findings. How “different” are the other temperatures from
this last value
Solución:
8
x=
∑x
i =1
n
i
=
2367
= 65.75
36
8
∑ ( x − x)
i
2
5116.75
= 146.20
n −1
35
s = 146.20 = 12.09
s2 =
i =1
=
Dot Diagram:
Haciendo a un lado el dato mas pequeño (31 o F )
8
x=
∑x
i =1
n
i
=
2336
= 66.74
35
8
∑ ( x − x)
i
2
3874.68
= 113.96
n −1
34
s = 113.96 = 10.67
s2 =
i =1
=
Removiendo el dato mas pequeño vemos que la desviación de los datos de la media se
reduce considerablemente, lo cual nos muestra que el dato removido era un punto espurio
sin embargo la desviación estándar sigue siendo un valor que nos lleva a pensar que aun
existen puntos espurios ya que la distancia del promedio a los datos esta bastante alta.
