Diapositiva 1 - RiuNet repositorio UPV
Anuncio
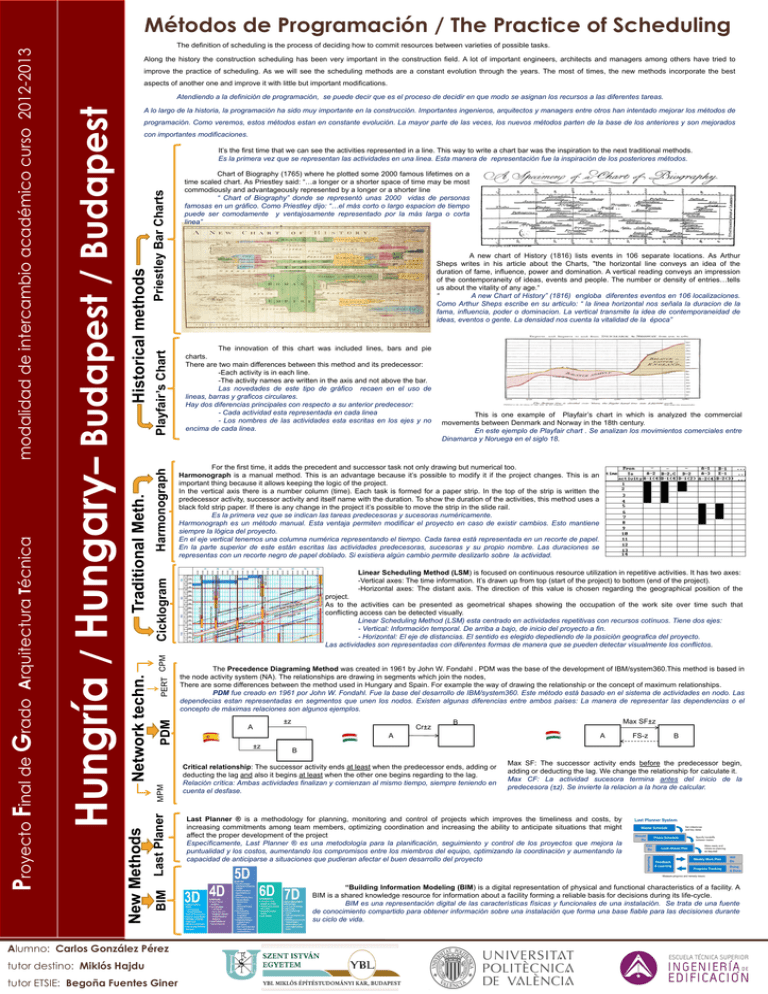
The definition of scheduling is the process of deciding how to commit resources between varieties of possible tasks. Along the history the construction scheduling has been very important in the construction field. A lot of important engineers, architects and managers among others have tried to improve the practice of scheduling. As we will see the scheduling methods are a constant evolution through the years. The most of times, the new methods incorporate the best aspects of another one and improve it with little but important modifications. Atendiendo a la definición de programación, se puede decir que es el proceso de decidir en que modo se asignan los recursos a las diferentes tareas. A lo largo de la historia, la programación ha sido muy importante en la construcción. Importantes ingenieros, arquitectos y managers entre otros han intentado mejorar los métodos de programación. Como veremos, estos métodos estan en constante evolución. La mayor parte de las veces, los nuevos métodos parten de la base de los anteriores y son mejorados con importantes modificaciones. Priestley Bar Charts Playfair’s Chart Harmonograph Chart of Biography (1765) where he plotted some 2000 famous lifetimes on a time scaled chart. As Priestley said: “…a longer or a shorter space of time may be most commodiously and advantageously represented by a longer or a shorter line “ Chart of Biography” donde se representó unas 2000 vidas de personas famosas en un gráfico. Como Priestley dijo: “…el más corto o largo espacion de tiempo puede ser comodamente y ventajosamente representado por la más larga o corta linea” A new chart of History (1816) lists events in 106 separate locations. As Arthur Sheps writes in his article about the Charts, "the horizontal line conveys an idea of the duration of fame, influence, power and domination. A vertical reading conveys an impression of the contemporaneity of ideas, events and people. The number or density of entries…tells us about the vitality of any age.“ “ A new Chart of History” (1816) engloba diferentes eventos en 106 localizaciones. Como Arthur Sheps escribe en su articulo: “ la linea horizontal nos señala la duracion de la fama, influencia, poder o dominacion. La vertical transmite la idea de contemporaneidad de ideas, eventos o gente. La densidad nos cuenta la vitalidad de la época” The innovation of this chart was included lines, bars and pie charts. There are two main differences between this method and its predecessor: -Each activity is in each line. -The activity names are written in the axis and not above the bar. Las novedades de este tipo de gráfico recaen en el uso de lineas, barras y graficos circulares. Hay dos diferencias principales con respecto a su anterior predecesor: - Cada actividad esta representada en cada linea - Los nombres de las actividades esta escritas en los ejes y no encima de cada linea. Linear Scheduling Method (LSM) is focused on continuous resource utilization in repetitive activities. It has two axes: -Vertical axes: The time information. It’s drawn up from top (start of the project) to bottom (end of the project). -Horizontal axes: The distant axis. The direction of this value is chosen regarding the geographical position of the project. As to the activities can be presented as geometrical shapes showing the occupation of the work site over time such that conflicting access can be detected visually. Linear Scheduling Method (LSM) esta centrado en actividades repetitivas con recursos cotínuos. Tiene dos ejes: - Vertical: Información temporal. De arriba a bajo, de inicio del proyecto a fin. - Horizontal: El eje de distancias. El sentido es elegido depediendo de la posición geografica del proyecto. Las actividades son representadas con diferentes formas de manera que se pueden detectar visualmente los conflictos. The Precedence Diagraming Method was created in 1961 by John W. Fondahl . PDM was the base of the development of IBM/system360.This method is based in the node activity system (NA). The relationships are drawing in segments which join the nodes, There are some differences between the method used in Hungary and Spain. For example the way of drawing the relationship or the concept of maximum relationships. PDM fue creado en 1961 por John W. Fondahl. Fue la base del desarrollo de IBM/system360. Este método está basado en el sistema de actividades en nodo. Las dependecias estan representadas en segmentos que unen los nodos. Existen algunas diferencias entre ambos paises: La manera de representar las dependencias o el concepto de máximas relaciones son algunos ejemplos. ±z A Cr±z ±z tutor ETSIE: Begoña Fuentes Giner Max SF±z B A A FS-z B B Critical relationship: The successor activity ends at least when the predecessor ends, adding or deducting the lag and also it begins at least when the other one begins regarding to the lag. Relación crítica: Ambas actividades finalizan y comienzan al mismo tiempo, siempre teniendo en cuenta el desfase. Max SF: The successor activity ends before the predecessor begin, adding or deducting the lag. We change the relationship for calculate it. Max CF: La actividad sucesora termina antes del inicio de la predecesora (±z). Se invierte la relacion a la hora de calcular. Last Planner ® is a methodology for planning, monitoring and control of projects which improves the timeliness and costs, by increasing commitments among team members, optimizing coordination and increasing the ability to anticipate situations that might affect the proper development of the project Específicamente, Last Planner ® es una metodología para la planificación, seguimiento y control de los proyectos que mejora la puntualidad y los costos, aumentando los compromisos entre los miembros del equipo, optimizando la coordinación y aumentando la capacidad de anticiparse a situaciones que pudieran afectar el buen desarrollo del proyecto “Building Information Modeling (BIM) is a digital representation of physical and functional characteristics of a facility. A BIM is a shared knowledge resource for information about a facility forming a reliable basis for decisions during its life-cycle. BIM es una representación digital de las características físicas y funcionales de una instalación. Se trata de una fuente de conocimiento compartido para obtener información sobre una instalación que forma una base fiable para las decisiones durante su ciclo de vida. Alumno: Carlos González Pérez tutor destino: Miklós Hajdu This is one example of Playfair’s chart in which is analyzed the commercial movements between Denmark and Norway in the 18th century. En este ejemplo de Playfair chart . Se analizan los movimientos comerciales entre Dinamarca y Noruega en el siglo 18. For the first time, it adds the precedent and successor task not only drawing but numerical too. Harmonograph is a manual method. This is an advantage because it’s possible to modify it if the project changes. This is an important thing because it allows keeping the logic of the project. In the vertical axis there is a number column (time). Each task is formed for a paper strip. In the top of the strip is written the predecessor activity, successor activity and itself name with the duration. To show the duration of the activities, this method uses a black fold strip paper. If there is any change in the project it’s possible to move the strip in the slide rail. Es la primera vez que se indican las tareas predecesoras y sucesoras numéricamente. Harmonograph es un método manual. Esta ventaja permiten modificar el proyecto en caso de existir cambios. Esto mantiene siempre la lógica del proyecto. En el eje vertical tenemos una columna numérica representando el tiempo. Cada tarea está representada en un recorte de papel. En la parte superior de este están escritas las actividades predecesoras, sucesoras y su propio nombre. Las duraciones se representas con un recorte negro de papel doblado. Si existiera algún cambio permite deslizarlo sobre la actividad. Cicklogram PERT CPM PDM BIM Last Planer MPM Network techn. Traditional Meth. Historical methods It’s the first time that we can see the activities represented in a line. This way to write a chart bar was the inspiration to the next traditional methods. Es la primera vez que se representan las actividades en una linea. Esta manera de representación fue la inspiración de los posteriores métodos. New Methods Hungría / Hungary– Budapest / Budapest Proyecto Final de Grado Arquitectura Técnica modalidad de intercambio académico curso 2012-2013 Métodos de Programación / The Practice of Scheduling Logo Universidad Origen
