The annual rate of turnover for the Market Services Sector stands at
Anuncio
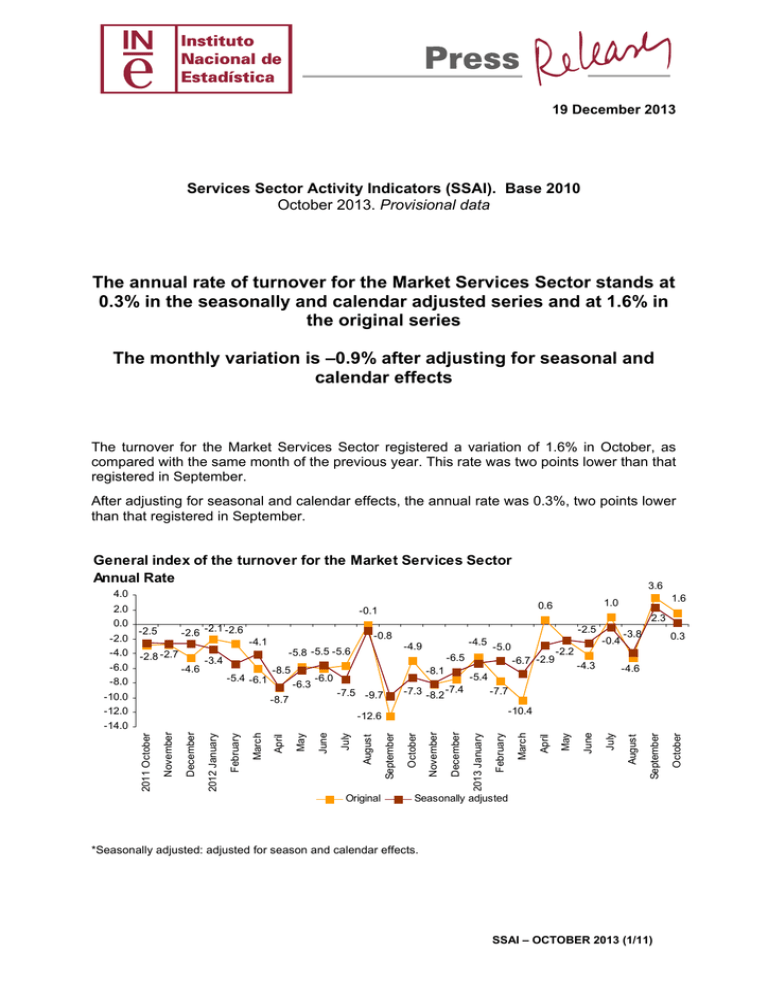
19 December 2013 Services Sector Activity Indicators (SSAI). Base 2010 October 2013. Provisional data The annual rate of turnover for the Market Services Sector stands at 0.3% in the seasonally and calendar adjusted series and at 1.6% in the original series The monthly variation is –0.9% after adjusting for seasonal and calendar effects The turnover for the Market Services Sector registered a variation of 1.6% in October, as compared with the same month of the previous year. This rate was two points lower than that registered in September. After adjusting for seasonal and calendar effects, the annual rate was 0.3%, two points lower than that registered in September. General index of the turnover for the Market Services Sector Annual Rate 3.6 4.0 2.0 0.0 -2.0 -4.0 -2.6 -2.1 -2.6 -2.5 -2.8 -2.7 -6.0 -8.0 -4.6 2.3 -3.4 -10.0 -12.0 -8.5 -6.3 -6.7 -2.9 -3.8 0.3 -2.2 -4.3 -4.6 -5.4 -7.3 -8.2 -7.4 -7.5 -9.7 -0.4 -5.0 -6.5 -8.1 -6.0 -8.7 -4.5 -4.9 -5.8 -5.5 -5.6 -5.4 -6.1 -2.5 -0.8 -4.1 1.6 1.0 0.6 -0.1 -7.7 -10.4 -12.6 Original Seasonally adjusted *Seasonally adjusted: adjusted for season and calendar effects. SSAI – OCTOBER 2013 (1/11) October September August July June May April March February 2013 January December November October September August July June May April March February 2012 January December November 2011 October -14.0 Annual evolution of turnover for the Services Sector Trade increased its turnover by 2.0% and Other Services did so by 1.1%. By sectors, Sale and repair of vehicles and motorcycles (10.5%) and Accommodation (2.6%) registered the greatest increase. In turn, Information and communications (–2.0%) and Retail Trade (–0.6%) were the only sectors that registered a decrease. After adjusting for seasonal and calendar effects, all sectors presented positive rates as compared with October of the previous year, except Information and communications (– 3.0%), Retail Trade (–0.5%) and Administrative and support service activities (–0.1%). Annual rates of the national Turnover index by sector Original index Seasonally adjusted index Annual rate (%) Annual rate (%) GENERAL INDEX 1. Trade 1.1. Sale and repair of vehicles and motorcycles 1.2. Wholesale trade 1.3. Retail trade 2. Other services 2.1. Transport and storage 2.2. Accommodation 2.3. Information and communications 2.4. Professional, scientific and technical activities 2.5. Administrative and support service activities 1.6 2.0 10.5 2.2 -0.6 1.1 2.0 2.6 -2.0 2.1 0.6 0.3 0.3 10.0 0.1 -0.5 0.2 1.1 3.1 -3.0 1.3 -0.1 A more detailed analysis showed the activities that registered the highest annual rates and those that registered the greatest decreases in October. Activities with the greatest annual rates of the Services Sector turnover Original Annual rate (%) Index 107.2 13.9 80.3 12.7 108.2 7.3 96.7 6.4 Activity (Elementary aggregate) Employment activities Sale of motor vehicles Rail transport Programming and broadcasting activities Activities with the lowest annual rates of the Services Sector turnover Activity (Elementary aggregate) Office administrative and other business support activities Telecommunications Motion picture, television programme production and music publishing activities Water transport Original Annual rate (%) Index 88.1 -10.3 78.2 -6.7 91.3 -5.4 79.2 -4.7 SSAI –OCTOBER 2013 (2/11) Results by Autonomous Community. Annual turnover variation rates In October, 11 Autonomous Communities registered positive annual rates of turnover in the Market Service Sector. Illes Balears (9.7%), La Rioja (4.8%), and Castilla-La Mancha (4.5%) were the autonomous communities that registered the greatest increases. In turn, Cantabria (–6.1%), Extremadura (–3.4%) and País Vasco (–1.4%) registered the greatest decreases. General Index by Autonomous Community Turnover Annual Rate 9.7 Balears, Illes 4.8 Rioja, La Castilla - La Mancha 4.5 Aragón 4.4 Comunitat Valenciana 3.9 Canarias 3.8 3.4 Castilla y León 3.1 Cataluña 2.7 Murcia, Región de Navarra, Comunidad Foral de 1.7 NATIONAL 1.6 0.2 Andalucía Galicia -0.1 Madrid, Comunidad de -0.1 -0.6 Asturias, Principado de -1.4 País Vasco -3.4 Extremadura Cantabria -6.1 SSAI –OCTOBER 2013 (3/11) Monthly evolution of the Services Sector turnover adjusted for seasonal and calendar effects After eliminating the seasonal and calendar effect, the monthly variation of the general index of Market Services Sector Turnover between October and September stood at –0.9%. This rate was 2.3 points higher than that registered in September. General index of the turnover for the Market Services Sector Adjusted for seasonal and calendar effects. Monthly Rate 3.2 1.1 0.8 1.2 0.8 0.8 -0.6 1.2 -0.7 -0.7 -1.3 -0.9 October September August July June May April March February 2013 January December November October -3.2 September August July June May April March February 2012 January December November 2011 October 8.0 6.0 6.8 4.0 0.5 0.5 2.0 0.3 0.0 -0.4 -1.0 -2.0 -0.9 -0.4 -1.1 -1.6 -4.0 -3.2 -6.0 -8.0 -9.0 -10.0 Monthly evolution of the turnover by sectors adjusted for seasonal and calendar effects After eliminating the seasonal and calendar effect, the monthly variations of Trade (–1.0%) and Other Services (–0.4%) were negative. By sector, all of them registered decreases, except Sale and repair of vehicles and motorcycles (3,0%) and Transport and storage (0.0%). General and by sector turnover Index Adjusted for seasonal and calendar effects. Monthly rate -0.9 GENERAL INDEX -1.0 1. Trade 1.1. Sale and repair of vehicles and motorcycles 3.0 1.2. Wholesale trade and trade intermediaries -1.1 -1.8 1.3. Retail trade -0.4 2. Other services 2.1.Transport and storage 0.0 -0.3 2.2. Accommodation 0.3 2.3. Information and communications -0.8 2.4. Professional, scientific and technical activities 2.5. Administrative and support service activities -2.2 SSAI –OCTOBER 2013 (4/11) Evolution of occupation Employment in the Market Services Sector experienced a decrease of 0.8% in October, as compared with the same month of previous year. This annual rate was the same than that registered in September. Trade and Other Services registered an annual variation of –1.9% and 0.0%, respectively. By sector, Accommodation and Administrative and support service activities were the only ones that registered positive annual rates (1.2%). In turn, Sale and repair of vehicles and motorcycles (–3.7%) and Information and communication (–2.5%) registered the greatest decreases as compared with October 2012. National Indices of employed personnel by sector Index GENERAL INDEX 1. Trade 1.1. Sale and repair of vehicles and motorcycles 1.2. Wholesale trade 1.3. Retail trade 2. Other services 2.1.Transport and storage 2.2. Accommodation 2.3. Information and communications 2.4. Professional, scientific and technical activities 2.5. Administrative and support service activities Monthly rate (%) 95.8 95.0 87.2 97.0 95.1 96.3 94.3 98.4 93.2 94.9 97.9 Annual rate (%) -0.1 0.8 -0.5 3.4 -0.6 -0.7 -0.4 -2.8 -0.3 0.7 0.2 SSAI –OCTOBER 2013 (5/11) -0.8 -1.9 -3.7 -1.6 -1.9 0.0 -1.5 1.2 -2.5 -0.2 1.2 Results by Autonomous Community. Variation rates of occupation Five Autonomous Communities registered positive rates in employment, as compared with October of 2012. Illes Balears (4.5%) and Canarias (1.3%) registered the greatest increases. In turn, Aragón (–2.7%) and La Rioja (–2.2%) registered the greatest decreases in employment. General Index by Autonomous Community Annual rate of employed personnel 4.5 Balears, Illes 1.3 Canarias 0.9 Murcia, Región de 0.5 Castilla - La Mancha 0.1 Comunitat Valenciana 0.0 Cataluña Extremadura -0.7 Cantabria -0.7 NATIONAL -0.8 -1.2 País Vasco -1.4 Andalucía Navarra, Comunidad Foral de -1.9 Madrid, Comunidad de -2.0 Galicia -2.0 Castilla y León -2.1 Asturias, Principado de -2.1 Rioja, La -2.2 Aragón -2.7 SSAI –OCTOBER 2013 (6/11) Instituto Nacional de Estadística Indicadores de Actividad del Sector Servicios. Base 2010 Octubre 2013 Datos provisionales 1. Índices nacionales de cifra de negocios por ramas de actividad Índice Tasa (%) Mensual ÍNDICE GENERAL 1. COMERCIO 1.1. VENTA Y REPARACIÓN DE VEHÍCULOS Y MOTOCICLETAS Venta de vehículos, motocicletas y repuestos Mantenimiento y reparación de vehículos 1.2. COMERCIO AL POR MAYOR E INTERMEDIARIOS DEL COMERCIO Intermediarios del comercio Materias primas agrarias y de animales vivos Productos alimenticios, bebidas y tabaco Artículos de uso doméstico Equipos para las tecnologías de la información y las comunicaciones Otra maquinaria, equipos y suministros Otro comercio al por mayor especializado No especializado 1.3. COMERCIO AL POR MENOR 2. OTROS SERVICIOS 2.1. TRANSPORTE Y ALMACENAMIENTO Transporte terrestre - Transporte por ferrocarril - Transporte por taxi - Otro transporte terrestre de pasajeros - Transporte de mercancías por carretera y servicios de mudanza Transporte marítimo y por vías navegables interiores Transporte aéreo Almacenamiento y actividades anexas al transporte Actividades postales y de correos 2.2. HOSTELERÍA Servicios de alojamiento Servicios de comidas y bebidas 2.3. INFORMACIÓN Y COMUNICACIONES Edición Actividades cinematográficas, de programas de televisión y edición musical Programación y emisión de radio y televisión Telecomunicaciones Programación, consultoría y otras actividades relacionadas con la informática Servicios de información 2.4. ACTIVIDADES PROFESIONALES, CIENTÍFICAS Y TÉCNICAS Actividades jurídicas, de contabilidad y de consultoría de gestión empresarial Servicios técnicos de arquitectura e ingeniería; ensayos y análisis técnicos Publicidad y estudios de mercado Otras actividades profesionales, científicas y técnicas 2.5. ACTIVIDADES ADMINISTRATIVAS Y SERVICIOS AUXILIARES Actividades relacionadas con el empleo Agencias de viaje y operadores turísticos Actividades de seguridad e investigación Actividades de limpieza Actividades administrativas de oficina 95,1 94,3 81,9 80,3 90,8 97,8 109,9 112,8 92,5 105,6 83,1 95,4 98,8 102,1 92,0 96,3 105,1 101,1 108,2 100,7 105,5 99,6 79,2 105,0 112,9 98,6 95,1 106,7 91,2 90,8 86,5 91,3 96,7 78,2 113,0 105,2 95,8 103,2 93,4 89,6 90,2 94,2 107,2 89,9 95,8 96,7 88,1 Anual 5,7 7,5 19,2 19,5 17,4 7,7 10,7 13,7 14,5 4,0 21,5 17,0 -0,1 14,5 4,3 2,6 6,5 10,2 10,5 -4,4 8,1 11,8 -1,0 -8,6 5,8 14,4 -8,8 -22,1 -0,8 4,2 -1,5 6,1 7,0 -2,0 13,4 11,1 13,5 23,7 4,6 11,3 15,5 -8,2 8,7 -22,3 3,1 1,1 3,6 Media de lo que va de año 1,6 2,0 10,5 12,7 0,5 2,2 3,9 2,4 0,3 6,0 5,3 0,6 0,3 1,4 -0,6 1,1 2,0 2,2 7,3 0,2 -3,8 3,2 -4,7 1,5 2,6 -2,7 2,6 4,9 1,6 -2,0 -1,1 -5,4 6,4 -6,7 3,3 -0,3 2,1 5,6 -1,2 2,5 -2,1 0,6 13,9 5,9 -1,9 0,1 -10,3 -2,7 -2,5 -7,0 -7,1 -6,6 -1,4 0,1 0,1 0,1 -0,6 -1,7 -7,8 -2,0 -3,7 -3,1 -3,1 -0,7 -1,9 1,7 -1,9 -6,3 -1,3 -12,0 -1,7 1,6 -3,1 -0,6 2,6 -2,1 -6,0 -5,8 -12,9 -1,9 -8,2 -1,9 -7,2 -4,7 -2,1 -5,9 -6,5 -7,1 -4,2 2,6 -4,5 -1,8 -2,3 -9,2 IASS - OCTUBRE 2013 (7/11) Instituto Nacional de Estadística 2. Índices nacionales de cifra de negocios corregidos de efectos de calendario Índice Tasa (%) Mensual Anual Media de lo que va de año ÍNDICE GENERAL 93,3 3,0 0,2 -2,6 1. Comercio 92,2 4,2 0,2 -2,4 1.1. Venta y reparación de vehículos y motocicletas 81,1 14,9 10,5 -6,4 1.2. Comercio al por mayor e intermediarios del comercio 95,0 3,6 0,0 -1,4 1.3. Comercio al por menor 91,5 2,4 -0,6 -2,9 95,3 1,1 0,3 -3,0 103,1 3,8 0,6 -0,6 2.2. Hostelería 95,7 -7,9 3,1 -0,4 2.3. Información y comunicaciones 89,5 2,3 -2,9 -5,9 2.4. Actividades profesionales, científicas y técnicas 94,8 11,8 1,3 -4,8 2.5. Actividades administrativas y servicios auxiliares 93,3 -9,4 -0,1 -4,0 2. Otros servicios 2.1. Transporte y almacenamiento 3. Índices nacionales de cifra de negocios corregidos de efectos estacionales y de calendario Índice Tasa (%) Mensual Anual Media de lo que va de año ÍNDICE GENERAL 90,5 -0,9 0,3 -2,7 1. Comercio 89,6 -1,0 0,3 -2,5 1.1. Venta y reparación de vehículos y motocicletas 77,3 3,0 10,0 -6,8 1.2. Comercio al por mayor e intermediarios del comercio 91,7 -1,1 0,1 -1,5 1.3. Comercio al por menor 90,9 -1,8 -0,5 -3,0 92,0 -0,4 0,2 -3,1 99,1 0,0 1,1 -0,7 2.2. Hostelería 94,4 -0,3 3,1 -0,8 2.3. Información y comunicaciones 87,4 0,3 -3,0 -5,9 2. Otros servicios 2.1. Transporte y almacenamiento 2.4. Actividades profesionales, científicas y técnicas 88,9 -0,8 1,3 -5,0 2.5. Actividades administrativas y servicios auxiliares 91,6 -2,2 -0,1 -4,2 IASS - OCTUBRE 2013 (8/11) Instituto Nacional de Estadística 4. Índice general de cifra de negocios corregido de efectos estacionales y de calendario Tasa (%) Anual1 2011 2012 2013 2012 2013 Trimestral2 Mensual3 2009 -13,5 2010 0,8 2011 -1,0 2012 -6,1 2013 -2,7 TIV -2,6 -1,8 TI -4,3 -1,5 TII -6,8 -3,0 TIII -6,0 0,2 TIV -7,3 -3,2 TI -5,7 0,2 TII -2,5 0,2 TIII -0,7 2,1 TIV 0,3 -2,0 OCT -7,3 1,1 NOV -8,1 -0,6 DIC -6,5 0,8 ENE -5,4 0,8 FEB -5,0 -0,7 MAR -6,7 -1,3 ABR -2,9 0,8 MAY -2,2 1,2 JUN -2,5 -0,7 JUL -0,4 1,2 AGO -3,8 3,2 SEP 2,3 -3,2 OCT 0,3 -0,9 Nota: Tasa anual: Variación de un periodo sobre el mismo periodo del año anterior 1. 2 Tasa trimestral: Variación de un trimestre sobre el trimestre anterior. En el trimestre actual es la variación de lo que va de trimestre sobre el trimestre anterior 3 Tasa mensual: Variación de un mes sobre el mes anterior IASS - OCTUBRE 2013 (9/11) Instituto Nacional de Estadística 5. Índices nacionales de ocupación por ramas de actividad Índice Tasa (%) Mensual ÍNDICE GENERAL 1. COMERCIO 1.1. VENTA Y REPARACIÓN DE VEHÍCULOS Y MOTOCICLETAS Venta de vehículos, motocicletas y repuestos Mantenimiento y reparación de vehículos 1.2. COMERCIO AL POR MAYOR E INTERMEDIARIOS DEL COMERCIO Intermediarios del comercio Materias primas agrarias y de animales vivos Productos alimenticios, bebidas y tabaco Artículos de uso doméstico Equipos para las tecnologías de la información y las comunicaciones Otra maquinaria, equipos y suministros Otro comercio al por mayor especializado No especializado 1.3. COMERCIO AL POR MENOR 2. OTROS SERVICIOS 2.1. TRANSPORTE Y ALMACENAMIENTO Transporte terrestre - Transporte por ferrocarril - Transporte por taxi - Otro transporte terrestre de pasajeros - Transporte de mercancías por carretera y servicios de mudanza Transporte marítimo y por vías navegables interiores Transporte aéreo Almacenamiento y actividades anexas al transporte Actividades postales y de correos 2.2. HOSTELERÍA Servicios de alojamiento Servicios de comidas y bebidas 2.3. INFORMACIÓN Y COMUNICACIONES Edición Actividades cinematográficas, de programas de televisión y edición musical Programación y emisión de radio y televisión Telecomunicaciones Programación, consultoría y otras actividades relacionadas con la informática Servicios de información 2.4. ACTIVIDADES PROFESIONALES, CIENTÍFICAS Y TÉCNICAS Actividades jurídicas, de contabilidad y de consultoría de gestión empresarial Servicios técnicos de arquitectura e ingeniería; ensayos y análisis técnicos Publicidad y estudios de mercado Otras actividades profesionales, científicas y técnicas 2.5. ACTIVIDADES ADMINISTRATIVAS Y SERVICIOS AUXILIARES Actividades relacionadas con el empleo Agencias de viaje y operadores turísticos Actividades de seguridad e investigación Actividades de limpieza Actividades administrativas de oficina 95,8 95,0 87,2 83,8 91,0 97,0 97,9 100,4 105,6 94,2 94,6 92,0 89,4 92,3 95,1 96,3 94,3 94,7 98,7 97,4 97,5 93,2 91,1 89,2 96,6 88,4 98,4 97,2 98,9 93,2 82,9 76,5 87,9 87,5 101,3 95,1 94,9 98,0 91,0 89,9 96,4 97,9 110,2 89,0 92,6 95,9 97,7 Anual -0,1 0,8 -0,5 -0,4 -0,6 3,4 1,7 2,2 10,1 1,1 -0,7 -0,8 0,0 1,5 -0,6 -0,7 -0,4 -0,3 -0,1 -1,5 -1,2 0,1 -8,7 -2,1 -0,3 -0,1 -2,8 -9,3 -0,9 -0,3 -0,2 0,8 -2,0 -0,5 -0,2 0,6 0,7 0,4 0,6 2,0 1,2 0,2 6,5 -1,8 -0,5 -1,8 0,8 Media de lo que va de año -0,8 -1,9 -3,7 -5,0 -2,4 -1,6 -0,5 -1,0 0,1 -2,9 -1,8 -1,0 -3,6 -7,7 -1,9 0,0 -1,5 -0,8 -0,1 -2,3 -1,9 -0,4 0,5 -9,5 -1,4 -2,9 1,2 1,0 1,2 -2,5 -4,0 -7,3 -5,0 -3,6 -0,9 -3,7 -0,2 0,2 0,1 -4,2 1,1 1,2 7,3 -2,0 -2,0 0,6 0,2 -1,6 -2,0 -4,1 -5,6 -2,5 -1,5 -1,3 -1,2 -0,1 -1,2 -2,1 -2,4 -3,6 -6,2 -2,0 -1,4 -2,2 -1,8 -0,6 -1,8 -1,9 -1,8 -4,2 -4,9 -2,0 -3,9 -0,3 -0,8 -0,1 -3,4 -5,9 -11,7 -7,0 -4,7 -1,0 -3,2 -1,6 -0,5 -2,5 -4,5 -1,1 -1,0 2,5 -4,1 -3,1 -1,1 -1,6 IASS - OCTUBRE 2013 (10/11) Instituto Nacional de Estadística 6. Índice general de cifra de negocios por comunidades autónomas Índice Tasa (%) Mensual ÍNDICE NACIONAL Andalucía Aragón Asturias, Principado de Balears, Illes Canarias Cantabria Castilla y León Castilla-La Mancha Cataluña Comunitat Valenciana Extremadura Galicia Madrid, Comunidad de Murcia, Región de Navarra, Comunidad Foral de País Vasco Rioja, La Anual Media de lo que va de año 95,1 5,7 1,6 -2,7 89,0 100,3 88,5 98,7 99,2 86,7 99,8 95,9 98,9 96,5 91,5 99,4 93,1 92,7 93,2 93,4 100,1 6,5 11,3 3,3 -15,3 0,5 0,9 11,0 11,0 7,3 8,0 12,2 4,1 4,4 11,1 9,1 5,1 11,6 0,2 4,4 -0,6 9,7 3,8 -6,1 3,4 4,5 3,1 3,9 -3,4 -0,1 -0,1 2,7 1,7 -1,4 4,8 -3,3 -1,4 -3,7 5,3 -2,0 -7,2 -1,1 -3,5 -2,8 -2,7 -5,0 -3,3 -2,9 -0,1 -5,5 -4,2 0,6 7. Índice general de ocupación por comunidades autónomas Índice Tasa (%) Mensual ÍNDICE NACIONAL Andalucía Aragón Asturias, Principado de Balears, Illes Canarias Cantabria Castilla y León Castilla-La Mancha Cataluña Comunitat Valenciana Extremadura Galicia Madrid, Comunidad de Murcia, Región de Navarra, Comunidad Foral de País Vasco Rioja, La Más información en INEbase – www.ine.es Anual Media de lo que va de año 95,8 -0,1 -0,8 -1,6 94,8 93,0 92,1 105,1 97,3 95,0 94,7 94,4 97,1 97,0 94,9 94,4 94,7 96,6 96,1 97,0 96,5 -0,1 -1,4 -0,3 -6,9 0,4 -2,2 -0,2 -0,9 -0,9 2,9 -0,6 -0,7 0,5 1,7 -0,3 -0,5 0,2 -1,4 -2,7 -2,1 4,5 1,3 -0,7 -2,1 0,5 0,0 0,1 -0,7 -2,0 -2,0 0,9 -1,9 -1,2 -2,2 -1,5 -2,3 -3,3 2,9 -1,0 -2,4 -3,1 -0,4 -1,4 -1,0 -1,9 -2,4 -2,6 -0,3 -3,1 -1,0 -2,4 Todas las notas de prensa en: www.ine.es/prensa/prensa.htm Gabinete de prensa: Teléfonos: 91 583 93 63 / 94 08 – Fax: 91 583 90 87 - gprensa@ine.es Área de información: Teléfono: 91 583 91 00 – Fax: 91 583 91 58 – www.ine.es/infoine IASS - OCTUBRE 2013 (11/11)
