Spain
Anuncio
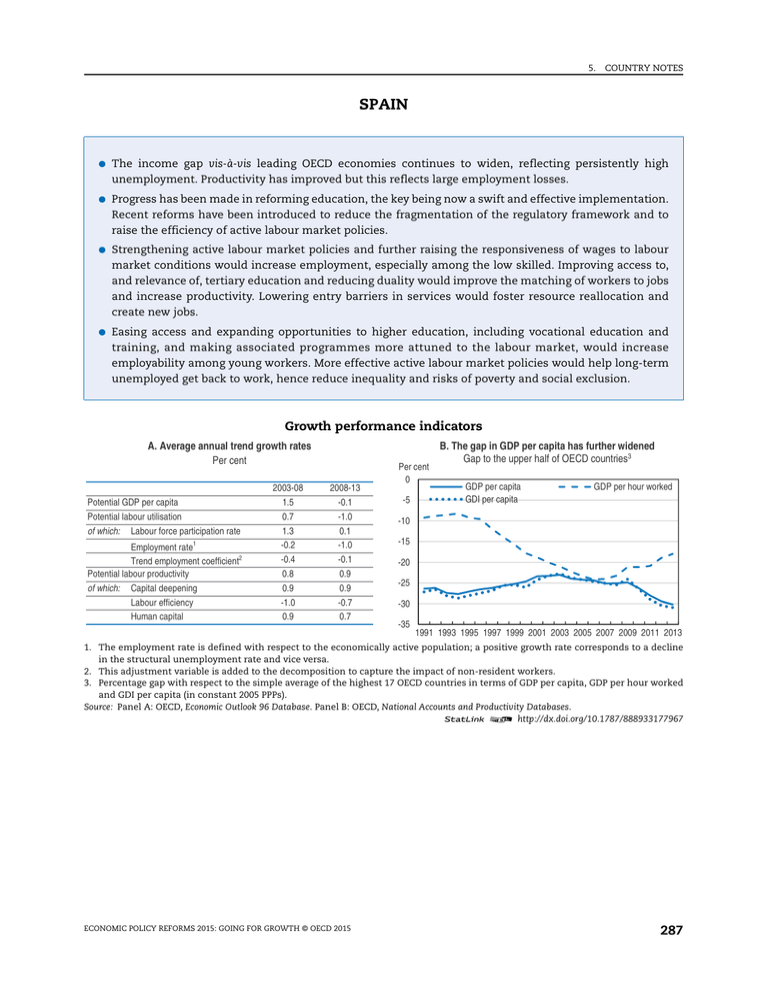
5. COUNTRY NOTES SPAIN ● The income gap vis-à-vis leading OECD economies continues to widen, reflecting persistently high unemployment. Productivity has improved but this reflects large employment losses. ● Progress has been made in reforming education, the key being now a swift and effective implementation. Recent reforms have been introduced to reduce the fragmentation of the regulatory framework and to raise the efficiency of active labour market policies. ● Strengthening active labour market policies and further raising the responsiveness of wages to labour market conditions would increase employment, especially among the low skilled. Improving access to, and relevance of, tertiary education and reducing duality would improve the matching of workers to jobs and increase productivity. Lowering entry barriers in services would foster resource reallocation and create new jobs. ● Easing access and expanding opportunities to higher education, including vocational education and training, and making associated programmes more attuned to the labour market, would increase employability among young workers. More effective active labour market policies would help long-term unemployed get back to work, hence reduce inequality and risks of poverty and social exclusion. Growth performance indicators A. Average annual trend growth rates Per cent Potential GDP per capita Potential labour utilisation of which: Labour force participation rate Employment rate1 Trend employment coefficient2 Potential labour productivity of which: Capital deepening Labour efficiency Human capital 2003-08 1.5 0.7 1.3 -0.2 -0.4 0.8 0.9 -1.0 0.9 2008-13 -0.1 -1.0 0.1 -1.0 -0.1 0.9 0.9 -0.7 0.7 Per cent 0 -5 B. The gap in GDP per capita has further widened Gap to the upper half of OECD countries3 GDP per capita GDI per capita GDP per hour worked -10 -15 -20 -25 -30 -35 1991 1993 1995 1997 1999 2001 2003 2005 2007 2009 2011 2013 1. The employment rate is defined with respect to the economically active population; a positive growth rate corresponds to a decline in the structural unemployment rate and vice versa. 2. This adjustment variable is added to the decomposition to capture the impact of non-resident workers. 3. Percentage gap with respect to the simple average of the highest 17 OECD countries in terms of GDP per capita, GDP per hour worked and GDI per capita (in constant 2005 PPPs). Source: Panel A: OECD, Economic Outlook 96 Database. Panel B: OECD, National Accounts and Productivity Databases. 1 2 http://dx.doi.org/10.1787/888933177967 ECONOMIC POLICY REFORMS 2015: GOING FOR GROWTH © OECD 2015 287 5. COUNTRY NOTES SPAIN Policy indicators A. Spending on active labour market policies is relatively low Public expenditure per unemployed, as a percentage of GDP per capita, 2011 20 18 16 14 12 10 8 6 4 2 0 B. Regulatory barriers to competition in services are relatively high Index scale of 0-6 from least to most restrictive, 2013 6 5 4 3 2 1 SPAIN EU OECD 0 SPAIN EU OECD Source: Panel A: OECD, Public expenditure and participant stocks on LMP and Economic Outlook Databases. Panel B: OECD, Product Market Regulation Database, www.oecd.org/economy/pmr. 1 2 http://dx.doi.org/10.1787/888933178397 Going for Growth 2015 priorities Priorities supported by indicators Improve access to higher education and ensure that associated programmes adapt to labour market needs. School drop-out rates are high. Higher education programmes are ill-adapted to job market needs, reducing workers’ employability and productivity. Actions taken: A major educational reform has been introduced and will enter into force gradually in 2014-15 and 2016-17 academic years. Measures include establishing external standard evaluations and basic vocational tracks, and allowing for an earlier choice of educational curriculum. University tuition fees have been raised and eligibility for grants now takes into account academic achievement. The number of beneficiaries has increased but the average grant amount has decreased. Recommendations: Make school-based vocational education more practice-oriented and raise employers’ involvement in training design. Increase specialisation in universities. Do not reduce the average amount of grants until other financing alternatives, such as loans with income-contingent repayments, are available. Provide more training opportunities for adults and focus on encouraging participation by the low-skilled and older people. Strengthen active labour market policies. Without effective activation and training, long-term unemployed are at risk of labour market and social exclusion. Actions taken: A new activation strategy has been set-up in 2013 and 2014, linking the allocation of funding from central government to regional results, encouraging the systematic use of profiling by regionally-run agencies, creating a single nationwide portal for job-search, and foreseeing the involvement of private providers in delivering job-search assistance. Recommendations: Boost resources and efficiency of public employment services. Strengthen activation and extend training measures for the unemployed. Introduce systematic evaluation of training schemes and allocate funding towards those schemes that are the most effective at increasing employability. 288 ECONOMIC POLICY REFORMS 2015: GOING FOR GROWTH © OECD 2015 5. COUNTRY NOTES SPAIN Make wages more responsive to economic and firm-specific conditions. Allowing wages to respond more swiftly to economic conditions would help preserve jobs in the event of adverse shocks. Actions taken: No action taken. Recommendations: Evaluate the effects of the 2012 wage bargaining reform. Based on the findings from this evaluation, as a first option gradually increase representation requirements for both unions and firms for new sectorial collective agreements with a view to making the bargaining process more inclusive. As a second option, require firms to opt-in rather than allowing firms to opt-out from new sectorial agreements. Other key priorities Reduce the gap in job protection between permanent and temporary contracts. A h i g h level of protection for permanent relative to temporary contracts leads to persistent labour market duality, which increases the frequency of unemployment spells, especially for young workers. It also reduces productivity. Actions taken: No action taken. Recommendations: Reform employment protection legislation so as to harmonise key provisions across different types of contracts. In particular, severance pay should be uniformly set so that for all types of contracts it is initially low and then gradually increasing with tenure. Lower entry barriers in non-manufacturing industries. Entry barriers hold back resource reallocation, productivity and job creation. Actions taken: New legislation (Law of market unity) is being implemented to reduce the fragmentation of the regulatory framework across regions. The new Ground Transport Law (2013) affects both passengers and freight transport. It aims at reducing licensing requirements and, more broadly, administrative procedures, as well as increasing transparency and legal security. The liberalisation of passenger rail services has gradually started. Recommendations: Reduce the number of professions requiring membership of a professional body and the cost of membership. Improve competition in the retail electricity market. Reduce entry barriers in rail and maritime transport and in motor fuel markets. Pursue a full and swift implementation of the Law of market unity. Reform areas no longer considered a priority in Going for Growth For Spain, all priority areas from the 2013 issue of Going for Growth are maintained. ECONOMIC POLICY REFORMS 2015: GOING FOR GROWTH © OECD 2015 289 5. COUNTRY NOTES SPAIN Beyond GDP per capita: Other policy objectives A. Emissions per capita have risen since 1990 but remain below OECD average Average 2008-121 160 140 Total emissions per capita Real GDP per capita (2005 PPPs) Share in global GHG emissions: 2 0.7% 120 100 80 B. Households at the lower end of the income distribution have lost ground in both absolute and relative terms3 Average annual growth rate in real household disposable income, 2005-11 Income of the lower middle class 60 40 Median income 2 0 -2 -4 -6 Income of the poor Income of the upper middle class Income of the rich 20 0 1990=100 OECD=100 GDP per capita SPAIN OECD 1. Total GHG emissions including LULUCF in CO2 equivalents (UNFCCC). The OECD average (excluding Chile, Israel, Korea and Mexico) is calculated according to the same definition. 2. Share in world GHG emissions is calculated using International Energy Agency (IEA) data. 3. Household income across the distribution is measured by income standards with varying emphasis on different points of the distribution – from the low to the top-end of the distribution. See methodological notes at the end of the chapter for the computation of household income across the distribution. Source: Panel A: OECD, National Accounts and Energy (IEA) Databases; and United Nations Framework Convention on Climate Change (UNFCCC) Database. Panel B: OECD, National Accounts and Income Distribution Databases. 1 2 http://dx.doi.org/10.1787/888933178820 290 ECONOMIC POLICY REFORMS 2015: GOING FOR GROWTH © OECD 2015
