Post results note Peores resultados aunque mejor
Anuncio

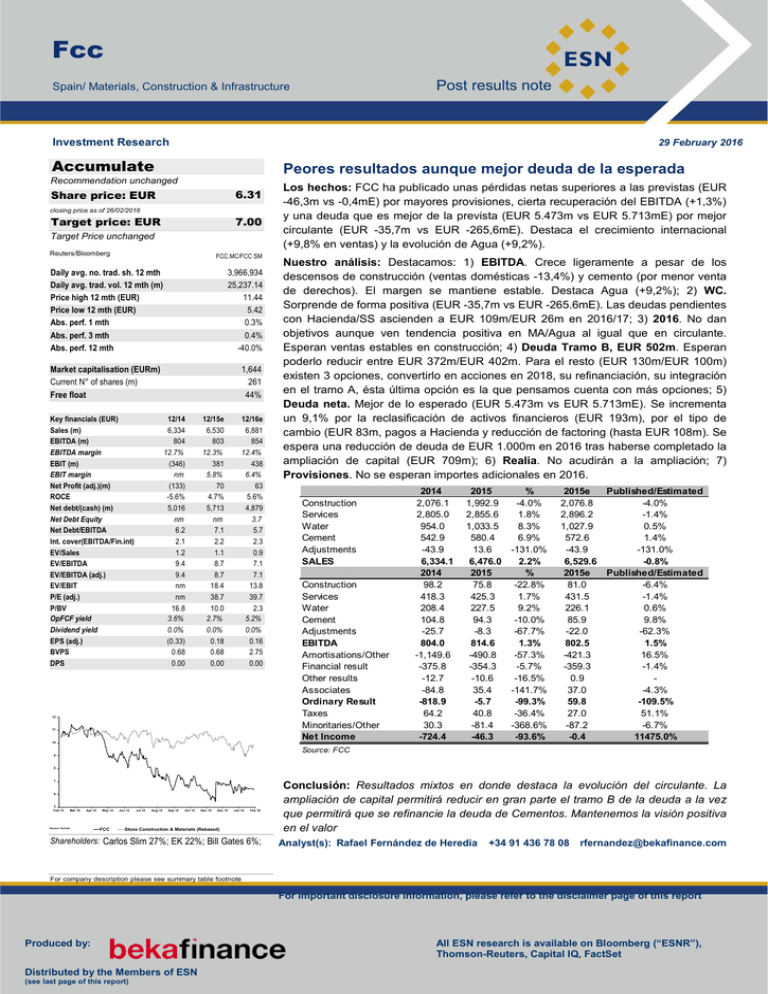
Fcc Post results note Spain/ Materials, Construction & Infrastructure Investment Research 29 February 2016 Accumulate Peores resultados aunque mejor deuda de la esperada Recommendation unchanged 6.31 Share price: EUR closing price as of 26/02/2016 Target price: EUR 7.00 Target Price unchanged Reuters/Bloomberg FCC.MC/FCC SM Daily avg. no. trad. sh. 12 mth Daily avg. trad. vol. 12 mth (m) Price high 12 mth (EUR) Price low 12 mth (EUR) Abs. perf. 1 mth Abs. perf. 3 mth Abs. perf. 12 mth 3,966,934 25,237.14 11.44 5.42 0.3% 0.4% -40.0% Market capitalisation (EURm) Current N° of shares (m) Free float 1,644 261 44% Key financials (EUR) Sales (m) EBITDA (m) EBITDA margin EBIT (m) EBIT margin Net Profit (adj.)(m) ROCE Net debt/(cash) (m) Net Debt Equity Net Debt/EBITDA Int. cover(EBITDA/Fin.int) EV/Sales EV/EBITDA EV/EBITDA (adj.) EV/EBIT P/E (adj.) P/BV OpFCF yield Dividend yield EPS (adj.) BVPS DPS 12/14 6,334 804 12.7% (346) nm (133) -5.6% 5,016 nm 6.2 2.1 1.2 9.4 9.4 nm nm 16.8 3.6% 0.0% (0.33) 0.68 0.00 12/15e 6,530 803 12.3% 381 5.8% 70 4.7% 5,713 nm 7.1 2.2 1.1 8.7 8.7 18.4 38.7 10.0 2.7% 0.0% 0.18 0.68 0.00 12/16e 6,881 854 12.4% 438 6.4% 63 5.6% 4,879 3.7 5.7 2.3 0.9 7.1 7.1 13.8 39.7 2.3 5.2% 0.0% 0.16 2.75 0.00 vvdsvdvsdy 12 11 10 Los hechos: FCC ha publicado unas pérdidas netas superiores a las previstas (EUR -46,3m vs -0,4mE) por mayores provisiones, cierta recuperación del EBITDA (+1,3%) y una deuda que es mejor de la prevista (EUR 5.473m vs EUR 5.713mE) por mejor circulante (EUR -35,7m vs EUR -265,6mE). Destaca el crecimiento internacional (+9,8% en ventas) y la evolución de Agua (+9,2%). Nuestro análisis: Destacamos: 1) EBITDA. Crece ligeramente a pesar de los descensos de construcción (ventas domésticas -13,4%) y cemento (por menor venta de derechos). El margen se mantiene estable. Destaca Agua (+9,2%); 2) WC. Sorprende de forma positiva (EUR -35,7m vs EUR -265.6mE). Las deudas pendientes con Hacienda/SS ascienden a EUR 109m/EUR 26m en 2016/17; 3) 2016. No dan objetivos aunque ven tendencia positiva en MA/Agua al igual que en circulante. Esperan ventas estables en construcción; 4) Deuda Tramo B, EUR 502m. Esperan poderlo reducir entre EUR 372m/EUR 402m. Para el resto (EUR 130m/EUR 100m) existen 3 opciones, convertirlo en acciones en 2018, su refinanciación, su integración en el tramo A, ésta última opción es la que pensamos cuenta con más opciones; 5) Deuda neta. Mejor de lo esperado (EUR 5.473m vs EUR 5.713mE). Se incrementa un 9,1% por la reclasificación de activos financieros (EUR 193m), por el tipo de cambio (EUR 83m, pagos a Hacienda y reducción de factoring (hasta EUR 108m). Se espera una reducción de deuda de EUR 1.000m en 2016 tras haberse completado la ampliación de capital (EUR 709m); 6) Realia. No acudirán a la ampliación; 7) Provisiones. No se esperan importes adicionales en 2016. Construction Services Water Cement Adjustments SALES Construction Services Water Cement Adjustments EBITDA Amortisations/Other Financial result Other results Associates Ordinary Result Taxes Minoritaries/Other Net Income 2014 2,076.1 2,805.0 954.0 542.9 -43.9 6,334.1 2014 98.2 418.3 208.4 104.8 -25.7 804.0 -1,149.6 -375.8 -12.7 -84.8 -818.9 64.2 30.3 -724.4 2015 % 1,992.9 -4.0% 2,855.6 1.8% 1,033.5 8.3% 580.4 6.9% 13.6 -131.0% 6,476.0 2.2% 2015 % 75.8 -22.8% 425.3 1.7% 227.5 9.2% 94.3 -10.0% -8.3 -67.7% 814.6 1.3% -490.8 -57.3% -354.3 -5.7% -10.6 -16.5% 35.4 -141.7% -5.7 -99.3% 40.8 -36.4% -81.4 -368.6% -46.3 -93.6% 2015e Published/Estimated 2,076.8 -4.0% 2,896.2 -1.4% 1,027.9 0.5% 572.6 1.4% -43.9 -131.0% 6,529.6 -0.8% 2015e Published/Estimated 81.0 -6.4% 431.5 -1.4% 226.1 0.6% 85.9 9.8% -22.0 -62.3% 802.5 1.5% -421.3 16.5% -359.3 -1.4% 0.9 37.0 -4.3% 59.8 -109.5% 27.0 51.1% -87.2 -6.7% -0.4 11475.0% Source: FCC 9 8 7 6 5 Feb 15 Mar 15 Apr 15 Source: Factset May 15 FCC Jun 15 Jul 15 Aug 15 Sep 15 Oct 15 Nov 15 Dec 15 Jan 16 Feb 16 Stoxx Construction & Materials (Rebased) Shareholders: Carlos Slim 27%; EK 22%; Bill Gates 6%; Conclusión: Resultados mixtos en donde destaca la evolución del circulante. La ampliación de capital permitirá reducir en gran parte el tramo B de la deuda a la vez que permitirá que se refinancie la deuda de Cementos. Mantenemos la visión positiva en el valor Analyst(s): Rafael Fernández de Heredia +34 91 436 78 08 rfernandez@bekafinance.com For company description please see summary table footnote For important disclosure information, please refer to the disclaimer page of this report Produced by: Distributed by the Members of ESN (see last page of this report) All ESN research is available on Bloomberg (“ESNR”), Thomson-Reuters, Capital IQ, FactSet Fcc Fcc: Summary tables PROFIT & LOSS (EURm) Sales Cost of Sales & Operating Costs Non Recurrent Expenses/Income EBITDA EBITDA (adj.)* Depreciation EBITA EBITA (adj)* Amortisations and Write Downs EBIT EBIT (adj.)* Net Financial Interest Other Financials Associates Other Non Recurrent Items Earnings Before Tax (EBT) Tax Tax rate Discontinued Operations Minorities Net Profit (reported) Net Profit (adj.) 12/2012 11,152 -10,399 0.0 753 753 -638 116 116 0.0 -403 -403 -445 -3.0 -128 -59.9 -1,039 164 15.8% -217 64.2 -1,028 -218 12/2013 6,726 -6,007 0.0 720 720 -424 296 296 0.0 -303 -303 -439 -11.2 59.0 -66.6 -761 136 17.8% -905 24.1 -1,506 -330 12/2014 6,334 -5,530 0.0 804 804 -404 400 400 0.0 -346 -346 -376 0.0 -84.8 -12.7 -819 64.2 7.8% 21.2 9.1 -724 -133 12/2015e 6,530 -5,727 0.0 803 803 -405 397 397 0.0 381 381 -359 0.0 37.0 0.9 59.9 27.0 28.0% -99.3 12.0 -0.4 70.4 12/2016e 6,881 -6,028 1.0 854 853 -416 438 437 0.0 438 437 -373 0.0 12.9 0.0 77.8 -19.5 25.0% 0.0 5.0 63.4 63.4 12/2017e 7,417 -6,483 2.0 934 932 -425 510 508 0.0 510 508 -399 0.0 13.1 0.0 124 -31.0 25.0% 0.0 -3.0 90.0 90.0 CASH FLOW (EURm) Cash Flow from Operations before change in NWC Change in Net Working Capital Cash Flow from Operations Capex Net Financial Investments Free Cash Flow Dividends Other (incl. Capital Increase & share buy backs) Change in Net Debt NOPLAT 12/2012 467 -146 321 -467 -62.8 -209 -153 -449 -810 -339 12/2013 284 257 542 -467 272 347 0.0 765 1,112 -249 12/2014 384 22.3 407 -300 42.1 149 -4.9 816 959 -318 12/2015e 418 -70.6 348 -300 -118 -70.0 0.0 -627 -697 275 12/2016e 509 -123 386 -300 -67.0 19.1 0.0 816 835 328 12/2017e 554 66.4 620 -300 -23.0 297 0.0 -61.0 236 381 BALANCE SHEET & OTHER ITEMS (EURm) Net Tangible Assets Net Intangible Assets (incl.Goodwill) Net Financial Assets & Other Total Fixed Assets Inventories Trade receivables Other current assets Cash (-) Total Current Assets Total Assets Shareholders Equity Minority Total Equity Long term interest bearing debt Provisions Other long term liabilities Total Long Term Liabilities Short term interest bearing debt Trade payables Other current liabilities Total Current Liabilities Total Liabilities and Shareholders' Equity Net Capital Employed Net Working Capital 12/2012 4,691 3,822 3,541 12,054 1,129 4,868 84.0 -1,603 7,684 19,738 1,260 462 1,722 4,650 1,115 2,778 8,542 4,041 2,411 3,022 9,474 19,738 12,702 648 12/2013 3,751 2,857 4,007 10,615 798 2,734 75.8 -1,380 4,987 15,602 3.2 240 243 1,137 1,092 3,153 5,382 6,218 3,414 345 9,977 15,602 10,463 -152 12/2014 3,176 2,968 2,713 8,856 761 2,399 89.4 -1,918 5,167 14,023 272 224 495 715 1,158 1,758 3,631 6,218 3,241 437 9,897 14,023 8,427 -429 12/2015e 3,340 2,815 2,713 8,869 784 2,612 92.1 -1,918 5,406 14,274 271 212 483 1,413 1,224 1,090 3,726 6,218 3,390 457 10,065 14,274 8,510 -359 12/2016e 3,444 2,663 2,713 8,820 826 2,960 97.1 -1,918 5,801 14,621 1,097 207 1,304 578 1,290 1,112 2,980 6,218 3,630 489 10,337 14,621 8,584 -236 12/2017e 3,495 2,510 2,713 8,718 891 3,170 105 -1,918 6,083 14,801 1,187 210 1,397 342 1,356 1,022 2,719 6,218 3,937 531 10,685 14,801 8,416 -302 GROWTH & MARGINS Sales growth EBITDA (adj.)* growth EBITA (adj.)* growth EBIT (adj)*growth 12/2012 -5.1% -39.8% -81.0% n.m. 12/2013 -39.7% -4.5% 156.1% n.m. 12/2014 -5.8% 11.7% 34.9% n.m. 12/2015e 3.1% -0.2% -0.6% n.m. 12/2016e 5.4% 6.2% 10.0% 14.6% 12/2017e 7.8% 9.3% 16.2% 16.2% Page 2 Fcc Fcc: Summary tables GROWTH & MARGINS Net Profit growth EPS adj. growth DPS adj. growth EBITDA (adj)* margin EBITA (adj)* margin EBIT (adj)* margin 12/2012 n.m. n.m. n.m. 6.8% 1.0% n.m. 12/2013 n.m. n.m. 12/2014 n.m. n.m. 12/2015e n.m. n.m. 12/2016e -10.0% -10.0% 12/2017e 42.1% 42.1% 10.7% 4.4% n.m. 12.7% 6.3% n.m. 12.3% 6.1% 5.8% 12.4% 6.3% 6.3% 12.6% 6.8% 6.8% RATIOS Net Debt/Equity Net Debt/EBITDA Interest cover (EBITDA/Fin.interest) Capex/D&A Capex/Sales NWC/Sales ROE (average) ROCE (adj.) WACC ROCE (adj.)/WACC 12/2012 4.1 9.4 1.7 73.2% 4.2% 5.8% -12.0% -3.7% 5.0% -0.7 12/2013 n.m. 8.3 1.6 110.2% 6.9% -2.3% -52.3% -3.9% 5.2% -0.7 12/2014 n.m. 6.2 2.1 74.2% 4.7% -6.8% -96.6% -5.6% 6.9% -0.8 12/2015e n.m. 7.1 2.2 74.0% 4.6% -5.5% 25.9% 4.7% 5.7% 0.8 12/2016e 3.7 5.7 2.3 72.2% 4.4% -3.4% 9.3% 5.6% 6.1% 0.9 12/2017e 3.3 5.0 2.3 70.6% 4.0% -4.1% 7.9% 6.7% 6.5% 1.0 PER SHARE DATA (EUR)*** Average diluted number of shares EPS (reported) EPS (adj.) BVPS DPS 12/2012 399.1 -2.58 -0.55 3.16 0.00 12/2013 399.1 -3.77 -0.83 0.01 0.00 12/2014 399.1 -1.81 -0.33 0.68 0.00 12/2015e 399.1 0.00 0.18 0.68 0.00 12/2016e 399.1 0.16 0.16 2.75 0.00 12/2017e 399.1 0.23 0.23 2.97 0.00 VALUATION EV/Sales EV/EBITDA EV/EBITDA (adj.)* EV/EBITA EV/EBITA (adj.)* EV/EBIT EV/EBIT (adj.)* P/E (adj.) P/BV Total Yield Ratio EV/CE OpFCF yield OpFCF/EV Payout ratio Dividend yield (gross) 12/2012 0.6 9.4 9.4 60.9 60.9 n.m. n.m. n.m. 2.1 0.0% 0.8 -17.1% -2.1% 0.0% 0.0% 12/2013 1.0 9.6 9.6 23.4 23.4 n.m. n.m. n.m. n.m. 0.3% 1.1 5.1% 1.1% 0.0% 0.0% 12/2014 1.2 9.4 9.4 18.8 18.8 n.m. n.m. n.m. 16.8 0.0% 1.3 3.6% 1.4% 0.0% 0.0% 12/2015e 1.1 8.7 8.7 17.6 17.6 18.4 18.4 38.7 10.0 0.0% 1.2 2.7% 0.7% 0.0% 0.0% 12/2016e 0.9 7.1 7.1 13.8 13.8 13.8 13.8 39.7 2.3 0.0% 1.0 5.2% 1.4% 0.0% 0.0% 12/2017e 0.8 6.2 6.2 11.4 11.4 11.4 11.4 28.0 2.1 0.0% 1.0 19.5% 5.5% 0.0% 0.0% EV AND MKT CAP (EURm) Price** (EUR) Outstanding number of shares for main stock Total Market Cap Net Debt o/w Cash & Marketable Securities (-) o/w Gross Debt (+) Other EV components Enterprise Value (EV adj.) Source: Company, BEKA Finance estimates. 12/2012 6.68 127.3 851 7,088 -1,603 8691 -886 7,053 12/2013 11.54 127.3 1,469 5,976 -1380 7,355 -513 6,932 12/2014 11.44 260.6 2,982 5,016 -1918 6,934 -475 7,523 12/2015e 6.82 260.6 1,777 5,713 -1918 7,631 -487 7,003 12/2016e 6.31 260.6 1,644 4,879 -1918 6,796 -492 6,030 12/2017e 6.31 260.6 1,644 4,642 -1918 6,560 -489 5,797 Notes * Where EBITDA (adj.) or EBITA (adj)= EBITDA (or EBITA) -/+ Non Recurrent Expenses/Income and where EBIT (adj)= EBIT-/+ Non Recurrent Expenses/Income - PPA amortisation **Price (in local currency): Fiscal year end price for Historical Years and Current Price for current and forecasted years Sector: Materials, Construction & Infrastructure/Construction Company Description: FCC is the leader in waste management in Spain, ranks third in Europe and is one of the main players in UK. In Spain, FCC is the second largest company in water management and is the fifth in Europe. It is also the leader in cement in Spain and is also the 3rd largest contractor Page 3 Fcc ESN Recommendation System The ESN Recommendation System is Absolute. It means that each stock is rated on the basis of a total return, measured by the upside potential (including dividends and capital reimbursement) over a 12 month time horizon. The ESN spectrum of recommendations (or ratings) for each stock comprises 5 categories: Buy (B), Accumulate (A), Neutral (N), Reduce (R) and Sell (S). Furthermore, in specific cases and for a limited period of time, the analysts are allowed to rate the stocks as Rating Suspended (RS) or Not Rated (NR), as explained below. Meaning of each recommendation or rating: • • • • • • • Buy: the stock is expected to generate total return of over 15% during the next 12 months time horizon Accumulate: the stock is expected to generate total return of 5% to 15% during the next 12 months time horizon Neutral: the stock is expected to generate total return of -5% to +5% during the next 12 months time horizon Reduce: the stock is expected to generate total return of -5% to -15% during the next 12 months time horizon Sell: the stock is expected to generate total return under -15% during the next 12 months time horizon Rating Suspended: the rating is suspended due to a change of analyst covering the stock or a capital operation (take-over bid, SPO, …) where the issuer of the document (a partner of ESN) or a related party of the issuer is or could be involved Not Rated: there is no rating for a company being floated (IPO) by the issuer of the document (a partner of ESN) or a related party of the issuer Certain flexibility on the limits of total return bands is permitted especially during higher phases of volatility on the markets BEKA Finance Ratings Breakdown Reduce 4% Neutral 18% Sell 0% Buy 48% Accumulate 30% Page 4 Fcc Recommendation history for FCC Date 12-Feb-16 18-Dec-15 17-Dec-15 18-Aug-15 09-Apr-15 28-Nov-14 30-Oct-13 26-Jul-13 11-Apr-13 Recommendation Accumulate Accumulate Neutral Neutral Neutral Neutral Accumulate Buy Buy Target price 7.00 6.92 6.92 9.45 11.79 12.27 13.06 8.42 6.35 Price at change date 6.44 6.94 5.42 8.11 11.15 11.21 11.90 7.33 5.16 Source: Factset & ESN, price data adjusted for stock splits. This chart shows BEKA Finance continuing coverage of this stock; the current analyst may or may not have covered it over the entire period. Current analyst: Rafael Fernández de Heredia (since 26/10/2006) 13 12 11 10 9 8 7 6 5 4 Jan Feb Mar Apr May Jun 15 15 15 15 15 15 Price history Buy Accumulat Jul 15 Aug Sep Oct Nov Dec Jan Feb 15 15 15 15 15 16 16 Target price history Neut Reduce Sell Not rated Information regarding Market Abuse and Conflicts of Interests and recommendation history available in our web page: www.bekafinance.com and our offices The information and opinions contained in this document have been compiled by BEKA Finance S.V., S.A., from sources believed to be reliable. This document is not intended to be an offer, or a solicitation to buy or sell relevant securities. BEKA Finance S.V., S.A., will not take any responsibility whatsoever for losses which may derive from use of the present document or its contents, BEKA Finance S.V., S.A., can occasionally have positions in some of the securities mentioned in this report, through its trading portfolio or negotiation. Additionally, there can exist a commercial relation between BEKA Finance S.V., S.A., and the mentioned companies. As of the date of this report, BEKA Finance S.V., S.A., • acts as agent or liquidity provider for the following companies: AB Biotics; Bioorganic Research Services SA; Carbures Europa SA; Euroepes S.A., Facephi Biometría SA., Lleidanetworks Serveis Telematics SA., NBI Bearings Europe S.A., Seafood Global Processor SA.; Trajano Iberia Socimi, SA:; • has in the last 12 months, participated as lead or co-lead manager in corporate operations with the following companies: Aena; Dogi International Fabrics SA; Lleidanetworks Serveis Telematics SA.NBI Bearings Europe S.A.¸ • has, during the last year, performed a significant amount of business with: Bankia; Carbures Europa SA; Ferrovial. • has a contractual relationship to provide financial services, through which BEKA Finance S.V.,S.A., executes orders on the treasury stocks of the following companies: CaixaBank S.A., Grupo Ezentis S.A; Sacyr SA. • has a liquidity contract as outlined by the CNMV's Circular 3/2007 with: FCC; Hispania Activos Inmobiliarios, S.A., Indra Sistemas; Sacyr. Page 5 Members of ESN (European Securities Network LLP) Disclaimer: These reports have been prepared and issued by the Members of European Securities Network LLP (‘ESN’). ESN, its Members and their affiliates (and any director, officer or employee thereof), are neither liable for the proper and complete transmission of these reports nor for any delay in their receipt. Any unauthorised use, disclosure, copying, distribution, or taking of any action in reliance on these reports is strictly prohibited. The views and expressions in the reports are expressions of opinion and are given in good faith, but are subject to change without notice. These reports may not be reproduced in whole or in part or passed to third parties without permission. The information herein was obtained from various sources. ESN, its Members and their affiliates (and any director, officer or employee thereof) do not guarantee their accuracy or completeness, and neither ESN, nor its Members, nor its Members’ affiliates (nor any director, officer or employee thereof) shall be liable in respect of any errors or omissions or for any losses or consequential losses arising from such errors or omissions. Neither the information contained in these reports nor any opinion expressed constitutes an offer, or an invitation to make an offer, to buy or sell any securities or any options, futures or other derivatives related to such securities (‘related investments’). These reports are prepared for the clients of the Members of ESN only. They do not have regard to the specific investment objectives, financial situation and the particular needs of any specific person who may receive any of these reports. Investors should seek financial advice regarding the appropriateness of investing in any securities or investment strategies discussed or recommended in these reports and should understand that statements regarding future prospects may not be realised. Investors should note that income from such securities, if any, may fluctuate and that each security’s price or value may rise or fall. Accordingly, investors may receive back less than originally invested. Past performance is not necessarily a guide to future performance. Foreign currency rates of exchange may adversely affect the value, price or income of any security or related investment mentioned in these reports. In addition, investors in securities such as ADRs, whose value are influenced by the currency of the underlying security, effectively assume currency risk. ESN, its Members and their affiliates may submit a pre-publication draft (without mentioning neither the recommendation nor the target price/fair value) of its reports for review to the Investor Relations Department of the issuer forming the subject of the report, solely for the purpose of correcting any inadvertent material inaccuracies. Like all members employees, analysts receive compensation that is impacted by overall firm profitability For further details about the specific risks of the company and about the valuation methods used to determine the price targets included in this report/note, please refer to the latest relevant published research on single stock or contact the analyst named on the front of the report/note. Research is available through your sales representative. ESN will provide periodic updates on companies or sectors based on company-specific developments or announcements, market conditions or any other publicly available information. Unless agreed in writing with an ESN Member, this research is intended solely for internal use by the recipient. Neither this document nor any copy of it may be taken or transmitted into Australia, Canada or Japan or distributed, directly or indirectly, in Australia, Canada or Japan or to any resident thereof. This document is for distribution in the U.K. Only to persons who have professional experience in matters relating to investments and fall within article 19(5) of the financial services and markets act 2000 (financial promotion) order 2005 (the “order”) or (ii) are persons falling within article 49(2)(a) to (d) of the order, namely high net worth companies, unincorporated associations etc (all such persons together being referred to as “relevant persons”). This document must not be acted on or relied upon by persons who are not relevant persons. Any investment or investment activity to which this document relates is available only to relevant persons and will be engaged in only with relevant persons. The distribution of this document in other jurisdictions or to residents of other jurisdictions may also be restricted by law, and persons into whose possession this document comes should inform themselves about, and observe, any such restrictions. By accepting this report you agree to be bound by the foregoing instructions. You shall indemnify ESN, its Members and their affiliates (and any director, officer or employee thereof) against any damages, claims, losses, and detriments resulting from or in connection with the unauthorized use of this document. For disclosure upon “conflicts of interest” on the companies under coverage by all the ESN Members and on each “company recommendation history”, please visit the ESN website (www.esnpartnership.eu) For additional information and individual disclaimer please refer to www.esnpartnership.eu and to each ESN Member websites: www.bancaakros.it regulated by the CONSOB - Commissione Nazionale per le Società e la Borsa www.bekafinance.com regulated by CNMV - Comisión Nacional del Mercado de Valores www.caixabi.pt regulated by the CMVM - Comissão do Mercado de Valores Mobiliários www.cmcicms.com regulated by the AMF - Autorité des marchés financiers www.equinet-ag.de regulated by the BaFin - Bundesanstalt für Finanzdienstleistungsaufsicht www.ibg.gr regulated by the HCMC - Hellenic Capital Market Commission www.pohjola.com regulated by the Financial Supervision Authority www.snssecurities.nl regulated by the AFM - Autoriteit Financiële Markten Fcc Spain Materials, Construction & Infrastructure Banca Akros S.p.A. Viale Eginardo, 29 20149 MILANO Italy Phone: +39 02 43 444 389 Fax: +39 02 43 444 302 equinet Bank AG Gräfstraße 97 60487 Frankfurt am Main Germany Phone:+49 69 – 58997 – 212 Fax:+49 69 – 58997 – 299 BEKA Finance C/ Marques de Villamagna 3 28001 Madrid Spain Phone: +34 91 436 7813 Investment Bank of Greece 32 Aigialeias Str & Paradissou, 151 25 Maroussi, Greece Tel: +30 210 81 73 383 Caixa-Banco de Investimento Rua Barata Salgueiro, nº 33 1269-057 Lisboa Portugal Phone: +351 21 313 73 00 Fax: +351 21 389 68 98 Pohjola Bank plc P.O.Box 308 FI- 00013 Pohjola Finland Phone: +358 10 252 011 Fax: +358 10 252 2703 CM - CIC Market Solutions 6, avenue de Provence 75441 Paris Cedex 09 France Phone: +33 1 53 48 80 78 Fax: +33 1 53 48 82 25 SNS Securities N.V. Nieuwezijds Voorburgwal 162 P.O.Box 235 1000 AE Amsterdam The Netherlands Phone: +31 20 550 8500 Fax: +31 20 626 8064


