PMP_C08_01_EN
Anuncio
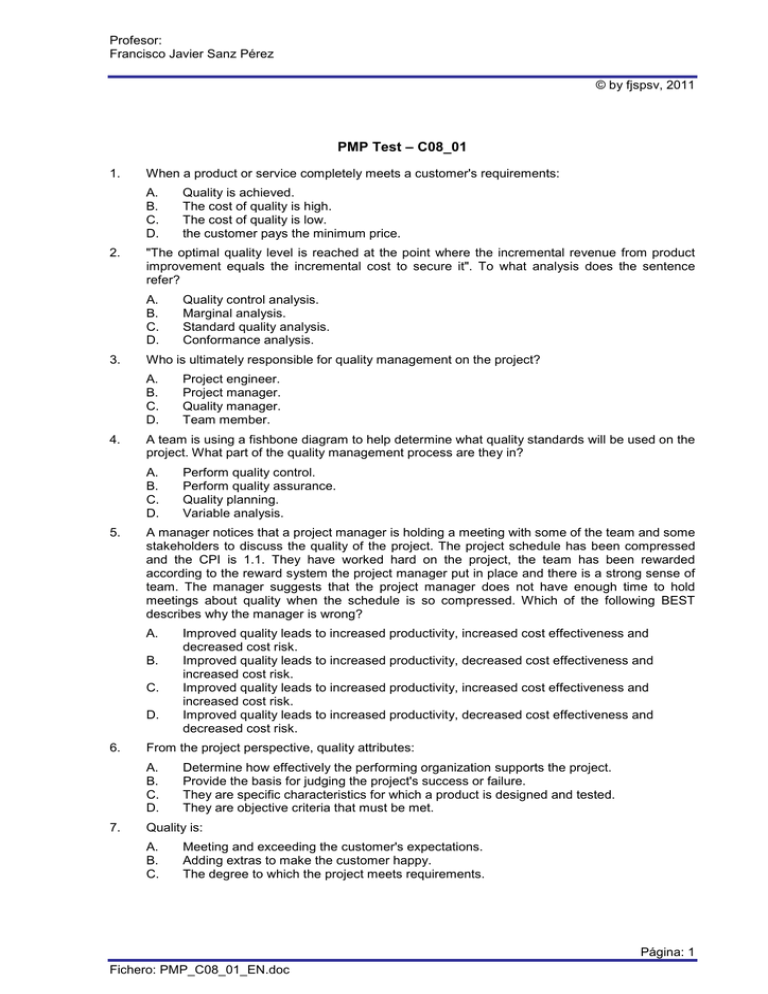
Profesor: Francisco Javier Sanz Pérez © by fjspsv, 2011 PMP Test – C08_01 1. When a product or service completely meets a customer's requirements: A. B. C. D. 2. "The optimal quality level is reached at the point where the incremental revenue from product improvement equals the incremental cost to secure it". To what analysis does the sentence refer? A. B. C. D. 3. B. C. D. Improved quality leads to increased productivity, increased cost effectiveness and decreased cost risk. Improved quality leads to increased productivity, decreased cost effectiveness and increased cost risk. Improved quality leads to increased productivity, increased cost effectiveness and increased cost risk. Improved quality leads to increased productivity, decreased cost effectiveness and decreased cost risk. From the project perspective, quality attributes: A. B. C. D. 7. Perform quality control. Perform quality assurance. Quality planning. Variable analysis. A manager notices that a project manager is holding a meeting with some of the team and some stakeholders to discuss the quality of the project. The project schedule has been compressed and the CPI is 1.1. They have worked hard on the project, the team has been rewarded according to the reward system the project manager put in place and there is a strong sense of team. The manager suggests that the project manager does not have enough time to hold meetings about quality when the schedule is so compressed. Which of the following BEST describes why the manager is wrong? A. 6. Project engineer. Project manager. Quality manager. Team member. A team is using a fishbone diagram to help determine what quality standards will be used on the project. What part of the quality management process are they in? A. B. C. D. 5. Quality control analysis. Marginal analysis. Standard quality analysis. Conformance analysis. Who is ultimately responsible for quality management on the project? A. B. C. D. 4. Quality is achieved. The cost of quality is high. The cost of quality is low. the customer pays the minimum price. Determine how effectively the performing organization supports the project. Provide the basis for judging the project's success or failure. They are specific characteristics for which a product is designed and tested. They are objective criteria that must be met. Quality is: A. B. C. Meeting and exceeding the customer's expectations. Adding extras to make the customer happy. The degree to which the project meets requirements. Página: 1 Fichero: PMP_C08_01_EN.doc Profesor: Francisco Javier Sanz Pérez © by fjspsv, 2011 D. 8. All the following are not specific tools of quality assurance except? A. B. C. D. 9. 68.26%. 99.99%. 95.46%. 99.73%. All of the following are part of quality audits except? A. B. C. D. 16. Far or near the estimate is from the highest estimate. Far or near the measurements is from the mean. Correct the sample is. Much time remains in the project. What percentage of the total distribution are 3 sigma from the mean equal to? A. B. C. D. 15. Rework Quality training Scrap Warranty costs Standard deviation is a measure of how: A. B. C. D. 14. Take too long. Provide more information than wanted. Be mutually exclusive. Show many defects. All of the following are examples of the cost of non conformance except? A. B. C. D. 13. Focus on the most critical issues to improve quality. Focus on stimulating thinking. Explore a desired future outcome. Determine if a process is functioning within set limits. Testing the entire population would: A. B. C. D. 12. Focus on the most critical issues to improve quality. Focus on stimulating thinking. Explore a desired future outcome. Determine if a process is out of control. A control chart helps the project manager: A. B. C. D. 11. Inspection. Process analysis. Pareto chart. Fishbone diagram. Pareto charts help the project manager: A. B. C. D. 10. Conformance to management's objectives. Determine whether project activities comply with organizational policies. Determine inefficient and ineffective quality policies. Validated defect repair. Confirm the implementation of approved change requests. A control chart shows seven data points in a row on one side of the mean. What should be done? A. B. C. D. Perform a design of experiments. Adjust the chart to reflect the new mean. Find an assignable and special cause. Nothing. This is the rule of seven and can be ignored. Página: 2 Fichero: PMP_C08_01_EN.doc Profesor: Francisco Javier Sanz Pérez © by fjspsv, 2011 17. You are managing a project in a “just in time” environment. This will require more attention in quality, because the amount of inventory in such an environment is generally: A. B. C. D. 18. An Ishikawa diagram helps to: A. B. C. D. 19. Marcas de referencia. Diagramas de flujo. Diagramas de barras. Diagramas de tendencia. La calidad en un proyecto debe ser muy alta, a pesar de que este tipo de proyectos es nuevo para la empresa. ¿Cuál de las siguiente acciones sería la mejor en este caso? A. B. C. D. 24. Determinar el problema tan pronto como sea posible. Permitir que se incumpla la planificación recortando los costes. Permitir un incremento del coste para fijar la causa origen del problema. Permitir un incremento del riesgo recortando los costes. La dirección de la empresa quiere comprobar cómo está funcionando un proyecto en comparación con otros anteriores. Para poder hacer un juicio válido, se debe comparar el proyecto con: A. B. C. D. 23. Quality analysis Perform quality assurance Perform quality control Quality planning Un proyecto ha tenido problemas graves con la calidad de los productos entregables. La dirección de la empresa establece que la calidad pasa a ser el condicionante más importante del proyecto. Si ocurre algún otro problema relacionado con la calidad, ¿cuál sería la mejor acción que podría hacer el Director del Proyecto? A. B. C. D. 22. Cost is most important, quality next, and then schedule. Quality is more important than cost or schedule. Schedule is most important, quality next, and then cost. It should be decided for each project. A project manager is using a cause and effect diagram with the team to determine various factors might be linked to potential problems. In what part of the quality management process is the project manager involved? A. B. C. D. 21. Put information in its order of priority. Explore quality problems root causes. Show team responsibilities. Show functional responsibilities. In planning your project, which would generally have the highest priority: quality, cost or schedule? A. B. C. D. 20. 45 percent. 10 percent. 12 percent. 0 percent. Auditar el trabajo completado para ver si es necesario hacer alguna mejora. Mejorar el sistema de autorización de trabajos. Usar diagramas de causa-efecto cuando se encuentre algún defecto. Asegurarse de que el Plan de Gestión de Personal está actualizado. Durante la ejecución de un proyecto, se aprueba una nueva versión de la ISO 9000 y el equipo de proyecto se reúne con el departamento de calidad para ver cómo esta norma se va a aplicar al proyecto. Esto sería parte ¿de qué proceso de gestión de la calidad? A. Planificación de la calidad. Página: 3 Fichero: PMP_C08_01_EN.doc Profesor: Francisco Javier Sanz Pérez © by fjspsv, 2011 B. C. D. 25. Realizar el control de la calidad. Análisis de la calidad. Realizar el aseguramiento de la calidad. Si un proceso está bajo control, ¿dónde deben estar situados los límites de control? A. B. C. D. Cerca de la causa conocida. Por encima del punto de independencia estadística. Dentro de los límites de especificación. Por debajo de la curva de distribución normal. Página: 4 Fichero: PMP_C08_01_EN.doc Profesor: Francisco Javier Sanz Pérez © by fjspsv, 2011 PMP Test – C08_01 Solution QUESTION 01 02 03 04 05 06 07 08 09 10 11 12 13 14 15 16 17 18 19 20 21 22 23 24 25 GROUP ANSWER Quality A Quality B Quality B Quality C Quality A Quality C Quality C Quality B Quality A Quality D Quality A Quality B Quality B Quality D Quality C Quality C Quality D Quality B Quality D Quality D Quality C Quality A Quality A Quality A Quality C Página: 5 Fichero: PMP_C08_01_EN.doc
