Reading 2011 Census
Anuncio
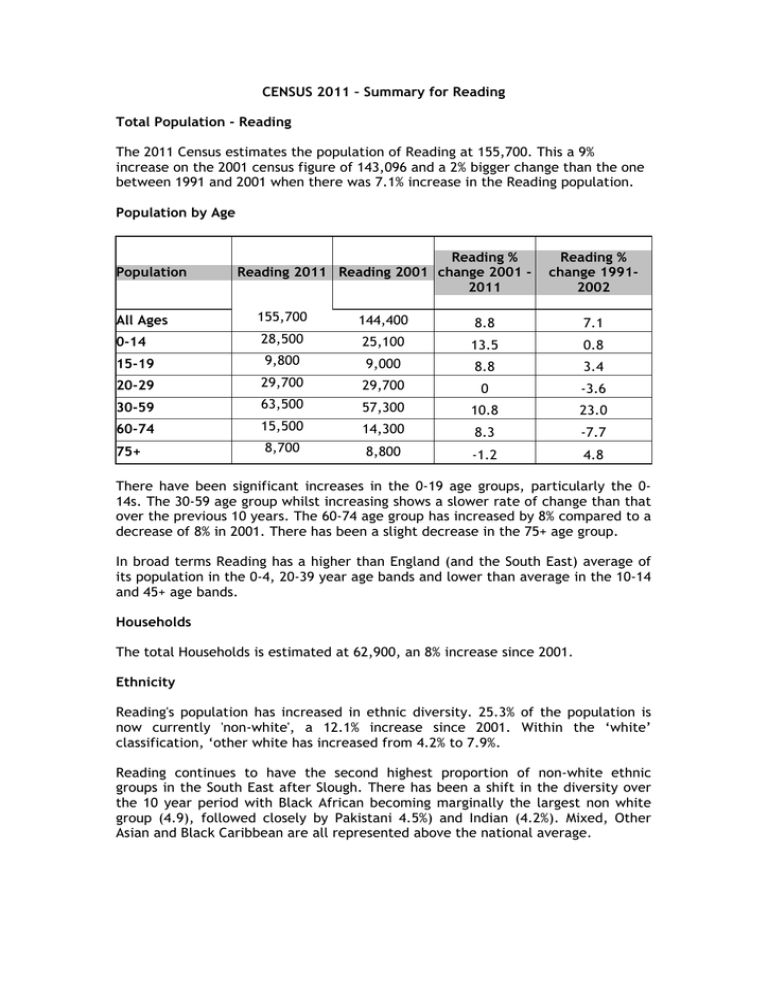
CENSUS 2011 – Summary for Reading Total Population - Reading The 2011 Census estimates the population of Reading at 155,700. This a 9% increase on the 2001 census figure of 143,096 and a 2% bigger change than the one between 1991 and 2001 when there was 7.1% increase in the Reading population. Population by Age Population Reading % Reading 2011 Reading 2001 change 2001 2011 Reading % change 19912002 All Ages 155,700 144,400 8.8 7.1 0-14 28,500 25,100 13.5 0.8 15-19 9,800 9,000 8.8 3.4 20-29 29,700 29,700 0 -3.6 30-59 63,500 57,300 10.8 23.0 60-74 15,500 14,300 8.3 -7.7 75+ 8,700 8,800 -1.2 4.8 There have been significant increases in the 0-19 age groups, particularly the 014s. The 30-59 age group whilst increasing shows a slower rate of change than that over the previous 10 years. The 60-74 age group has increased by 8% compared to a decrease of 8% in 2001. There has been a slight decrease in the 75+ age group. In broad terms Reading has a higher than England (and the South East) average of its population in the 0-4, 20-39 year age bands and lower than average in the 10-14 and 45+ age bands. Households The total Households is estimated at 62,900, an 8% increase since 2001. Ethnicity Reading's population has increased in ethnic diversity. 25.3% of the population is now currently 'non-white', a 12.1% increase since 2001. Within the ‘white’ classification, ‘other white has increased from 4.2% to 7.9%. Reading continues to have the second highest proportion of non-white ethnic groups in the South East after Slough. There has been a shift in the diversity over the 10 year period with Black African becoming marginally the largest non white group (4.9), followed closely by Pakistani 4.5%) and Indian (4.2%). Mixed, Other Asian and Black Caribbean are all represented above the national average. White British Reading 1991 Reading 2001 Reading 2011 England 2011 90.5% 86.80% 66.9% 80.9% 4.2% 7.9% 4.6% Other White Mixed (new category for 2001) Indian -- 2.4% 3.9% 2.2% 1.4% 1.7% 4.2% 2.6% Pakistani 2.2% 2.7% 4.5% 2.1% Other Asian 0.7% 0.8% 3.9% 2.3% Black Caribbean 2.7% 2.2% 2.1% 1.1% Black African 0.6% 1.6% 4.9% 1.8% Black other 0.8% 0.4% 0.7% 0.5 Chinese 0.4% 0.7% 1% 0.7% Other ethnic group 0.9% 0.7% 0.9% 1.% Source: Office for National Statistics, 2001 Census KS06. SASPAC Version 6. 2011 Table KS201EW 82.2% identify themselves as British wholly or partly compared with 91.6% nationally. 8.8% of households have no people in the household where English is a main language. This compares with 4.4% nationally. 14.8% (9,256) of households contain multiple ethnic groups compared to 8.9% nationally. Country of Birth The changing nature of diversity in Reading is further described in the change in the top ten countries of birth of Reading residents (outside Great Britain). Poland moves into the top three having been outside the rankings in 2001. Zimbabwe, Ghana, Hong Kong and Nigeria move into the top ten whilst Barbados, Kenya, France, Italy and USA move out having been in the top ten in 2001. Top ten Countries of birth of Reading residents (outside Great Britain) % of Reading Placing in Number of population 2001 people 2011 2011 4670 3% India 3 3919 2.5% Poland 3160 2.0% Pakistan 2 Republic of 1732 1.1% 1 Ireland 1042 0.7% Germany 4 827 0.5% Zimbabwe 818 0.5% South Africa 6 816 0.5% Ghana 785 0.5% Hong Kong 755 0.5% Nigeria Source: 2001 Census commissioned table C0413; 2011 Table QS203EW Religion Following Christian and 'no religion', the largest religious grouping in Reading in Muslim at 7.1%. This is a 3.1% increase on 2001. The proportion identifying as Christian has declined by 12% since 2011 with no religion increasing by 7.5%. Buddhism and Hinduism also show an increase since 2001. Reading 2001 Reading 2011 England 2011 Christian 62.6% 50% 59.4% Buddhist 0.5% 1.2% 0.5% Hindu 1.0% 3.6% 1.5% Jewish 0.3% 0.2% 0.5% Muslim 4.0% 7.1% 5.0% Sikh 0.6% 0.6% 0.8% Other religions 0.4% 0.5% 0.4% No religion 22.0% 29.5% 24.7% Religion not stated 8.7% 7.3% 7.2% Source: Office for National Statistics, 2001 Census KS07. SASPAC Version 6 2011 Table KS209EW Health and Care Reading 2001 Reading 2011 England 2011 People with limiting long-term illness 13.5% 13.0% 17.6% Provision of unpaid care: % persons 7.7% 8.0% 10.3% Good 72.5% 85.5% 81.4% Fairly good 21.1% 10.8 13.1 Not good 6.5% 3.7% 5.4 People whose health is: Source: Office for National Statistics, 2001 Census KS08. SASPAC Version 6, ONS 2012 Table KS301EW Employment and Qualifications Qualifications The percentage of the Reading Population with no qualifications has decreased from 22.8% to 17.4% since the last census. This mirrors the national picture. Reading people achieving Level 3 & level 4 qualification has increased with the most significant increase for those achieving level 4 and above with a 6.5% increase from 2001 to 34.8%. This is above the level achieved for the South East (29.9%) and England (27.4%). Percentage of people aged 16 - 74 achieving qualifications England South East Highest Level of Qualification No qualifications Highest level of qualification: Level 1 qualifications Highest level of qualification: Level 2 qualifications Highest level of qualification: Apprenticeship Highest level of qualification: Level 3 qualifications Highest level of qualification: Level 4 qualifications and above Highest level of qualification: Other qualifications Reading 2001 2011 2001 2011 2001 2011 28.9 22.5 23.9 19.1 22.8 17.4 16.6 13.3 17.1 13.5 15 12.2 19.4 15.2 21.2 15.9 17.4 12.3 N/A 3.6 N/A 3.6 N/A 2.5 8.3 12.4 9.2 12.8 11.5 13.4 19.9 27.4 21.7 29.9 28.3 34.8 6.9 5.7 6.8 5.2 5 7.4 Source 2011 Census Table KS501EW, 2001 table KS13 Economic Activity Unemployed Unemployment for all ages has increased for Reading, this reflects the national picture. The most significant increase has occurred in the long term unemployed with an increase from 0.6% at 2001 census to 1.9%. Percentage of people aged 16-74 unemployed by area 2001 & 2011 England South East Reading Unemployment: age / category 2001 2011 2001 2011 2001 2011 Unemployed: Age 16 to 24 0.9 1.2 0.6 0.9 0.7 1.1 Unemployed: Age 50 to 74 0.6 0.8 0.5 0.7 0.4 0.8 Unemployed: Never worked 0.3 0.7 0.1 0.4 0.2 0.7 Long-term unemployed1 1 1.7 0.2 1.3 0.6 1.9 Source 2011 Census table KS601EW Economic activity. 2001 Census table KS09a Economically Active Part time employment has increased and full time employment decreased. The most significant increase has been for those who are economically active but unemployed from 2-5 – 4.6%. Those who are self employed have also increased. Percentage of people aged 16 -74 economically active by area 2001 England South East Economically Active - Category 2001 2011 2001 2011 Economically active: Employee: Parttime 11.8 13.7 12.2 13.8 Economically active: Employee: Fulltime 40.8 38.6 43.2 40.4 & 2011 Reading 2001 2011 10.2 11.9 48.1 44.6 Economically active: Self-employed 8.3 9.8 9.6 11.0 6.9 7.9 3.3 4.4 2.3 3.4 2.5 4.6 2.6 3.4 2.7 3.3 4.1 Source 2011 Census table KS601EW Economic activity. 2001 Census table KS09a 5.0 Economically active: Unemployed Economically active: Full-time student 1 A person is defined as long-term unemployed at the time of the 2011 Census if they were unemployed and the year they last worked was 2009 or earlier Economically Inactive Percentage of people aged 16 -74 economically inactive by area 2001 & 2011 England South East Reading Economically Inactive 2001 2011 2001 2011 2001 2011 Economically inactive: Retired 13.5 13.7 13.4 13.7 9.8 8.6 Economically inactive: Student (including full-time students) 4.7 5.8 4.2 5.2 7 8.0 Economically inactive: Looking after home or family 6.5 4.4 6.5 4.4 5.6 4.6 Economically inactive: Long-term sick or disabled 5.3 4.0 4.4 2.9 3 Economically inactive: Other 3.1 2.2 2.4 1.8 2.8 Source 2011 Census table KS601EW Economic activity. 2001 Census table KS09a 2.8 2.2 Hours Worked Nationally, regionally and locally those working part time have increased and the percentage of the population working full time has reduced. Working part-time is defined as working 30 hours or less per week. This applies to the number of hours a person aged 16 to 74 in employment in the week before the census worked in their main job, and includes paid and unpaid overtime. Hours worked, percentage of population aged 16 -74 by area England South East Reading Hours Worked 2001 2011 2001 2011 2001 2011 Part-time: 15 hours or less worked 8.30 9.6 8.1 10.3 7.5 9.5 Part-time: 16 to 30 hours worked 16.3 19.4 15.7 18.3 13.6 15.7 Full-time: 31 to 48 hours worked 59.1 57.6 57.5 56.8 64.6 63.0 Full-time: 49 or more hours worked 16.3 13.3 17.8 14.6 14.3 11.7 Source 2011 Census: KS604EW Hours worked, local authorities. 2001 Census table KS10. Hours worked is the average number of hours worked a week for the last four weeks before the Census (29 April 2001) Occupation Professional occupation types have shown the most significant increase since 2001 census 24.5% of the Reading Population employed in this sector, well above the regional and England percentage of 18.7% and 17.5% respectively. Managers, Directors and senior officials have reduced by 6% for Reading and by similar levels in the South East & nationally. Service occupations have increased and administrative occupations decreased. Other occupation types are reasonably static compared to 2001 census results. Percentage of working population aged 16 -74 by Occupation Type England South East Reading Occupation Type 2001 2011 2001 2011 2001 2011 1. Managers, directors and senior officials 15 10.9 17 12.3 15 9.0 2. Professional occupations 11 17.5 12 18.7 16 24.5 3. Associate professional and technical occupations 14 12.8 15 13.8 15 13.5 4. Administrative and secretarial occupations 13 11.5 14 11.5 14 10.0 5. Skilled trades occupations 12 11.4 11 11.1 9 9.0 6. Caring, leisure and other service occupations 7 9.3 7 9.3 5 8.5 7. Sales and customer service occupations 8 8.4 7 7.9 9 9.0 8. Process, plant and machine operatives 8 7.2 6 5.7 6 5.1 9. Elementary occupations 12 11.1 10 9.7 11 11.4 2011 Census: KS608EW Occupation, local authorities. 2001 Census table KS12a Occupation groups Industry Percentage of working population aged 16 -74 in employment by Industry England South East Reading Comments Industry 2001 2011 2001 2011 2001 2011 A Agriculture, forestry and fishing 1.5 0.8 1.4 0.7 0.6 0.1 B Mining and quarrying 0.2 0.2 0.2 0.1 0.2 0.3 C Manufacturing 14.8 8.8 12.1 7.2 9 4.9 D Electricity, gas, steam and air conditioning supply E Water supply; sewerage, waste management and remediation activities 0.6 0.7 0.6 0.7 0.7 0.6 1.2 0.7 1.1 F Construction 6.8 7.7 7.1 8.0 6.5 6.2 G Wholesale and retail trade; repair of motor vehicles and motor cycles 16.9 15.9 16.3 15.6 16.3 15.5 H Transport and storage 7.1 5.0 8.1 5.2 9 4.6 Fishing reported separately in 2001 2001 classification: People aged 16-74 in employment working in: Electricity; gas and water supply 2001 classification: Transport storage and communication Percentage of working population aged 16 -74 in employment by Industry England South East Reading Comments Industry 2001 2011 2001 2011 2001 2011 2001 Classification I Accommodation and food 4.7 5.6 4.3 5.0 4.3 5.9 working in Hotels service activities and catering J Information and 4.1 5.5 11.1 communication K Financial and insurance 4.8 4.4 5.1 4.5 6.1 4.1 activities L Real estate activities 13.2 1.5 15.6 1.4 21.2 1.0 M Professional, scientific and technical activities 6.7 7.5 9.1 N Administrative and support service activities 4.9 5.2 5.7 O Public administration and defence; compulsory social security 5.7 5.9 5.9 6.0 4.7 4.7 P Education 7.7 9.9 7.8 10.1 7.7 9.7 Q Human health and social work activities 10.7 12.4 9.8 11.6 8.1 10.9 Working in Real estate; renting and business activities Not included in 2001 classification R, S, T, U Other 5.2 5.0 5.3 5.1 5 4.3 Source 2011 Census: KS605EW Industry. 2001 Census table KS11a Industry of Employment References Offices for National Statistics 2011 Census: Key Statistics for local authorities in England and Wales, published 11th December 2012. Notes 2001 source tables presented in number format only Prepared 20th December 2012
