IgA + IgG + IgM id IgA + IgG + IgM
Anuncio
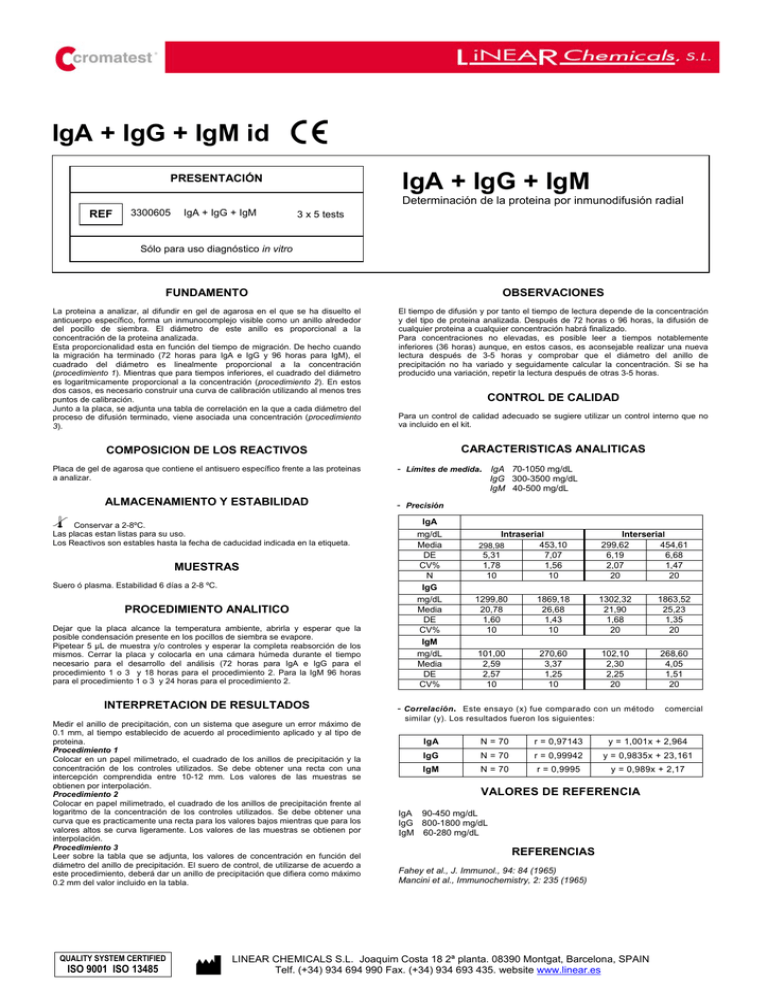
IgA + IgG + IgM id IgA + IgG + IgM PRESENTACIÓN Determinación de la proteina por inmunodifusión radial REF 3300605 IgA + IgG + IgM 3 x 5 tests Sólo para uso diagnóstico in vitro FUNDAMENTO OBSERVACIONES La proteina a analizar, al difundir en gel de agarosa en el que se ha disuelto el anticuerpo específico, forma un inmunocomplejo visible como un anillo alrededor del pocillo de siembra. El diámetro de este anillo es proporcional a la concentración de la proteina analizada. Esta proporcionalidad esta en función del tiempo de migración. De hecho cuando la migración ha terminado (72 horas para IgA e IgG y 96 horas para IgM), el cuadrado del diámetro es linealmente proporcional a la concentración (procedimiento 1). Mientras que para tiempos inferiores, el cuadrado del diámetro es logaritmicamente proporcional a la concentración (procedimiento 2). En estos dos casos, es necesario construir una curva de calibración utilizando al menos tres puntos de calibración. Junto a la placa, se adjunta una tabla de correlación en la que a cada diámetro del proceso de difusión terminado, viene asociada una concentración (procedimiento 3). El tiempo de difusión y por tanto el tiempo de lectura depende de la concentración y del tipo de proteina analizada. Después de 72 horas o 96 horas, la difusión de cualquier proteina a cualquier concentración habrá finalizado. Para concentraciones no elevadas, es posible leer a tiempos notablemente inferiores (36 horas) aunque, en estos casos, es aconsejable realizar una nueva lectura después de 3-5 horas y comprobar que el diámetro del anillo de precipitación no ha variado y seguidamente calcular la concentración. Si se ha producido una variación, repetir la lectura después de otras 3-5 horas. COMPOSICION DE LOS REACTIVOS CARACTERISTICAS ANALITICAS Placa de gel de agarosa que contiene el antisuero específico frente a las proteinas a analizar. ALMACENAMIENTO Y ESTABILIDAD Conservar a 2-8ºC. Las placas estan listas para su uso. Los Reactivos son estables hasta la fecha de caducidad indicada en la etiqueta. MUESTRAS Suero ó plasma. Estabilidad 6 días a 2-8 ºC. PROCEDIMIENTO ANALITICO Dejar que la placa alcance la temperatura ambiente, abrirla y esperar que la posible condensación presente en los pocillos de siembra se evapore. Pipetear 5 µL de muestra y/o controles y esperar la completa reabsorción de los mismos. Cerrar la placa y colocarla en una cámara húmeda durante el tiempo necesario para el desarrollo del análisis (72 horas para IgA e IgG para el procedimiento 1 o 3 y 18 horas para el procedimiento 2. Para la IgM 96 horas para el procedimiento 1 o 3 y 24 horas para el procedimiento 2. INTERPRETACION DE RESULTADOS Medir el anillo de precipitación, con un sistema que asegure un error máximo de 0.1 mm, al tiempo establecido de acuerdo al procedimiento aplicado y al tipo de proteina. Procedimiento 1 Colocar en un papel milimetrado, el cuadrado de los anillos de precipitación y la concentración de los controles utilizados. Se debe obtener una recta con una intercepción comprendida entre 10-12 mm. Los valores de las muestras se obtienen por interpolación. Procedimiento 2 Colocar en papel milimetrado, el cuadrado de los anillos de precipitación frente al logaritmo de la concentración de los controles utilizados. Se debe obtener una curva que es practicamente una recta para los valores bajos mientras que para los valores altos se curva ligeramente. Los valores de las muestras se obtienen por interpolación. Procedimiento 3 Leer sobre la tabla que se adjunta, los valores de concentración en función del diámetro del anillo de precipitación. El suero de control, de utilizarse de acuerdo a este procedimiento, deberá dar un anillo de precipitación que difiera como máximo 0.2 mm del valor incluido en la tabla. QUALITY SYSTEM CERTIFIED ISO 9001 ISO 13485 CONTROL DE CALIDAD Para un control de calidad adecuado se sugiere utilizar un control interno que no va incluido en el kit. - Límites de medida. IgA 70-1050 mg/dL IgG 300-3500 mg/dL IgM 40-500 mg/dL - Precisión IgA mg/dL Media DE CV% N IgG mg/dL Media DE CV% IgM mg/dL Media DE CV% Intraserial 453,10 5,31 7,07 1,78 1,56 10 10 298,98 Interserial 299,62 454,61 6,19 6,68 2,07 1,47 20 20 1299,80 20,78 1,60 10 1869,18 26,68 1,43 10 1302,32 21,90 1,68 20 1863,52 25,23 1,35 20 101,00 2,59 2,57 10 270,60 3,37 1,25 10 102,10 2,30 2,25 20 268,60 4,05 1,51 20 - Correlación. Este ensayo (x) fue comparado con un método comercial similar (y). Los resultados fueron los siguientes: IgA N = 70 r = 0,97143 y = 1,001x + 2,964 IgG N = 70 r = 0,99942 y = 0,9835x + 23,161 IgM N = 70 r = 0,9995 y = 0,989x + 2,17 VALORES DE REFERENCIA IgA 90-450 mg/dL IgG 800-1800 mg/dL IgM 60-280 mg/dL REFERENCIAS Fahey et al., J. Immunol., 94: 84 (1965) Mancini et al., Immunochemistry, 2: 235 (1965) LINEAR CHEMICALS S.L. Joaquim Costa 18 2ª planta. 08390 Montgat, Barcelona, SPAIN Telf. (+34) 934 694 990 Fax. (+34) 934 693 435. website www.linear.es IgA + IgG + IgM id IgA + IgG + IgM CONTENTS Identification of the protein by radial immunodiffusion REF 3300605 IgA + IgG + IgM 3 x 5 tests For in vitro diagnostic use only PRINCIPLE NOTES The examined protein, diffusing in agarose gel containing a specific antibody will form an immuno-complex, visible as a ring around the well. The ring diameter is in proportion to the concentration of the analyzed protein. The proportion corresponds to the diffusion time. In fact, at the end (72 h for IgA and IgG, 96 h for IgM), the square of the diameter will be in linear proportion to the concentration (procedure 1), while after a shorter period of time the square of the diameter will be in a logarithmic proportion to the concentration (procedure 2). In both cases, a calibration curve should be constructed, using at least three calibration points. However, a reference table is provided showing the relation between any concentration and the diameter at the end of the analysis time. The diffusion time and the reading time depend on the concentration and the specific diffusing protein. After 72 hours or 96 hours, the diffusion of the protein, at any concentration, is completed. For lower concentrations, it is possible to read at lower times (ie 36 h). However, in such cases it is advisable to read again after 3-5 hours. If the diameter is still the same, it is possible to set the concentration, on the contrary, if the diameter is different, the ring should be remeasured after a further 3-5 hours. QUALITY CONTROL It is suggested to perform an internal quality control. Not included in the kit. REAGENT COMPOSITION Plate with agarose gel containing the antiserum for the specific proteins to be analyzed. ANALYTICAL PERFORMANCE - Measure´s limit. IgA 70-1050 mg/dL IgG 300-3500 mg/dL IgM 40-500 mg/dL STORAGE AND STABILITY - Precision Store at 2-8ºC. The plates are ready to be used. The Reagents are stable until the expiry date stated on the label. SAMPLES Serum or plasma. Stable six days at 2-8 ºC. ASSAY PROCEDURE Allow the plate to come to room temperature, open it and, if moisture is present on the wells, wait until it has evaporated. Withdraw 5 µL of samples and/or controls and wait until it has been completely absorbed before handling the plate. Cover it tightly and place it in a moist chamber during the incubation time (72 h for for IgA and IgG for the procedure 1 or 3, 18 hours for the procedure 2. For IgM 96 hours for the procedure 1 or 3 , 24 hours for the procedure 2). READING TEST RESULTS Measure the precipitation ring to the nearest 0.1 mm, after the required period according to the procedure should be followed, and the type of protein. Procedure 1 Reproduce on a plotting paper, the square of the precipitation rings and the concentration of the controls. A line with an intercept should be in the range 10-12 mm2. Sample values are determined by interpolation. IgA mg/dL Mean SD CV% N IgG mg/dL Mean SD CV% IgM mg/dL Mean SD CV% Intra-assay 453.10 5.31 7.07 1.78 1.56 10 10 298.98 Inter.-assay 299.62 454.61 6.19 6.68 2.07 1.47 20 20 1299.80 20.78 1.60 10 1869.18 26.68 1.43 10 1302.32 21.90 1.68 20 1863.52 25.23 1.35 20 101.00 2.59 2.57 10 270.60 3.37 1.25 10 102.10 2.30 2.25 20 268.60 4.05 1.51 20 - Correlation. This assay (x) was compared with a similar comercial method (y). The results were: IgA N = 70 r = 0.97143 y = 1.001x + 2.964 IgG N = 70 r = 0.99942 y = 0.9835x + 23.161 IgM N = 70 r = 0.9995 y = 0.989x + 2.17 REFERENCE VALUES Procedure 2 Reproduce on a plotting paper, the square of the precipitation rings against their concentration logarithms. The graph will be a straight line only for a low values. For high values may curve a little. Sample values are obtained by interpolation. Procedure 3 Read on the enclosed Reference Table, the concentration value corresponding to the precipitation ring diameter. The ring value obtained for the control should have a confidence limit of 0.2 mm (from the reference table). QUALITY SYSTEM CERTIFIED ISO 9001 ISO 13485 IgA 90-450 mg/dL IgG 800-1800 mg/dL IgM 60-280 mg/dL REFERENCES Fahey et al., J. Immunol., 94: 84 (1965) Mancini et al., Immunochemistry, 2: 235 (1965) LINEAR CHEMICALS S.L. Joaquim Costa 18 2ª planta. 08390 Montgat, Barcelona, SPAIN Telf. (+34) 934 694 990 Fax. (+34) 934 693 435. website www.linear.es RI33006-1/0404
