1 TOTAL MICROSCALE ANALYTICAL CHEMISTRY
Anuncio
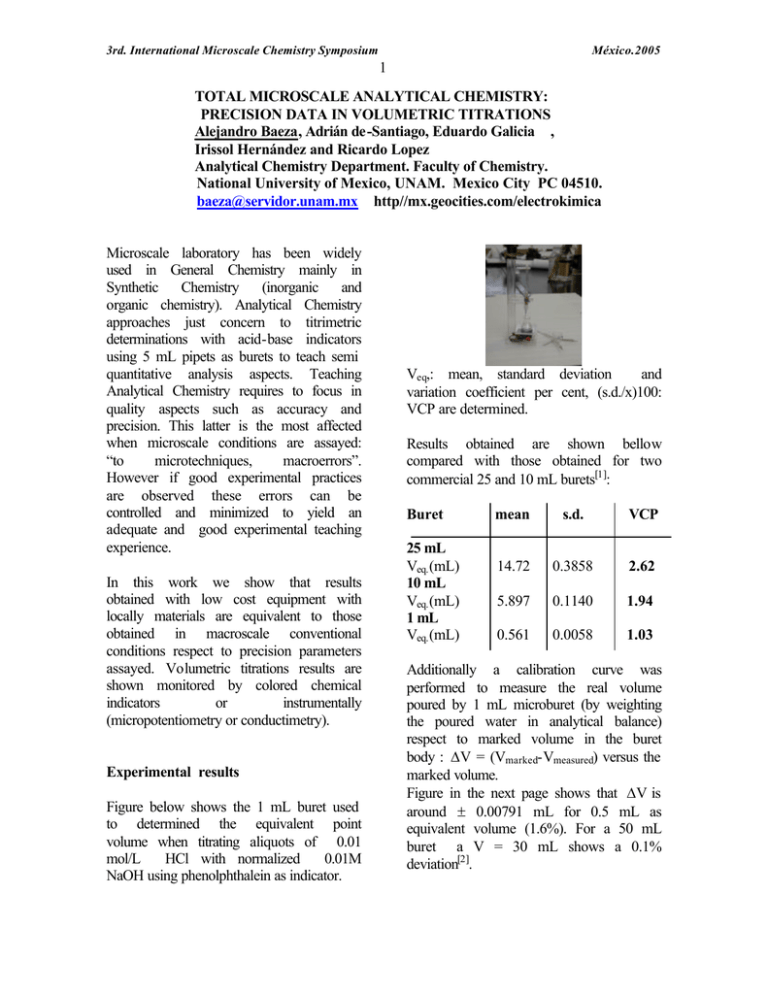
3rd. International Microscale Chemistry Symposium México.2005 1 TOTAL MICROSCALE ANALYTICAL CHEMISTRY: PRECISION DATA IN VOLUMETRIC TITRATIONS Alejandro Baeza, Adrián de-Santiago, Eduardo Galicia , Irissol Hernández and Ricardo Lopez Analytical Chemistry Department. Faculty of Chemistry. National University of Mexico, UNAM. Mexico City PC 04510. baeza@servidor.unam.mx http//mx.geocities.com/electrokimica Microscale laboratory has been widely used in General Chemistry mainly in Synthetic Chemistry (inorganic and organic chemistry). Analytical Chemistry approaches just concern to titrimetric determinations with acid-base indicators using 5 mL pipets as burets to teach semi quantitative analysis aspects. Teaching Analytical Chemistry requires to focus in quality aspects such as accuracy and precision. This latter is the most affected when microscale conditions are assayed: “to microtechniques, macroerrors”. However if good experimental practices are observed these errors can be controlled and minimized to yield an adequate and good experimental teaching experience. In this work we show that results obtained with low cost equipment with locally materials are equivalent to those obtained in macroscale conventional conditions respect to precision parameters assayed. Volumetric titrations results are shown monitored by colored chemical indicators or instrumentally (micropotentiometry or conductimetry). Experimental results Figure below shows the 1 mL buret used to determined the equivalent point volume when titrating aliquots of 0.01 mol/L HCl with normalized 0.01M NaOH using phenolphthalein as indicator. Veq,: mean, standard deviation and variation coefficient per cent, (s.d./x)100: VCP are determined. Results obtained are shown bellow compared with those obtained for two commercial 25 and 10 mL burets[1]: Buret 25 mL Veq. (mL) 10 mL Veq. (mL) 1 mL Veq. (mL) mean s.d. VCP 14.72 0.3858 2.62 5.897 0.1140 1.94 0.561 0.0058 1.03 Additionally a calibration curve was performed to measure the real volume poured by 1 mL microburet (by weighting the poured water in analytical balance) respect to marked volume in the buret body : ∆V = (Vmarked-Vmeasured) versus the marked volume. Figure in the next page shows that ∆V is around ± 0.00791 mL for 0.5 mL as equivalent volume (1.6%). For a 50 mL buret a V = 30 mL shows a 0.1% deviation[2]. 3rd. International Microscale Chemistry Symposium México.2005 2 For n= 30 next results were obtained: ∆∆V = f ( V m a r k e d ) (A) 0.0990 mL 0.0011 1.16% 0.01 ∆ 0.01 V marked , [mL] 0.00 0.00 0.10 0.20 0.30 0.40 0.50 0.60 0.70 0.80 0.90 1.00 -0.01 -0.01 mean s.d. VCP (B) 0.0980 mL 0.0008 0.84% -0.02 End point monitoring potentiometrically were performed with low cost microelectrodes: Wº or PANI as pH sensors in aqueous [3,4] and non aqueous solvents, Cº for redox and complexometric titrations and Agº for halide titrations[5]. -0.02 -0.03 -0.03 -0.04 -0.04 A redox titration of 0.5 mL 0.1N sodium tiosulphate with KMnO4 0.1 N was additionally performed . The average Veq found was 0.61 mL± 0.01 (n=17, VCP = 1.99%). Visual indication was used. In all cases above, insulin syringes were used to deliver 0.5 mL samples to titrate. In order to know the precision associated to these syringes used as pipetting devices, measurements of the weight of water delivered with a 1 mL insuline syringe were performed and compared with those obtained with a commercial automatic pipet. The figure below show the pipets assayed. Next figure shows typical average potentiometric titrations: (a) pH non aqueous solution titration of 1 mL of 0.2M 2-6 lutidine with 0.4 M methane sulphonic acid with a PANI micro pH sensor in acetonitrile as solvent (n=5): pH (a) 19 16 13 10 7 0 200 400 600 800 1000 1200 [µ µ L] and (b) 0.5 mL of 0.1 M NaCl with 0.1 M AgNO3 with a silver rod microsensor with no salt bridge separation (n=10): (A) (B) 3rd. International Microscale Chemistry Symposium México.2005 3 (b) 7.00 pe 900 800 6.00 700 5.00 E(mv) 600 4.00 500 400 3.00 300 200 2.00 100 [ µµL ] d e A g ( I ) 1.00 0 100 200 300 400 500 600 700 800 0 900 0 0.2 0.4 0.6 0.8 1 mL note: pe = E(mV)/60 (mV) Conclusions Next figure shows the microsensors used Wº Reference Electrode Cº Finally a conductimetric experimental set up design in our laboratory is used to determine the equivalence point in acidbase titrations. C and W rods use for potentiometry can be used as conductors connected to a oscillographic interphase to measure the conductivity of the titrated solution. Figures below show the experimental set up used and a typical 0.1M HCl-0.1 M NaOH conductimetric titration average plot (n=10). Precision in microscale conditions is suitable enough to ensure a good experimental teaching in volumetric analysis. References 1) Alejandro Baeza “Microbureta a Microescala Total para Totulometría” Rev. Chil. Educ. Cient. 1[2](2003)4-7 2) Daniel C. Harris. Quantitative Chemical Analysis.” Fifth Edition. W.H. Freeman and Co.(1998)55i. 3) A lejandro Baeza “Titulaciones ácido-base Potenciométricas a Microescala Total con Microsensores de pH y de Referenciade Bajo Costo” Rev. Chil. Educ. Cient. 1[2](2003)16-19 4) Juan Vargas, Alejandro Baeza, Tatiana Urzúa, Jorge Rodríguez, Lizethly Cáceres. “Titulaciones ácido-base a Microescala Química usando Microsensores de pH y Microelectrodo de Referencia: Adquisición de Datos con nuevas Tecnologías Rev. Chil. Educ. Cient. 2[2](2004)25-29 5) Alejandro Baeza. Adrián de Santiago, Eduardo Galicia. “Titulaciones de Halogenuros a microescala Total con Microsensores de Ag y de Microrefrencia de Bajo Costo Sin Puente Salino” Rev. Chil. Educ. Cient. 3[[ 1]] (2004)22-25 3rd. International Microscale Chemistry Symposium México.2005 4
