At a glance - European Parliament
Anuncio
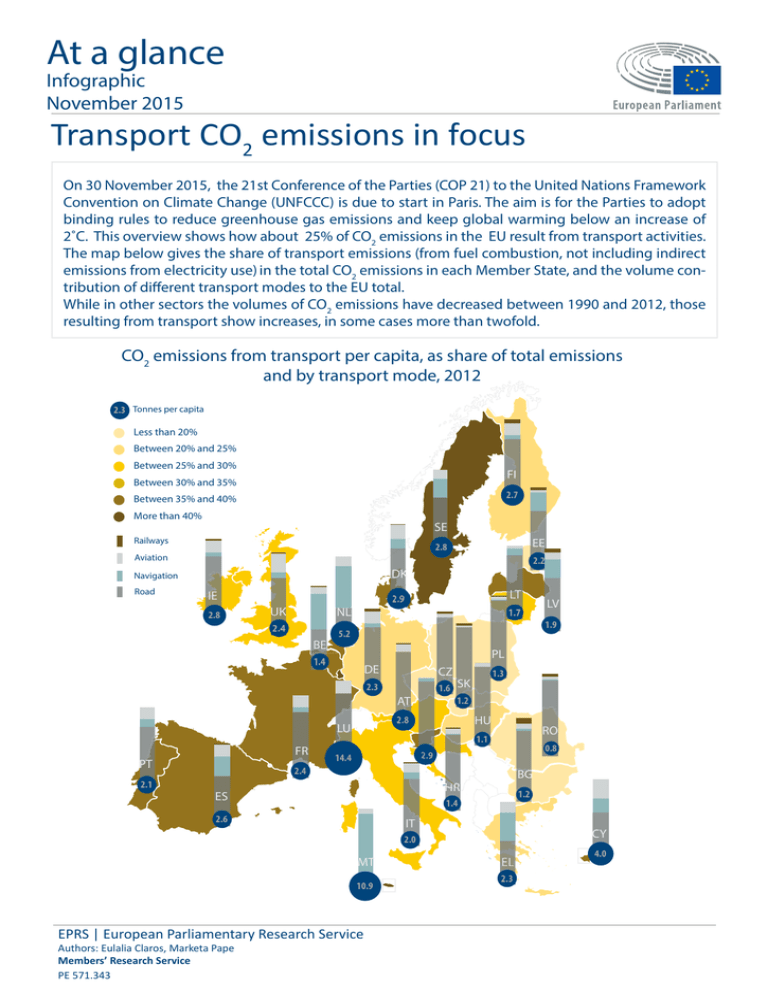
At a glance Infographic November 2015 Transport CO2 emissions in focus On 30 November 2015, the 21st Conference of the Parties (COP 21) to the United Nations Framework Convention on Climate Change (UNFCCC) is due to start in Paris. The aim is for the Parties to adopt binding rules to reduce greenhouse gas emissions and keep global warming below an increase of 2˚C. This overview shows how about 25% of CO2 emissions in the EU result from transport activities. The map below gives the share of transport emissions (from fuel combustion, not including indirect emissions from electricity use) in the total CO2 emissions in each Member State, and the volume contribution of different transport modes to the EU total. While in other sectors the volumes of CO2 emissions have decreased between 1990 and 2012, those resulting from transport show increases, in some cases more than twofold. CO2 emissions from transport per capita, as share of total emissions and by transport mode, 2012 2.3 Tonnes per capita Less than 20% Between 20% and 25% Between 25% and 30% FI Between 30% and 35% 2.7 Between 35% and 40% More than 40% SE Railways 2.2 DK Navigation Road IE 2.8 LT 2.9 UK NL 2.4 BE 1.7 PL DE CZ 2.3 1.6 AT FR 1.3 SK 1.2 HU 2.8 LU PT RO 1.1 0.8 2.9 14.4 2.4 BG HR ES 1.2 1.4 2.6 IT CY 2.0 MT 10.9 EPRS | European Parliamentary Research Service Authors: Eulalia Claros, Marketa Pape Members’ Research Service PE 571.343 LV 1.9 5.2 1.4 2.1 EE 2.8 Aviation EL 2.3 4.0 EPRS Transport CO2 emissions in focus (Million tonnes) EU28 CO2 emissions from transport, by transport mode Evolution of EU CO2 transport emissions by volume, 1990 - 2012 1500 1200 Million tonnes Railways&Other Aviation 900 Navigation 600 Road Railways Aviation Navigation 300 Road 0 1990 1990 1992 1992 1994 1996 1998 1998 2000 2000 2002 2002 2004 2004 2006 2006 2008 2008 2010 2010 2012 2012 CO2 emissions by Member State - 2012 compared to 1990 461 % change 150 Transport † 100 Total 50 0 -50 -100 PL CZ IE PT CY AT ES NL HR BE SK HU BG RO SE FR UK IT DK EL DE FI EE LV LT MT LU SI EU28 CO2 emissions by sector CO2 emissions in the EU: 1990 - 2012 changes, and situation in 2012 EU28 CO2 emissions by sector 1990=100 150 1990=100 150 Other: 8% Other: Residential: 8% 12% Residential: 12% Transport 120 Transport 120 Residential Energy Industries Other * 90 Other * Industry Industry 60 60 1990 1990 1992 1992 1994 1994 1996 1996 1998 1998 2000 2000 2002 2002 2004 2004 2006 2006 2008 2008 Transport Total Energy Industries: 2012 Energy40% Transport: Industries: 25% 2012 40% Transport: 25% Industry: 15% Industry: 15% Energy Industries Residential 90 1990=100 2010 2010 2012 2012 Data Source: European Commission, 2015. Notes: † Including emissions from international bunkers, which are not included in the Total emissions. * Other includes emissions from commerce, institutions and agriculture. Country codes: Austria (AT), Belgium (BE), Bulgaria (BG), Croatia (HR), Cyprus (CY), Czech Republic (CZ), Denmark (DK), Estonia (EE), Finland (FI), France (FR), Germany (DE), Greece (EL), Hungary (HU), Ireland (IE), Italy (IT), Latvia (LV), Lithuania (LT), Luxembourg (LU), Malta (MT), Netherlands (NL), Poland (PL), Portugal (PT), Romania (RO), Slovakia (SK), Slovenia (SI), Spain (ES), Sweden (SE), United Kingdom (UK), European Union (EU28). Disclaimer and Copyright. The content of this document is the sole responsibility of the authors and any opinions expressed therein do not necessarily represent the official position of the European Parliament. It is addressed to the Members and staff of the EP for their parliamentary work. Reproduction and translation for non-commercial purposes are authorised, provided the source is acknowledged and the European Parliament is given prior notice and sent a copy. © European Union, 2015. eprs@ep.europa.eu – http://www.eprs.ep.parl.union.eu (intranet) – http://www.europarl.europa.eu/thinktank (internet) – http://epthinktank.eu (blog) Members’ Research Service Page 2 of 2
