Comparison of the National Institutes of Health Stroke Scale With
Anuncio
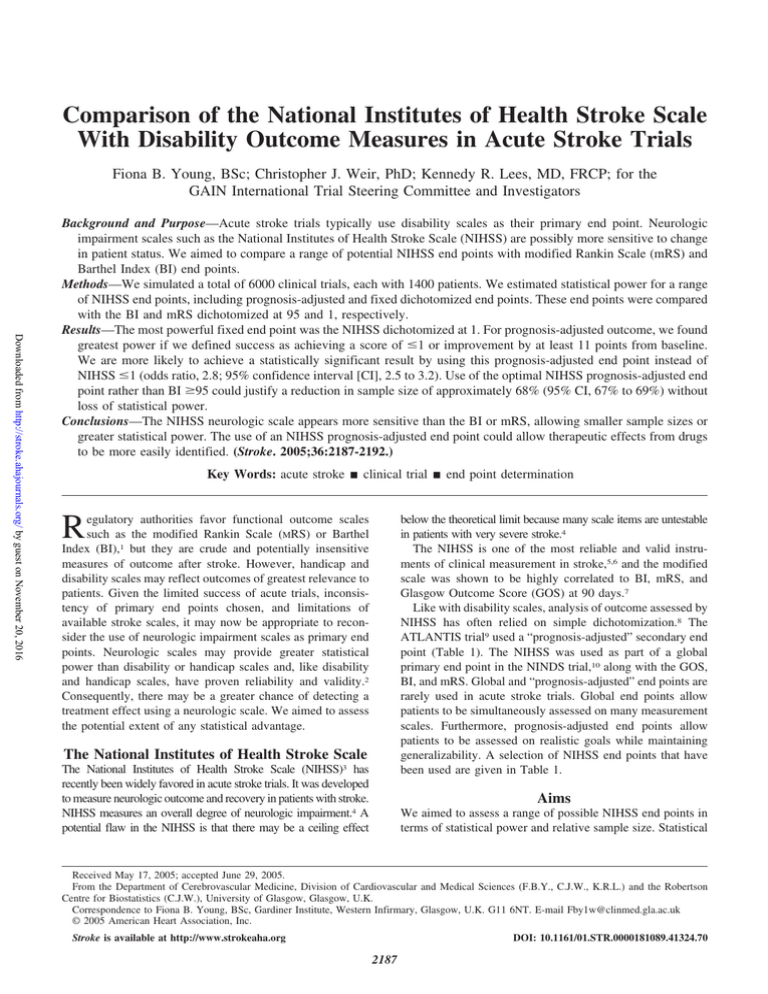
Comparison of the National Institutes of Health Stroke Scale With Disability Outcome Measures in Acute Stroke Trials Fiona B. Young, BSc; Christopher J. Weir, PhD; Kennedy R. Lees, MD, FRCP; for the GAIN International Trial Steering Committee and Investigators Downloaded from http://stroke.ahajournals.org/ by guest on November 20, 2016 Background and Purpose—Acute stroke trials typically use disability scales as their primary end point. Neurologic impairment scales such as the National Institutes of Health Stroke Scale (NIHSS) are possibly more sensitive to change in patient status. We aimed to compare a range of potential NIHSS end points with modified Rankin Scale (mRS) and Barthel Index (BI) end points. Methods—We simulated a total of 6000 clinical trials, each with 1400 patients. We estimated statistical power for a range of NIHSS end points, including prognosis-adjusted and fixed dichotomized end points. These end points were compared with the BI and mRS dichotomized at 95 and 1, respectively. Results—The most powerful fixed end point was the NIHSS dichotomized at 1. For prognosis-adjusted outcome, we found greatest power if we defined success as achieving a score of ⱕ1 or improvement by at least 11 points from baseline. We are more likely to achieve a statistically significant result by using this prognosis-adjusted end point instead of NIHSS ⱕ1 (odds ratio, 2.8; 95% confidence interval [CI], 2.5 to 3.2). Use of the optimal NIHSS prognosis-adjusted end point rather than BI ⱖ95 could justify a reduction in sample size of approximately 68% (95% CI, 67% to 69%) without loss of statistical power. Conclusions—The NIHSS neurologic scale appears more sensitive than the BI or mRS, allowing smaller sample sizes or greater statistical power. The use of an NIHSS prognosis-adjusted end point could allow therapeutic effects from drugs to be more easily identified. (Stroke. 2005;36:2187-2192.) Key Words: acute stroke 䡲 clinical trial 䡲 end point determination R egulatory authorities favor functional outcome scales such as the modified Rankin Scale (MRS) or Barthel Index (BI),1 but they are crude and potentially insensitive measures of outcome after stroke. However, handicap and disability scales may reflect outcomes of greatest relevance to patients. Given the limited success of acute trials, inconsistency of primary end points chosen, and limitations of available stroke scales, it may now be appropriate to reconsider the use of neurologic impairment scales as primary end points. Neurologic scales may provide greater statistical power than disability or handicap scales and, like disability and handicap scales, have proven reliability and validity.2 Consequently, there may be a greater chance of detecting a treatment effect using a neurologic scale. We aimed to assess the potential extent of any statistical advantage. below the theoretical limit because many scale items are untestable in patients with very severe stroke.4 The NIHSS is one of the most reliable and valid instruments of clinical measurement in stroke,5,6 and the modified scale was shown to be highly correlated to BI, mRS, and Glasgow Outcome Score (GOS) at 90 days.7 Like with disability scales, analysis of outcome assessed by NIHSS has often relied on simple dichotomization.8 The ATLANTIS trial9 used a “prognosis-adjusted” secondary end point (Table 1). The NIHSS was used as part of a global primary end point in the NINDS trial,10 along with the GOS, BI, and mRS. Global and “prognosis-adjusted” end points are rarely used in acute stroke trials. Global end points allow patients to be simultaneously assessed on many measurement scales. Furthermore, prognosis-adjusted end points allow patients to be assessed on realistic goals while maintaining generalizability. A selection of NIHSS end points that have been used are given in Table 1. The National Institutes of Health Stroke Scale The National Institutes of Health Stroke Scale (NIHSS)3 has recently been widely favored in acute stroke trials. It was developed to measure neurologic outcome and recovery in patients with stroke. NIHSS measures an overall degree of neurologic impairment.4 A potential flaw in the NIHSS is that there may be a ceiling effect Aims We aimed to assess a range of possible NIHSS end points in terms of statistical power and relative sample size. Statistical Received May 17, 2005; accepted June 29, 2005. From the Department of Cerebrovascular Medicine, Division of Cardiovascular and Medical Sciences (F.B.Y., C.J.W., K.R.L.) and the Robertson Centre for Biostatistics (C.J.W.), University of Glasgow, Glasgow, U.K. Correspondence to Fiona B. Young, BSc, Gardiner Institute, Western Infirmary, Glasgow, U.K. G11 6NT. E-mail Fby1w@clinmed.gla.ac.uk © 2005 American Heart Association, Inc. Stroke is available at http://www.strokeaha.org DOI: 10.1161/01.STR.0000181089.41324.70 2187 2188 Stroke TABLE 1. NIHSS End Points Used in Acute Stroke Trials Type of End Point Primary Secondary or additional Downloaded from http://stroke.ahajournals.org/ by guest on November 20, 2016 Post hoc analysis October 2005 End Point Study Dichotomized ⱕ1 ATLANTIS9 Part of global ⱕ1 NINDS (part 2)10 Improvement by ⱖ4 NINDS (part 1)10 Dichotomized ⱕ1 GAIN–Americas11 GAIN–International12 PROACT13 PROACT II14 Citicoline15 Dichotomized ⱕ7 Lubeluzole16 Improvement by ⱖ11 ATLANTIS9 Median RANTTAS17 ASSIST18 ECASS19 Median change from baseline ECASS II20 ASSIST18 Part of global ⱕ1 ECASS II21 power is the probability that a statistical test will identify a treatment effect (where one truly exists) at a given significance level and sample size.22 Additionally, the NIHSS end points are compared with BI and mRS end points. Methods For this study, we used a bootstrap simulation approach,23 which has been already been used to assess disability end points.24 We based our work on data from the GAIN international trial.12 The GAIN trial was neutral; however, to avoid any bias, only the placebo patients were used. We generated 6000 clinical trials, each with 1400 patients split equally between active treatment and placebo groups. Patients were simulated by randomly sampling with replacement from the GAIN data. The characteristics of the simulated patients were based on real examples from the GAIN trial, preserving the correlation among the NIHSS, Oxford classification, and final outcome. The simulated placebo and treatment groups were generated slightly differently. The simulated treatment group was forced to have slightly milder stroke (assessed by NIHSS at baseline). The difference between the average baseline NIHSS for the 2 groups was 1, 2, or 3 points (“treatment level”). The simulated treatment group patients were selected from subgroups with similar clinical characteristics as the sampled placebo patients to avoid confounding by other factors. Figure 1 details the simulation technique. In generating a “treatment” effect that separated the groups by a small difference in baseline NIHSS, we were effectively making an assumption about how neuroprotection or reperfusion would translate into neurologic function in the first few hours after treatment. We anticipate that an effective treatment would limit the extent of infarction and thus be equivalent to presentation with a slightly milder event, but that thereafter, the pattern of recovery and associated final outcome at 90 days would relate to initial severity in an identical manner to any other patient presenting with a stroke of Figure 1. Flowchart to show the simulation method used. Young et al TABLE 2. NIHSS vs Disability Outcome Measures 2189 Statistical Power Obtained for Each End Point Treatment Level* End Point 1 2 3 ⱕ1 0.286 (0.268–0.302) 0.833 (0.819–0.843) 0.993 (0.992–0.994) ⱕ3 0.230 (0.215–0.246) 0.814 (0.802–0.826) 0.998 (0.998–0.999) ⱕ5 0.194 (0.181–0.207) 0.647 (0.631–0.663) 0.992 (0.991–0.993) ⱕ7 0.205 (0.193–0.220) 0.558 (0.539–0.577) 0.980 (0.978–0.982) ⱕ1- or ⱖ2-point improvement 0.330 (0.306–0.349) 0.906 (0.894–0.915) 0.992 (0.991–0.993) ⱕ1 -or ⱖ5-point improvement 0.449 (0.425–0.473) 0.945 (0.937–0.951) 1.000 (1.000–1.000) ⱕ1- or ⱖ7-point improvement 0.576 (0.552–0.600) 0.977 (0.974–0.980) 1.000 (1.000–1.000) ⱕ1- or ⱖ9-point improvement 0.501 (0.476–0.523) 0.968 (0.964–0.972) 1.000 (1.000–1.000) ⱕ1- or ⱖ11-point improvement 0.617 (0.594–0.637) 0.984 (0.981–0.986) 1.000 (1.000–1.000) ⱕ1- or ⱖ13-point improvement 0.353 (0.336–0.372) 0.886 (0.876–0.897) 1.000 (1.000–1.000) ⱕ1- or ⱖ15-point improvement 0.397 (0.377–0.419) 0.905 (0.897–0.913) 0.998 (0.998–0.999) ⱖ2-point improvement 0.384 (0.364–0.406) 0.926 (0.918–0.934) 0.995 (0.994–0.996) ⱖ5-point improvement 0.324 (0.302–0.344) 0.914 (0.904–0.921) 1.000 (1.000–1.000) ⱖ7-point improvement 0.550 (0.529–0.571) 0.927 (0.920–0.935) 0.997 (0.997–0.998) ⱖ9-point improvement 0.264 (0.247–0.283) 0.793 (0.779–0.809) 0.998 (0.998–0.999) ⱖ11-point improvement 0.469 (0.448–0.489) 0.793 (0.777–0.807) 0.990 (0.988–0.991) ⱖ13-point improvement 0.228 (0.211–0.244) 0.324 (0.304–0.341) 0.917 (0.910–0.925) ⱖ15-point improvement 0.158 (0.143–0.170) 0.183 (0.168–0.197) 0.538 (0.516–0.560) 0.262 (0.247–0.279) 0.832 (0.818–0.844) 0.996 (0.996–0.997) Dichotomy Prognosis-adjusted Downloaded from http://stroke.ahajournals.org/ by guest on November 20, 2016 Improvement only Global Dichotomy† *Magnitude of treatment effect in NIHSS points. †Global end point included BI ⱖ95, mRS ⱕ1 and NIHSS ⱕ1. Parentheses contain the 95% CI for the power. that milder degree. The extent of the simulated treatment effect was equivalent to generating an improvement of 1, 2, or 3 NIHSS points in stroke severity. We also assumed that all patients benefit from treatment. The effect of different patterns of treatment effect have been explored elsewhere and found to have limited impact.24 We assessed several different types of end point. The 90-day NIHSS was dichotomized at 1, 3, 5, and 7. Prognosis-adjusted end points were also included: each patient was considered to have a favorable outcome if they achieved either a score of NIHSS ⱕ1 or an improvement from baseline of more than n points, where n ranged from 2 to 15. End points that simply assessed whether a patient had improved from baseline by n points were also included: n ranged from 2 to 15. Finally, a global end point was considered, incorporating the dichotomizations BI ⱖ95, mRS ⱕ1, and NIHSS ⱕ1. Each of the clinical trials was assessed by Pearson’s chi square for dichotomized end points and by generalized estimating equations25 for the global end points. The statistical power and 95% confidence intervals were estimated using a bootstrap approach. Relative sample sizes, showing the trial size that would be required to maintain the statistical power of a reference end point, were assessed using standard sample size equations.26,27 End points were also compared using logistic regression28 controlling for treatment level. Results The most powerful dichotomized end point for distinguishing between treatment groups was the ⱕ1 end point (Table 2). The power tended to decrease as cutpoints were moved toward higher NIHSS values. All of the prognosis-adjusted end points were more powerful than the ⱕ1 dichotomized end point (Table 2). Simply assessing whether the patient improved by at least a certain number of NIHSS points tended to be less powerful than the prognosis-adjusted end points. The inclusion of BI ⱖ95 and mRS ⱕ1 with NIHSS ⱕ1 in a global end point had similar power to the NIHSS ⱕ1 dichotomized end point. The results in Table 3 are given in terms of a relative sample size. By using any of the prognosis-adjusted end points instead of the ⱕ1 dichotomy, the sample size can be reduced without a reduction in power. The odds of reaching a statistically significant result were increased by 188% (95% confidence interval [CI], 158% to 221%) if the prognosis-adjusted (NIHSS ⱕ1 or ⱖ11-point improvement) end point was used instead of the ⱕ1 dichotomized end point. The ⱕ1 or improvement by 11 points or more prognosis-adjusted end point was clearly the most powerful of all end points tested across all treatment levels (see Figure 2). We have previously shown the BI ⱖ95 and mRS ⱕ1 to be the best available disability end points,23 in this study, the NIHSS end points tended to be more powerful. If the NIHSS ⱕ1 dichotomy were to be used instead of BI ⱖ95, the relative sample size required to maintain the statistical power would be around 62% (see Table 4). The NIHSS end points showed similar advantages over mRS ⱕ1. 2190 Stroke October 2005 TABLE 3. Comparison of End Points in Terms of Relative Sample Size Required Treatment Level* End Point 1 2 3 Dichotomy ⱕ1 100 100 ⱕ3 130.9 (122.3–139.4) 104.8 (101.0–108.9) 81.3 (77.3–86.7) ⱕ5 162.3 (151.9–172.7) 156.1 (149.9–163.0) 101.3 (95.1–110.7) ⱕ7 151.0 (141.3–160.7) 192.3 (184.3–200.9) 120.7 (111.4–138.4) 100 Prognosis-adjusted Downloaded from http://stroke.ahajournals.org/ by guest on November 20, 2016 ⱕ1- or ⱖ2-point improvement 84.1 (78.4–90.0) 79.4 (76.9–82.1) 101.9 (95.7–111.6) ⱕ1- or ⱖ5-point improvement 58.0 (53.9–62.1) 67.4 (65.4–69.6) 57.1 (54.7–60.4) ⱕ1- or ⱖ7-point improvement 42.0 (39.0–45.0) 54.4 (53.0–56.0) 56.4 (53.9–59.7) ⱕ1- or ⱖ9-point improvement 50.6 (47.0–54.1) 58.6 (56.9–62.3) 51.0 (48.9–54.0) ⱕ1- or ⱖ11-point improvement 38.1 (35.4–40.9) 50.9 (49.4–52.1) 47.1 (45.0–49.9) ⱕ1- or ⱖ13-point improvement 77.7 (72.3–83.1) 85.1 (82.3–88.1) 66.0 (63.1–70.0) ⱕ1- or ⱖ15-point improvement 67.6 (62.7–72.3) 79.7 (77.1–82.4) 80.7 (76.9–86.0) ⱖ2-point improvement 70.1 (65.3–75.1) 73.3 (71.0–75.7) 95.0 (89.9–103.0) ⱖ5-point improvement 86.1 (80.3–92.1) 77.1 (74.7–97.7) 47.9 (45.7–50.6) ⱖ7-point improvement 44.7 (41.6–48.0) 73.14 (70.9–75.6) 87.23 (83.0–93.7) ⱖ9-point improvement 110.0 (102.7–117.4) 110.4 (106.4–114.9) 81.3 (77.3–86.7) ⱖ11-point improvement 55.0 (51.1–59.0) 110.6 (106.6–115.0) 106.9 (100.0–118.1) ⱖ13-point improvement 132.1 (123.6–140.9) 337.6 (362.6–393.9 ) 174.1 (153.4–226.6) ⱖ15-point improvement 212.0 (199.0–225.1) 764.4 (737.0–794.0) 462.3 (381.6–552.0) 111.4 (103.9–118.6) 100.3 (96.7–104.1) 91.9 (87.0–99.0) Improvement only Global Dichotomy† *Magnitude of treatment effect (NIHSS points). †Global end point included BI ⱖ95, mRS ⱕ1, and NIHSS ⱕ1. Table data show the trial size (95% CI) required-maintain statistical power as a percentage relative to the size of a trial conducted using the disability endpoint. Relative sample sizes less than 100% are better. Discussion There is potential for the use of the NIHSS as a primary end point in acute stroke trials. We propose that the use of NIHSS end points could substantially increase statistical power or allow a decrease in sample size without a loss of power when compared with disability end points. The most discriminating NIHSS end point was a “prognosis-adjusted” end point that defined favorable outcome as a final score of ⱕ1 at 90 days or an improvement from baseline of at least 11 points. However, simple dichotomization at NIHSS ⱕ1 was also effective, because were many end points that included only an n-point improvement. Useful values of n tended to be small, however, because larger values render the end point subject to a ceiling effect (because patients with mild stroke cannot improve beyond a score of 0). Including the NIHSS, BI, and mRS in a global end point also demonstrated reasonable statistical power, similar to that of the single NIHSS component. However, our global end point did not include the GOS. Although a global endpoint is attractive because it incorporates several important outcome measures, it is likely that the TABLE 4. Comparison of Selected NIHSS End Points-Disability End Points in Terms of Relative Sample Size Required Treatment Level* NIHSS End Points ⱕ1 ⱕ1- or ⱖ11-point improvement Disability End Points 1 2 3 BIⱖ95 54.7 (48.6–60.8) 62.3 (60.0–64.4) 97.1 (91.8–105.0) mRSⱕ1 69.8 (68.6–76.1) 84.1 (81.3–87.1) 74.1 (71.6–77.0) BIⱖ95 21.0 (18.4–23.4) 31.7 (30.8–32.7) 46.0 (44.1–48.6) mRSⱕ1 26.7 (24.1–29.3) 42.8 (41.7–44.0) 35.1 (34.0–36.3) *Magnitude of treatment effect (NIHSS points). Table data show the trial size (95% CI) required-maintain power as a percentage relative to the size of a trial conducted using the disability end point. Relative sample sizes less than 100% are better. Young et al NIHSS vs Disability Outcome Measures 2191 Figure 2. Overall comparison of NIHSS end points. Selected end points are ordered from least to most powerful. Lines connect end points that are not significantly different. Downloaded from http://stroke.ahajournals.org/ by guest on November 20, 2016 power of the global end point was restricted by the inclusion of less powerful mRS and BI measures. The benefit of prognosis-adjusted end points has been demonstrated. Assessing whether a patient reaches a score of 0 or 1 on the NIHSS or improves from baseline by at least 11 points allows more patients to contribute to the results, because simply dichotomizing the scale ultimately results in a loss of meaningful information. This is logical: some patients may never reach a score of 0 or 1 but could still show significant improvement and therefore will contribute to this type of analysis. In this study, we tested only a fixed treatment effect, assuming that the initial severity of all active treatment group patients improved by the same amount. This may not be the most likely scenario, because patients can benefit from treatments in a variety of ways. The actual treatment effect may only benefit subgroups of patients such as male or young patients or may depend on the severity of the stroke. However, in a previous study,24 we demonstrated consistent performance of outcome measures across a variety of likely treatment effect patterns. Second, our analysis was not adjusted for any factors relating to stroke outcome. If covariates had been included, the statistical power of the end points would likely have been increased.29 Third, we chose as our surrogate treatment effect an “improved” baseline NIHSS score to increase the chance of improved outcome at 90 days. It is possible that this method of applying a simulated treatment effect may have overestimated the statistical power obtained by the NIHSS end points in comparison to the BI or mRS end points through some subtle link. We tested for this by including baseline NIHSS as a covariate. However, when the effect of baseline NIHSS was controlled, the advantage of the NIHSS end points over the BI and mRS end points decreased only minimally, suggesting that any inflation of the power values was small. All of the end points in our study included dichotomizations of the NIHSS. An alternative would be to use all categories and apply proportional odds (PO) logistic regression.30 However, we found that the use of the PO model did not improve the power compared with the best prognosis-adjusted end point and was similar to the ⱕ1 dichotomy. Our study only used data from the GAIN International Trial.12 This population was considered representative of most patients with stroke presenting to hospital acutely. Nevertheless, it may be informative to use different trial data to assess the generalizability of our findings. Despite the apparent potential improvement in statistical power, neurologic impairment scales have been used infrequently as primary end points.10,15 Instead, trials have tended to favor disability scales, driven in part by regulatory authorities. The European Medicines Evaluation Authority (EMEA)31 accepts that neurologic outcome scales should be supportive as secondary efficacy end points, but also recommend that they should not be dichotomized, because important information may be missed. Impairment scales are more sensitive to change in patient status and may be more relevant for earlier phase trials. Disability or handicap scales are perceived as being more relevant to patients with stroke for phase III trials,1 and the BI has been shown to be reliable even when administered over the telephone.6 In conclusion, we found benefits from using the NIHSS at 90 days as an end point. We speculate that this will translate into more powerful clinical trials. Clinical trials of acute stroke therapies should consider the use of neurologic impairment scales to assess benefit from treatment. Acknowledgments F.B.Y. is supported by a collaborative studentship from the Medical Research Council and Pfizer. C.J.W. is funded by a Medical Research Council career development fellowship. The GAIN trial was sponsored by GlaxoWellcome (now GlaxoSmithKline). Neither GlaxoSmithKline nor Pfizer had any involvement in this analysis or manuscript. Data from the GAIN International trial have been placed in the Virtual International Stroke Trials Archive (VISTA). References 1. Roberts L, Counsell C. Assessment of clinical outcomes in acute stroke trials. Stroke. 1998;29:986 –991. 2. Orgogozo JM. Advantages and disadvantages of neurological scales. Cerebrovasc Dis. 1998;8:2–7. 3. Brott T, Adams HP, Olinger CP, Marler JR, Barsan WG, Biller J, Spilker J, Holleran R, Eberle R, Hertzberg V. Measurements of acute cerebral infarction: a clinical examination scale. Stroke. 1989;20:864 – 870. 4. Muir KW, Weir CJ, Murray GD, Povey C, Lees KR. Comparison of neurological scales and scoring systems for acute stroke prognosis. Stroke. 1996;27:1817–1820. 5. D’Olhaberriague L, Litvan I, Mitsias P, Mansbach HH. A reappraisal of reliability and validity studies in stroke. Stroke. 1996;27:2331–2336. 6. Lyden PD, Lau GT. A critical appraisal of stroke evaluation and rating scales. Stroke. 1991;22:1345–1352. 7. Lyden PD, Lu M, Levine SR, Brott TG, Broderick J, NINDS rtPA Stroke Study Group. A modified National Institute of Health Stroke Scale for use 2192 8. 9. 10. 11. 12. Downloaded from http://stroke.ahajournals.org/ by guest on November 20, 2016 13. 14. 15. 16. 17. Stroke October 2005 in stroke clinical trials: preliminary reliability and validity. Stroke. 2001; 32:1310 –1317. Duncan PW, Jorgensen HS, Wade DT. Outcome measures in acute stroke trials: a systematic review and some recommendations to improve practice. Stroke. 2000;31:1429 –1438. Clark WM, Wissman S, Albers GW, Jhamandas JH, Madden KP, Hamilton S; for the ATLANTIS Study Investigators. Recombinant tissue-type plasminogen activator (Alteplase) for ischemic stroke 3 to 5 hours after symptom Onset: the ATLANTIS study. JAMA. 1999;282: 2019 –2026. The National Institute of Neurological Disorders and Stroke rt-PA Stroke Study Group. Tissue plasminogen activator for acute ischemic stroke. N Engl J Med. 1995;333:1581–1587. Sacco RL, DeRossa JT, Haley EC, Levin B, Ordronneau P, Phillips SJ, Rundek T, Snipes RG, Thompson JL; Glycine Antagonist in Neuroprotection Americas Investigators. Glycine antagonist in neuroprotection for patients with acute stroke: a randomized controlled trial (GAIN Americas Study). J Am Med Assoc. 2001;285:1719 –1761. Lees KR, Asplund K, Carolei A, Davis SM, Diener HD, Kaste M, Orgogozo JM, Whitehead J; for the GAIN International Investigators. Glycine antagonist (gavestinel) in neuroprotection (GAIN International) in patients with acute stroke: a randomised controlled trial. Lancet. 2000;355:1949 –1954. del Zoppo GJ, Higashida RT, Furlan AJ, Pessin MS, Rowley HA, Gent M; the PROACT Investigators. PROACT: A phase II randomized trial of recombinant Pro-urokinase by direct arterial delivery in acute middle cerebral artery stroke. Stroke. 1998;29:4 –11. Furlan A, Higashida R, Wechler L, Gent M, Rowley H, Kase C, Pessin M, Ahuja A, Callahan F, Clark WM, Silver F, Rivera F; for the PROACT Investigators. Intra-arterial prourokinase for acute ischemic stroke: the PROACT II study a randomized controlled trial. J Am Med Assoc. 1999;282:2003–2011. Clark WM, Williams BJ, Selzer KA, Zweifler RM, Sabounjian LA, Gammans RE; for the Citicoline Stroke Study Group. A randomized efficacy trial of citicoline in patients with acute ischemic stroke. Stroke. 1999;30:2592–2597. Grotta J, for the US and Canadian Lubeluzole Ischemic Stroke Study Group. Lubeluzole treatment of acute ischemic stroke. Stroke. 1997;28: 2338 –2346. The RANTTAS Investigators. A randomized trial of tirilazad mesylate in patients with acute stroke (RANTTAS). Stroke. 1996;27:1453–1458. 18. Davis SM, Lees KR, Albers GW, Diener HC, Markabi S, Karlsson G, Norris J; for the ASSIST Investigators. Selfotel in acute ischemic stroke: possible neurotoxic effects of an NMDA antagonist. Stroke. 2000;31: 347–354. 19. Hacke W, Kaste M, Fieschi C, Toni D, Lesaffre E, Von Kummer R, Boysen G, Bluhmki E, Hoxter G, Mahagne MH; for the ECASS Study Group. Intravenous thrombolysis with recombinant tissue plasminogen activator for acute hemispheric stroke: the European Cooperative Acute Stroke Study (ECASS). J Am Med Assoc. 1995;274:1017–1025. 20. Hacke W, Kaste M, Fieschi C, Von Kummer R, Davalos A, Meier D, Larrue V, Bluhmki E, Davis S, Donnan G, Schneider D, Diez-Tejedor E, Trouillas P; for the Second European–Australasian Acute Stroke Study Investigators. Randomised double-blind placebo-controlled trial of thrombolytic therapy with intravenous alteplase in acute ischaemic stroke (ECASS II). Lancet. 1998;352:1245–1251. 21. Hacke W, Bluhmki E, Steiner T, Tatlisumak T, Mahagne MH, Sacchetti ML, Meier D; for the ECASS Study Group. Dichotomized efficacy end points and global end-point analysis applied to the ECASS intentionto-treat data set: post hoc analysis of ECASS I. Stroke. 1998;29: 2073–2075. 22. Bland M. An Introduction to Medical Statistics, 3rd ed. Oxford: Oxford University Press; 2000. 23. Efron B, Tibshirani R. An Introduction to the Bootstrap. New York: Chapman & Hall; 1993. 24. Young FB, Lees KR, Weir CJ. Strengthening acute stroke trials through optimal use of disability endpoints. Stroke. 2003;34:2676 –2680. 25. Lipsitz SR, Laird NM, Harrington DP. Generalized estimating equations for correlated binary data: using the odds ratio as a measure of association. Biometrika. 1991;78:153–160. 26. Wei P. Sample size and power calculations with correlated binary data. Control Clin Trials. 2001;22:211–227. 27. Woodward M. Formulae for sample size, power and minimum detectable relative risk in medical studies. Statistician. 1992;41:185–196. 28. Hosmer DW, Lemeshow S. Applied Logistic Regression. New York: Wiley; 1989. 29. Pocock SJ, Assmann SE, Enos LE, Kasten LE. Subgroup analysis, covariate adjustment and baseline comparisons in clinical trial reporting: current practice and problems. Stat Med. 2002;21:2917–2930. 30. Agresti A. Categorical Data Analysis. New York: Wiley; 1990. 31. Committee for Proprietary Medicinal Products (CPMP). Points to Consider on Clinical Investigation of Medicinal Products for the Treatment of Acute Stroke. 2001. Comparison of the National Institutes of Health Stroke Scale With Disability Outcome Measures in Acute Stroke Trials Fiona B. Young, Christopher J. Weir and Kennedy R. Lees for the GAIN International Trial Steering Committee and Investigators Downloaded from http://stroke.ahajournals.org/ by guest on November 20, 2016 Stroke. 2005;36:2187-2192; originally published online September 22, 2005; doi: 10.1161/01.STR.0000181089.41324.70 Stroke is published by the American Heart Association, 7272 Greenville Avenue, Dallas, TX 75231 Copyright © 2005 American Heart Association, Inc. All rights reserved. Print ISSN: 0039-2499. Online ISSN: 1524-4628 The online version of this article, along with updated information and services, is located on the World Wide Web at: http://stroke.ahajournals.org/content/36/10/2187 Permissions: Requests for permissions to reproduce figures, tables, or portions of articles originally published in Stroke can be obtained via RightsLink, a service of the Copyright Clearance Center, not the Editorial Office. Once the online version of the published article for which permission is being requested is located, click Request Permissions in the middle column of the Web page under Services. Further information about this process is available in the Permissions and Rights Question and Answer document. Reprints: Information about reprints can be found online at: http://www.lww.com/reprints Subscriptions: Information about subscribing to Stroke is online at: http://stroke.ahajournals.org//subscriptions/
