Precios internacionales de commodities de importancia en la
Anuncio
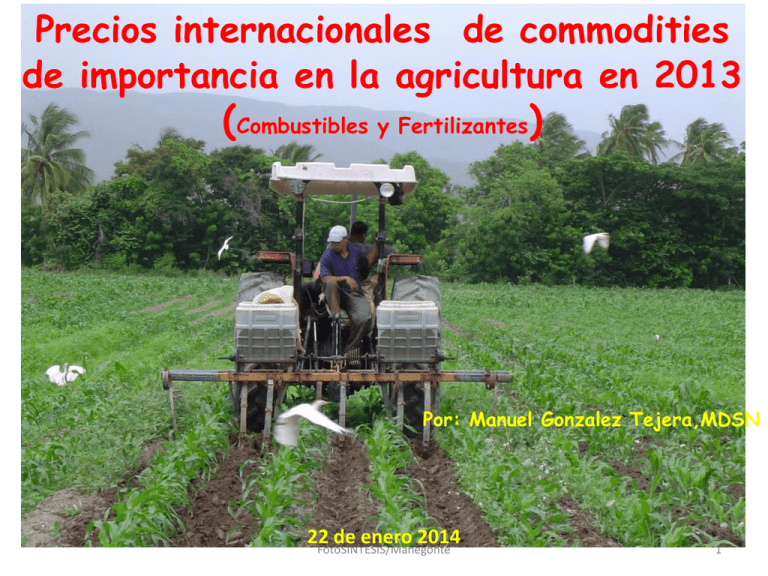
Precios internacionales de commodities de importancia en la agricultura en 2013 (Combustibles y Fertilizantes) Por: Manuel Gonzalez Tejera,MDSN 22 de enero 2014 FotoSÍNTESIS/Manegonte 1 Indice mundial anual (2000 a 2013) de Precios Corriente y Constante de ENERGIA (2010=100) 140 Corriente 120 Constante 127 129 129 120 100 80 60 40 42 Fuente: Banco Mundial (Pink Sheet) FotoSÍNTESIS/Manegonte 2015 2014 2013 2012 2011 2010 2008 2007 2006 2005 2004 2003 2002 2001 2000 0 2009 Olas de incremento 2008 y 2011/12 20 2 Evolución Precio mensual promedio del petroleo 3 tipos 2011/13 y comparación con 2008/2012 (US/Bbl) 150 117.8 120 100 104.1 105.5 110 79.0 90 100 101.2 80 90.7 80 70 70 Variacion Dic2012 60 Fuente: Banco Mundial (Pink Sheet) ene-14 sep-13 may-13 ene-13 60 sep-12 may-12 ene-12 sep-11 may-11 ene-11 +4.24% 61.8 90 50 97.0 110 130 105.0 140 104.3 120 50 FotoSÍNTESIS/Manegonte 2008 2009 2010 2011 2012 2013 3 140 130 100 122.3 120 97.9 100 80 90 70 70 Variacion Dic 2012 60 60 Fuente: Banco Mundial (Pink Sheet) ene-14 sep-13 may-13 ene-13 sep-12 may-12 ene-12 sep-11 may-11 +10.99% ene-11 50 61.65 88.2 86.3 80 98.34 79.43 90 110 94.16 110 95.05 150 99.56 Evolución Precio mensual Petroleo WTI en 2011/13 y comparación con 2008/2012 (US/Bbl) 50 FotoSÍNTESIS/Manegonte 2008 2009 2010 2011 2012 2013 4 130 140.00 120 130.00 110 Variacion Dic2012 -10.18% 110.00 100 100.00 90.00 81.5 80.00 73.2 70.00 Fuente: Banco Mundial (Pink Sheet) ene-14 sep-13 may-13 ene-13 sep-12 may-12 ene-12 sep-11 may-11 60 ene-11 50.00 80 70 60.00 78.0 90 84.0 119.8 71.8 59.4 120.00 111.5 150.00 122.4 Evolución Precio mensual Carbon Colombia en 2011/13 y comparación con 2008/2012 (US$/TM) 50 FotoSÍNTESIS/Manegonte 2008 2009 2010 2011 2012 2013 5 Indice mundial anual (2000 a 2013) de Precios Corriente y Constante de FERTILIZANTES (2010=100) 250 Corriente Constante 202 200 143 150 114 100 107.2 50 Fuente: Banco Mundial (Pink Sheet) FotoSÍNTESIS/Manegonte 2015 2014 2013 2012 2011 2010 2009 2007 2006 2005 2004 2003 2002 2001 0 2000 40 2008 Olas de incremento 2008 y 2011 6 600 500 493 Evolución Precio de la UREA en 2011/13 y comparación con 2008/2012 (US/TM) 421 450 -12.85% 503.8 500 405 Variacion Dic2012 550 400 450 340 400 289 350 350 250 300 330.1 353.8 250 300 Fuente: Banco Mundial (Pink Sheet) ene-14 sep-13 may-13 ene-13 sep-12 may-12 ene-12 sep-11 may-11 250 ene-11 200 150 FotoSÍNTESIS/Manegonte 2008 2009 2010 2011 2012 2013 7 700 1000 659 650 900 600 800 700 499 619 500 370 -25.85% 350 500 Fuente: Banco Mundial (Pink Sheet) ene-14 sep-13 may-13 ene-13 sep-12 may-12 ene-12 sep-11 may-11 ene-11 400 445 323 Variacion Dic2012 400 501 600 450 540 550 300 968 Evolución Precio de la Fosfato DiAmonico en 2011/13 y comparación con 2008/2012 (US/TM) 300 FotoSÍNTESIS/Manegonte 2008 2009 2010 2011 2012 2013 8 Evolución Precio de la Muriato de Potasa en 2011/13 y comparación con 2008/2012 (US/TM) 700 630 483 450 600 425 550 400 450 368 sep-13 may-13 332 332 ene-13 sep-12 may-12 ene-12 sep-11 may-11 ene-11 Fuente: Banco Mundial (Pink Sheet) 379 400 Variacion Dic2012 -21.88% 300 435 500 ene-14 350 570 650 459 500 350 300 2008 FotoSÍNTESIS/Manegonte 2009 2010 2011 2012 2013 9 El AGUA ES VIDA, NO LA DESPERDICIES Ahora y Siempre, Ahorrela!! FotoSÍNTESIS/Manegonte 10
