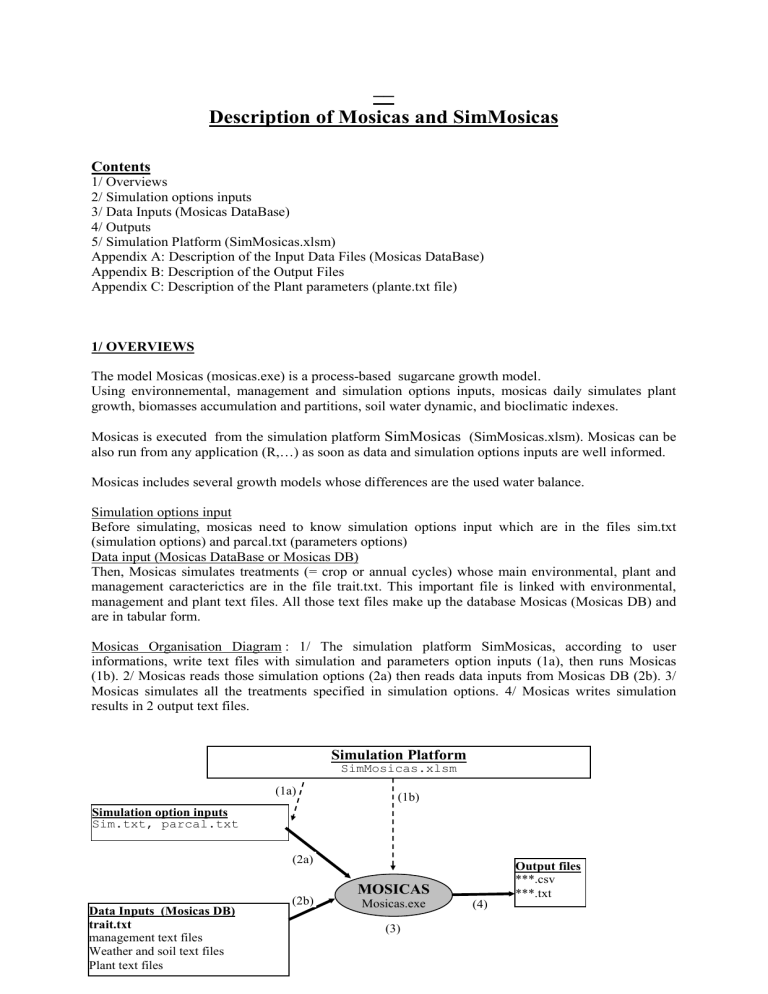
–– Description of Mosicas and SimMosicas Contents 1/ Overviews 2/ Simulation options inputs 3/ Data Inputs (Mosicas DataBase) 4/ Outputs 5/ Simulation Platform (SimMosicas.xlsm) Appendix A: Description of the Input Data Files (Mosicas DataBase) Appendix B: Description of the Output Files Appendix C: Description of the Plant parameters (plante.txt file) 1/ OVERVIEWS The model Mosicas (mosicas.exe) is a process-based sugarcane growth model. Using environnemental, management and simulation options inputs, mosicas daily simulates plant growth, biomasses accumulation and partitions, soil water dynamic, and bioclimatic indexes. Mosicas is executed from the simulation platform SimMosicas (SimMosicas.xlsm). Mosicas can be also run from any application (R,…) as soon as data and simulation options inputs are well informed. Mosicas includes several growth models whose differences are the used water balance. Simulation options input Before simulating, mosicas need to know simulation options input which are in the files sim.txt (simulation options) and parcal.txt (parameters options) Data input (Mosicas DataBase or Mosicas DB) Then, Mosicas simulates treatments (= crop or annual cycles) whose main environmental, plant and management caracterictics are in the file trait.txt. This important file is linked with environmental, management and plant text files. All those text files make up the database Mosicas (Mosicas DB) and are in tabular form. Mosicas Organisation Diagram : 1/ The simulation platform SimMosicas, according to user informations, write text files with simulation and parameters option inputs (1a), then runs Mosicas (1b). 2/ Mosicas reads those simulation options (2a) then reads data inputs from Mosicas DB (2b). 3/ Mosicas simulates all the treatments specified in simulation options. 4/ Mosicas writes simulation results in 2 output text files. Simulation Platform SimMosicas.xlsm (1a) (1b) Simulation option inputs Sim.txt, parcal.txt (2a) Data Inputs (Mosicas DB) trait.txt management text files Weather and soil text files Plant text files (2b) Output files ***.csv ***.txt MOSICAS Mosicas.exe (3) (4) Files and directories organisation Example of file and directories organisation [mosicas] (<== main directory) Mosicas.exe, SimMosicas.xlsm Sim.txt, parcal.txt, calibres.csv [input] (sub-directory with all data input files: Mosicas DB) [output] (sub-directory with all output files) [doc] (sub-directory with documentation) [for] (source code) 2/ SIMULATION OPTION INPUTS General simulation options are in the file sim.txt and specific parameter options are in the file parcal.txt. These files are written by SimMosicas.xlsm according to user informations filled in the sheet « Simulation » of the platform SimMosicas.xlsm General options include in sim.txt : locations of input and output files , the name of the output file, the name of the model to be used, the output frequencies, the simulation type (normal, sensitivity or calibration), the forcing type, the irrigation type and which treatments must be simulated. Specific parameters options are written in parcal.txt when user choose a sensitivity or calibration as type of simulation. These options include the state variable of calibration if calibration is chosen and the description of all parameters (name, central value, iteration and number of iterations) The detailed description of the simulations options and parameters options is located in the chapter "52 in the simulation options zone". 3/ DATA INPUTS (Mosicas DB) 3-1/ List of data inputs text files These files can be filled directly by the user using a text editor, a spreadsheet or a Database interface. All the text files are tables using tabulations as separators and dot (".") as decimal. Aphanumeric values must not include spaces, "," or "/". Columns order and the name of the sheet "Simulation" must not be changed and columns must not be added or deleted. Modification of these files must respect the relations between files and columns specifications. See "3-2/ Relations between data input text files of the mosicas DB" and Appendix A. All the files are linked to the main data input file : trait.txt. The system is like a relational DataBase Detailed description of each file is in Appendix A. * Main data input file - trait.txt. General description of each treatment (crop or annual cycle) whose code is ʺtreatcodeʺ * Management data input files linked to trait.txt - plante.txt. Plant parameters values for each cultivar and crop cycle. - fertN.txt : Fertilizations applications (informative ( not compulsory) - irrig.txt. : daily irrigations applications on each treatment where actual irrigation is applied * Weather and raingauges data input files linked to trait.txt - "wstacode".txt. : Daily weather text files (One file by weather station whose name of the file is ʺwstacodeʺ) - stamet.txt : General description of all the weather stations. * Soil data input files linked to trait.txt - solgen.txt : General description of each soil whose code is ʺsoilcodeʺ - solcouch.txt. : Description of the layers of each soil - solini.txt : initial soil water content of treatments if they have been measured. * Observations data input files linked to trait.txt - obsol.txt. : Observed soil water contents of each treatment - obsplant.txt : Observed plant characteristics of each treatment. 3-2/ Relations between data input text files of the mosicas DB Text files are linked to trait.txt by a column name (in italics). Irrig.txt Fertn.txt irricode treatcode Obsplant.txt treatcode Obsol.txt treatcode Solini.txt treatcode treatcode irricode trait.txt varcode wstacode soilcode Daily weather files (.txt) "wstacode".txt Stamet.txt wstacode Solgen.txt soilcode plante.txt varcode soilcode Solcouch.t xt 4/ OUTPUT FILES These output text files include results from simulations on treatments specified by the user. The output file name ("outcode") and location is given by the user in the sheet " Simulation " of SimMosicas.xlsm. Two output files are written by mosicas according to the type od simulation: - a text file as simulation report “outcode”.txt including simulation options and running problems , If the type of simulation is normal or sensitivity: - a text file with simulation results “outcode”.csv like a table (separator : ";", decimal: ".") If the type of simulation is calibration - a textfile calibres.csv giving errors and optimum values for each parameter to calibrate. The description of output files is in Appendix B. 5/ SIMULATION PLATFORM The whole Simulation Platform is included in Sheet "Simulation" of the file SimMosicas.xlsm. This Simulation Platform, after filling simulation options, writes option simulations files (sim.txt and parcal.txt) and then run mosicas. Simulation procedure. In Sheet "Simulation": Don't insert and delete rows and columns in this sheet. Don’t change the name of the sheet "Simulation" 1/ Fill treatments zone, with treatments names ,column H from row 11 downwards 2/ Fill options zone (yellow cells) 3/ Execute the simulation (blue button) Wait for message box "End of Simulation" 5-1 Treatment zone List of the treatments which will be simulated. The number of treatments is not limited. Treatment list must be filled in column H (or 8) from row 11 downwards. Treatments List must not have empty cells. In Sheet "DosTrait1" can be pasted all treatments existing in trait.txt (not compulsory but convenient). This can help to classify treatments. It is possible to fill treatments in columns I, J, K, … in the yellow cell corresponding to "Nomber of treatment In Lists". In that case, the number of columns (Lists) must be specified in cell A7. 5-2 Simulation options zone Fill only yellow cells. Don't insert and delete rows and columns in this sheet Number of Treatment Lists Input data subfolder Output subfolder Type of treatments Name of the output file Crop rotation Model name Number of treatments lists = Number of columns taken into account, in treatment Zone (=1 Don't modify for the moment) Sub-folder where are located all the input data files (Mosicas DataBase). This sub-folder is inside the folder where are mosicas.exe and SimMosicas.xlsm. Sub-folder where are located all the output data files (except calibres.csv). This sub-folder is inside the folder where are mosicas.exe and SimMosicas.xlsm. Write "obs" if all the treatments to simulate are in "trait.txt" or write write "str" if all the treatments to simulate are in "trstr.txt". For convenience, all the treatments including observations (experiments, growers, surveys) are in "trait.txt' and all the virtual treatments referring to strategies to test or compare are in "trstr.txt". trait.txt and trstr.txt have the same structure (columns names and order). Name of the file (without extension) where will be saved all the outputs (results) of treatments simulations. (not more than 8 letters and figures, without "," "/" and spaces). "name".csv is a table with all the simulation outputs, which can be very easily processed with R or Excel. "name.txt" is a file where are saved simulation options and simulation stories. Rotation (0: treatment are independant, 1: there are crop rotations) . Write 0 for the moment. Name of the crop simulation model. Examples: "MOSICASCERES", "MOSICASPCERESb", "MOSICASFAO56", "MOSICASFAO56b". Each model, composed of process modules, is located in mosicas code. Output frequency (in days) Output at observation dates Water stress effect Nitrogen stress effect Type of simulation Type of calibration Number of parameters Calibration variable Parameters Table Parameter Name central value iteration value Number of iterations 1: every day, n: every n days, 0: only at the end of the growing cycle, that's to say the ending date ("enddate") specified for each treatment in "trait.txt" 1: Yes, 0: No. Output will occur at all the observation dates indicated in "obsplant.txt", if the figure indicated in column "calage" of obsplant.txt is 1. 1: Yes, 0: No. If 1, the water balance runs and water stress indexes are calculated, actual water stresses are effective. If 0, the water balance runs but water stress indexes are set to 1, that's to say no water stress occurs. 1: Yes, 0: No.. This doesn't run for the moment. Write 1. 0: normal, no plant parameter variation for each treatment. 1:sensitivity, 1 to 12 plant parameters can vary with interaction (combinations). 2 Calibration, 1 to 12 plant parameters can vary using a calibration variable on which will be compared and minimized square differences between observations and simulated outputs using Simulated Annealing Method. Calibration method: 1: simulated annealing, 2 simplex, 3 gradient. Write 1 as only simulated annealing is implemented. Number of plant parameters used for sensitivity or calibration. (1 to 12). This option is taken into account only if the type of simulation is 1 (sensitivity) or 2 (calibration). Plant or soil state variable of the model on which will be compared and minimized square differences between observations and simulated outputs using Simulated Annealing Method. Calibration variables are: lai (green leaf area index), ei (interception efficiency), nbtigv (number of alive stalks), nbltot (number of total blades), nblv (number of alive blades), ltvdsurf (area of tvd blade), dmaer (aboveground dry mass), humcan (water content of above ground biomass), dmsucre (sucrose dry mass), rdcan (millable stalk fresh mass or yield, htvd (stalk height up to tvd), dmtig (millable stalk dry mass), stock (soil available water stock). This table is taken into account if "type of simulation" is 1 (sensitivity) or 2 (calibration) and if "Number of parameters" ( = n) is specified. The n parameters must be informed and only the first n parameters will be taken into account. Name of the plant parameter to calibrate or on which sensitivity is studied Central value of the parameter for sensitivity and initial value for calibration iteration in % of the central value. Sensitivity : Number of iterations on either side of the central value. For calibration write 1. Sensitivity example: central value=100, iteration value = 20 (%), Number of iterations = 2 will give values of 60, 80, 100, 120, 140. If n parameters, all the intercations (combinations) will be used. Calibration example: central value=100, iterations = 90 (%), Number of iterations = 1. Calibration will be run and best (optimized) parameter value will be searched for parameter values between 10 and 190. These options are used for forcing. For each specified state variable, simulated value is Forcing : Simulations=Ob replaced with observed value at each observation date. servations Forcing 0: no forcing. 1: forcing. Forcing can be undertaken at first observation date or at all observation dates. Variable Name of the state variable that will be forced by observations. Type of irrigation (strategies) 0 1 2 3 4 5 These options can be used to compare, analyse potentialities or irrigation strategies. The selected type of irrigation will be applied to all treatments. If simulations are experiments with irrigations filled in irrig.txt, write 1 as type of irrigation. No irrigation (Only rainfed without actual irrigations taken into account). Give rainfed Potential. Actual irrigation indicated in file trait.txt and whose amount and dates are in file irrig.txt. Give potential with actual irrigation. p1: irrigation frequency in days p2: maximum level of filling (% of available water capacity AWC). Amount is the difference between p2 and the actual available water stock p3: number of days of drying-off before harvest p1: starting level (% of AWC) p2: maximum level (% of AWC) Irrigation starts if the actual available water stock (% of AWC) is less than p1. Irrigation amount is p2 - actual available water stock. p3: number of days od drying-off before harvest p1: irrigation frequency in days p2: water amount (in mm) whatever the actual available water stock. p3: number of days of drying-off before harvest. p1: irrigation frequency in days p2: water amount (in mm) p3: starting level (% AWC) Irrigation starts if the actual available water stock (% of AWC) is lower than p3 p4: number of days of drying-off before harvest. 5-3 Execute the Simulation Press the blue Button. Then wait for message box "End of Simulation" This creates the simulation options file sim.txt then run mosicas.exe located in the same folder as SimMosicas.xlsm. This execute the simulation when all the simulation options and the treatments list are well informed. Appendix A Description of the Input Data Files (Mosicas DataBase) Relations between files. Main Keys = columns names in relations. Main Keys soilcode soilcode treatcode treatcode treatcode varcode Wstacode, rstacode wstacode irricode First File solgen.txt solgen.txt trait.txt trait.txt trait.txt plante.txt "wstacode".txt "rstacode".txt stamet.txt trait.txt Secondary File trait.txt solcouch.txt solini.txt obsplant.txt obsol.txt trait.txt trait.txt trait.txt irrig.txt General remarks In all text files the first line must not be deleted and modified. This line includes columns (or variables names) All files are tabulation sepatated (text files tables). In decimal numbers, decimal is a dot ("."). Missing numbers, if permitted, are -999. trait.txt and trstr.txt trait.txt and str.txt are 2 different files including same treatment caracteristics (same colums names) trait.txt is used when treatments include plant or soil observations trstr.txt is used when treatments don't include observations (like scenarii studies). It's just a way to distinguish types of treatments with or without observations. No missing values are allowed Codes of weather stations must exist in stamet.txt and a daily weather text file must exist column name nbbgi Definition cycle Number of buds at plantation (/m2) Treatment name (30 caracters maxi). Without "," "/" and spaces. Coding of treatment names (not compulsory) is important for subsequent treatment with R. Must be in "varcyclecode" column of trait.txt input files Crop cycle code: 0 for plant crop, 1 for first ratoon, ….) varcode Cultivar (variety) name. (15 caracters maxi, Without "," "/" and spaces. ) rowspace Row spacing (m) begdate begining date of simulation : Plantation date or previous harvest date (format: dd-mm-yyyy) enddate Ending date of simulation: harvest date of the crop cycle (jj-mm-aaaa) trialat Latitude in decimal degrees (+ at the North, - a the south) treatcode trialong Longitudein decimal degrees trialalt Altitude (m) Soil Name (must exist in "nomtrait" column of solgen.txt. (20 caracters maxi, Without "," "/" and spaces. ) fraction (0-1) the available water capacity at the begining date (0 if empty, 1 if full. If -1 , Mosicas will seach in solini.txt. (Case with soil layers) root depth (cm) soilcode inisoilvol rootdepth irrcode wstacode Irrigation code of actual irrigation applied to the treatment. The code and the caracteristics (dates, ammounts, ...) must exist in irrig.txt. Without "," "/" and spaces.. Must exist in irrig.txt. (irricode= PLUVIAL if no irrigation (rainfed)) code of main weather station (weather text file name). Compulsory. Must exist in stamet.txt and the weather text file must exist. Without "," "/" and spaces. Treatcode: proposed coding TrialName-CropCycle-Repetition-TrialTreatment-Cultivar. The whole string including "-" must not exceed 30 caracters This makes easier to know the content of the treatment and to use result output file after simulation as the main caracteristics of each treatment are insite the string TrialName 4-6 Name of the trial: UPPER letters and numbers without space, ",", "/","-" CropCycle 1 integer: 0, 1, 2 , 3, …. (0 = Plant crop, 1 = first ratoon, …) Repetition 1 integer: 0, 1, 2 , 3, …. (0= mean, 1= 1st repetition, ...) TrialTreatment 3-5 Name of the trial treatment: UPPER letters and numbers without space, ",", "/","-". Various management levels in the experiment can be coded in this substring. Cultivar 15 Name of the cultivar (variety): UPPER letters and numbers without space, ",", "/","-" Example ICSMRE-0-0-AAA-R570 Daily Weather files. "wstacode.txt" One text file by weather station. Name of text file must exist in stamet.txt and column wstacode of trait.txt 20 caracters maximum, without "," "/" and spaces No missing dates are allowed. The file mustbe sorted accordinf to dates No missing values for rr, etp, tx, tn, rg are allowed Put -999 when values are missing. (ux, un, vt, tm) Bold: compulsory column name date rr etp tx tn "dd-mm-yyyy". Compulsory daily rainfall (mm). Compulsory daily ET0 Pennman-Monteith (mm). Compulsory+D81 daily maximum temperature. Compulsory daily minimum temperature. Compulsory rg ux un vt tm daily incident global radiation (MJ/m2/jours). Compulsory daily maximum humidity (%). Optional daily minimum humidity (%). Optional daily wind (Km/day). Optional daily average temperature. Optional Definition Stamet.txt Main Caracteristics of the Weather stations These caracteristics are generally not used except for astronomic calculations. All weather station codes existing in trait.txt (and existing as daily weather files) must be informed in stamet.txt No missing values are allowed column name wstacode wsalt wslat wslong TAV AMP countrycode wstype wsname Definition Code of weather station (and weather text file name) (Without "," "/" and spaces, 20 carac maxi) Compulsory Altitude (m). Compulsory Latitude in decimal degrees (+ at the North, - a the south) Longitude in decimal degrees Yearly average temperature. Informative only, not used. . Compulsory Range between min and max monthly temperature. Informative, only. Compulsory Code of the country. Informative, only. Compulsory Type of weater station . M for weather station and P for raingauge only). Informative, only. Compulsory Name of the weather. Without "," "/" and spaces. 20 caracters maxi. Informative, only. Compulsory Irrig.txt Caracteristics of actual irrigations applied to treatments No missing data are allowed column name irricode irritype efficiency irridose dateirri Definition Irrigation code of actual irrigation applied to a treatment. Without "," "/" and spaces.(irricode= PLUVIAL, if no irrigation: rainfed). Should exist in the column irricode of trait.txt. Type of applied irrigation : 0 : drip 1 : sprinkler Efficiency of irrigation (0 à 1). The ammount applied is multiplied by the efficiency. (0.95 pour drip, 0.7 for sprinkler) daily applied amount (mm) date of irrigation (dd-mm-yyyy) Fertn.txt Caracteristics of actual Nitrogen fertilisations applied to treatments This file is just informative and not used during simulations. mosicas can be run if treatments are not filled in this file. column name treatcode Profn Dosen Date Definition Treatment name (30 caracters maxi). Without "," "/" and spaces. Coding of treatment names (not compulsory) is important for subsequent treatment with R. Must be in "varcyclecode" column of trait.txt input files Depth of nitrogen application (cm) Amount of applied Nitrogen (Kg/Ha) date (dd-mm-yyyy) Plante.txt Caracteristics (parameter values) of cultivars If a cultivar used in a treatment is not filled in this file, parameter values of cultivar R570 are used column name Varcode Paramname Definition Cultivar (variety) name. (15 caracters maxi, Without "," "/" and spaces. ) Name of a parameter Plantcrop Value of the parameter for plant crop Ratoon Value of the parameter for ratoons Definitions and values of plant parameters are in Appendix C Obsplant.txt Plant observations The file must be sorted first by treatment name (treatcode), then by observation date (obsdate) Give -999 for missing values column name treatcode obsdate calage stagnb stadnb stafnb stahtvd blatnb blagnb blastvd glai ei stamsu stamfm stamdm stamwc stamsuc stamfbc stambjc stampur blagdm bladm agrfm agrdm agrwc sendm Definition Treament name (30 caracters maximum) without spaces, "/" et " ," ). This name must exist in trait.txt input file (column varcyclecode) Date of observation (dd-mm-yyyy) Use of the observations at this date (0 or 1). If 1 observations are used. If 0, observations are not use for normal, sensitivity and calibration simulations Number of alive stalks (/m2) Number of dead stalks (/m2) percentage of flowered stalks (%) Stalk height up to terminal visible dewlap (cm). Generally, mean stalk height of the observed (labelled) stalks. Number of all (total) appeared leaves (blades) up to terminal visible dewlap (/stalk). Generally, mean number of total leaves for the observed (labelled) stalks. Number of green leaves (blades) up to terminal visible dewlap (/stalk). Generally, mean number of green leaves for the observed (labelled) stalks. Area of the green blade corresponding to the terminal visible dewlap (cm2) Green leaf area index (m2/m2) Interception efficiency (0-1) Sucrose production (T/Ha) Fresh mass of millable stalks (T/ha) (= Yield) Dry mass of millable stalks (T/ha) Humidity of millable stalks (% fresh mass) Sucrose content in millable stalk (% fresh mass) Fibre content in millable stalk (% fresh mass) Brix (corrected) in the juice of millable stalk (% Juice) Purity of the juice of millable stalk (% Juice). Pol/brix*100 Dry mass of green blades (T/ha) Dry mass of total blades (T/Ha) Fresh mass of aboveground biomass including trash and dead stalks (T/ha) Dry mass of aboveground biomass including trash and dead stalks (T/ha) Humidity of aboveground biomass including trash and dead stalks (% fresh mass) Dry mass of trash and dead stalks (T/ha) Calibration variablesare : stagnb; stahtvd; blatnb; blagnb; blagdm; glai; ei; stamsu; stamsuc; stamfm; stamdm; agrdm; agrwc Obsol.txt Observations of soil water content File must be sorted first by treatment name, then by observation date Give -999 for missing values column name treatcode obsdate swc1 swc2 swc3 swc4 swc5 swc6 Definition Treament name (30 caracters maximum) without spaces, "/" et " ," ). This name must exist in trait.txt input file (column varcyclecode) Date of observation (dd-mm-yyyy) Soil water content of layer 1 Soil water content of layer 2 Soil water content of layer 3 Soil water content of layer 4 Soil water content of layer 5 Soil water content of layer 6 Solgen.txt General caracteristics of soil No missing values allowed column name soilcode soiltype nblayer p0 ru soildepth Definition Soil Name (20 caracters maxi, Without "," "/" and spaces. ) Type of sol (20 caracters maxi without spaces, "/" and ","). Informative, not used by mosicas Number of layers (1 to 6) Treshold for transpiration (0 to 1, generally 0.5). Used only with water balance using only one layer (FAO56). Not used with Ceres water balance. Available water capacity (mm/m). Used only with water balance using only one layer (FAO56). Not used with Ceres water balance. Depth of soil (cm) Solcouch.txt Water content caracteristics of soil layers No missing values allowed column name soilcode layernum thickness swcwp swcfc swcsat bdens Definition Soil Name (20 caracters maxi, Without "," "/" and spaces. ) Number of the layer (1 to 6). Layer 1 is the top layer Thickness of the layer (cm) Soil water content (0-1: cm3/cm3) at permanent wilting point (lower limit) Soil water content (0-1: cm3/cm3) at field capacity (drained upper limit) Soil water content (0-1: cm3/cm3) at saturated water-holding capacity Bulk density (g/cm3) Solini.txt Initial water content of soil layers at the begining date of simulation No missing values allowed column name Definition Treament name (30 caracters maximum) without spaces, "/" et " ," ). This name must exist in treatcode trait.txt input file (column varcyclecode) Number of the layer (1 to 6). Layer 1 is the top layer. Layers must fit with layers indicated in layernum soilcouch.txt Initial Soil water content (0-1: cm3/cm3) at the begining date of simulation : Plantation date or swc previous harvest date (format: dd-mm-yyyy) Appendix B Description of the Output Data Files 1/ Output File (simulation results) when simulation types are normal or sensitivity Variables beginning with "o" are observed variables -999 values mean missing datas When sensitivity simulation, columns are added for each parameters with values inside, before column date Col 1 2 3 4 5 6 7 8 9 10 11 12 13 14 15 Code nosimul treatcode lati longi alti dates age agetu glai ei blagnb blatnb stagnb statnb stahtvd blastvd 16 17 18 19 20 21 22 23 24 25 26 27 28 29 30 31 32 33 stamfm stamdm stamwc stamsu stamsuc stamfbc stampur stambjc agrfm agrdm agrwc bladm blagdm ostagnb ostadnb ostafnb ostahtvd 34 35 oblatnb oblagnb 36 37 38 39 40 oblastvd oglai oei ostamsu ostamfm Definition Treatment number Treament name Latitude Longitude altitude (m) Date of output (dd-mm-yyyy) Age since plantation (plant crop) or last harvest (ratoon) Age since appearance of millable stalk biomass (days) Simulated Green leaf area index (m2/m2) Simulated Interception efficiency (0-1) Simulated Number of green leaves (blades) up to terminal visible dewlap (/stalk). Primary stalks Simulated Number of all (total) appeared leaves (blades) up to terminal visible dewlap (/stalk). Primary stalks Simulated Number of alive stalks (/m2) Simulated Number of total stalks (/m2) Simulated Stalk height up to terminal visible dewlap (cm). Primary stalks. Simulated Area of the green blade corresponding to the terminal visible dewlap (cm2). Primary stalks Simulated Fresh mass of millable stalks (T/ha) (= Yield) Simulated Dry mass of millable stalks (T/ha) Simulated humidity of millable stalks (% fresh mass) Simulated sucrose production (T/Ha) Simulated sucrose content in millable stalk (% fresh mass) Simulated fibre content in millable stalk (% fresh mass) Simulated purity of the juice of millable stalk (% Juice). Pol/brix*100 Simulated brix (corrected) in the juice of millable stalk (% Juice) Simulated fresh mass of aboveground biomass including trash and dead stalks (T/ha) Simulated dry mass of aboveground biomass including trash and dead stalks (T/ha) Simulated humidity of aboveground biomass including trash and dead stalks (% fresh mass) Simulated dry mass of total blades (T/Ha) Simulated dry mass of green blades (T/ha) Observed Number of alive stalks (/m2) Observed number of dead stalks (/m2) Observed percentage of flowered stalks (%) Observed Stalk height up to terminal visible dewlap (cm). Primary stalks. Observed number of all (total) appeared leaves (blades) up to terminal visible dewlap (/stalk). Primary stalks Observed number of green leaves (blades) up to terminal visible dewlap (/stalk). Primary stalks Observed area of the green blade corresponding to the terminal visible dewlap (cm2). Primary stalks Observed green leaf area index (m2/m2) Observed interception efficiency (0-1) Observed sucrose production (T/Ha) Observed fresh mass of millable stalks (T/ha) (= Yield) 41 42 43 44 45 46 47 48 49 50 51 52 63 64 65 66 67 68 69 70 71 72 73 74 75 76 77 78 79 80 81 82 83 84 85 86 87 88 89 90 91 92 93 94 95 96 97 98 99 100 101 102 103 104 ostamdm ostamwc ostamsuc ostamfbc ostambjc ostampur oblagdm obladm oagrfm oagrdm oagrwc osendm hv1 hv2 hv3 hv4 hv5 hv6 stock stockm stockfr ohv1 ohv2 ohv3 ohv4 ohv5 ohv6 ostock ostockfr profrac drac1 drac2 drac3 drac4 drac5 drac6 precip tempmn tempmx tempmm solrad eeq etm etr tmp trp swdef swdf1 swdf2 swan djbl djgrow pari stmo Observed dry mass of millable stalks (T/ha) Observed humidity of millable stalks (% fresh mass) Observed sucrose content in millable stalk (% fresh mass) Observed fibre content in millable stalk (% fresh mass) Observed brix (corrected) in the juice of millable stalk (% Juice) Observed purity of the juice of millable stalk (% Juice). Observed dry mass of green blades (T/ha) Observed dry mass of total blades (T/Ha) Observed fresh mass of aboveground biomass including trash and dead stalks (T/ha) Observed dry mass of aboveground biomass including trash and dead stalks (T/ha) Observed humidity of aboveground biomass including trash and dead stalks (% fresh mass) Observed dry mass of trash and dead stalks (T/ha) Simulated soil water content (cm3/cm3) of layer 1 Simulated soil water content (cm3/cm3) of layer 2 Simulated soil water content (cm3/cm3) of layer 3 Simulated soil water content (cm3/cm3) of layer 4 Simulated soil water content (cm3/cm3) of layer 5 Simulated soil water content (cm3/cm3) of layer 6 Simulated available water capacity down to soil depth (mm) Simulated available water capacity down to soil depth (mm) Simulated available water capacity down to root depth (mm) Observed soil water content (cm3/cm3) of layer 1 Observed soil water content (cm3/cm3) of layer 2 Observed soil water content (cm3/cm3) of layer 3 Observed soil water content (cm3/cm3) of layer 4 Observed soil water content (cm3/cm3) of layer 5 Observed soil water content (cm3/cm3) of layer 6 Observed available water capacity down to soil depth (mm) Observed available water capacity down to root depth (mm) Simulated root deptn (cm) Simulated root length density of layer 1 Simulated root length density of layer 2 Simulated root length density of layer 3 Simulated root length density of layer 4 Simulated root length density of layer 5 Simulated root length density of layer 6 Rainfall of the day (mm) Minimum temperature of the day (mm) Maximum temperature of the day (mm) Actual average temperature of the day (mm) Global incident radiation of the day (MJ/m2) Evapotranspiration Pennman-Monteith of the day (Eto mm). Maximum evapotranspiration of the day (mm). Actual evapotranspiration of the day (mm). Maximum transpiration of the day (mm) Actual transpiration of the day (mm) Soil water defficiency index of the day (0-1) Water defficiency index of the day (0-1) fir biomass acuumulation Water defficiency index of the day (0-1) for growth Water anaerobic index of the day (0-1) Degree days of the day (°C) for leaf appearance Degree days of the day (°C) for growth (elongation) Intercepted photosynthetic radiation of the day (MJ/m2) Sum of mean temperatures since beginning of simulation ((Tempmn+tempmx)/2) Sum of incident photosynthetic radiation (solrad/2) since the beginning of simulation (MJ/m 2) Sum of intercepted photosynthetic radiation since the beginning of simulation (MJ/m2) Sum of rainfall since beginning of simulation (mm) Sum of irrigation since beginning of simulation (mm) Sum of Evapotranspiration Pennman-Monteith (eeq) since beginning of simulation (mm) 110 spar spari spr sirr setp setm 111 setr Sum of actual evapotranspiration (etr) since beginning of simulation (mm) 112 stmp Sum of maximum transpiration (tmp) since beginning of simulation (mm) 113 strp Sum of actual transpiration (trp) since beginning of simulation (mm) 105 106 107 108 109 Sum of maximum evapotranspiration (etm) since beginning of simulation (mm) Sum of degree days (djbl) since beginning of simulation (°C) for leaf appearance 114 sddbla 115 116 117 swdefm swdf1m swdf2m 118 sddgr Sum of degree days (djgrow) since beginning of simulation (°C) for growth (elongation) 119 sdrain Sum of drained water since beginning of simulation (mm) 120 121 srunoff sddblat Sum of runoff since beginning of simulation (mm) Sum of degree days (djbl) since appearance of millable stalk biomass (°C) for leaf appearance Sum of degree days (djgrow) since appearance of millable stalk biomass (°C) for growth (elongation) Sum of intercepted photosynthetic radiation since appearance of millable stalk biomass (MJ/m2) Average soil water defficiency index since appearance of millable stalk biomass (0-1) Average water defficiency index since appearance of millable stalk biomass (0-1) for biomass acuumulation Average water defficiency index since appearance of millable stalk biomass (0-1) for growth Sum of mean temperatures since appearance of millable stalk biomass ((Tempmn+tempmx)/2) Sum of maximum evapotranspiration (etm) since appearance of millable stalk biomass (mm) Sum of actual evapotranspiration (etr) since appearance of millable stalk biomass (mm) Sum of runoff since appearance of millable stalk biomass (mm) Sum of drained water sinceappearance of millable stalk biomass (mm) Sum of Evapotranspiration Pennman-Monteith (eeq) since appearance of millable stalk biomass (mm) Sum of maximum transpiration (tmp) since appearance of millable stalk biomass (mm) Sum of actual transpiration (trp) since appearance of millable stalk biomass (mm) Day length of the day (h) Global extraterrestrial solar radiation of the day (MJ/m2) sddgrt 122 123 124 sparit swdeft swdf1t 125 126 127 128 129 130 131 swdf2t stmot setmt setrt srunofft sdraint 132 133 134 135 136 setpt stmpt strpt durjour srgx Average soil water defficiency index since beginning of simulation (0-1) Average water defficiency index since beginning of simulation (0-1) for biomass acuumulation Average water defficiency index since beginning of simulation (0-1) for growth 2/ Calibration Output File (calibres.csv) when simulation type is calibration Columns Definitions no nomsim Number of treatment list if several lists of treatments are choosen in sheet "Simulation" of SimMosicas.xlsm Name of the list (sheet "Simulation", row 9) RmseIni Initial Root mean square error (Rmse) before optimisation RmseOpt final Root mean square error (Rmse) after optimisation parnom Name of the calibrated parameter parvopt optimum value of the calibrated parameter parvdeb Value (central) of the calibrated parameter at the begining of optimisation parvmin Minimum value of the calibrated parameter during optimisation parvmax Maximum value of the calibrated parameter during optimisation Appendix C Description of the Plant parameters Name Definition blk rate of blade appearance (plant parameter) blkdec attenuation coefficient for blade appearance (plant parameter) blsurfk area growth rate of tvd blades according to blades number (plant parameter) blsurfmax maximun area of tvd blades (plant parameter) bltb base temperatures for blades appearance (plant parameter) blvmax maximum green blades number (plant parameter) htvdcan TVD height stage after which elongation rate is greater (plant parameter) htvdgro1 first rate of elongation (cm/øJ) (plant parameter) htvdgro2 second rate of elongation after htvdcan stage (cm/øJ) (plant parameter) htvdtb base temperature for stalk height increasz (plant parameters) htvdtm maximum temperature for stalk height increasz (plant parameters) htvdto optimum temperature for stalk height increasz (plant parameters) humaerdeb initial above ground biomass water content % (Plant parameter) humaerdec Rate of decrease in above ground biomass water content (Plant parameter ) humaerfin begining in decrease of above ground biomass water content (Plant parameter) humaertb Base temperature for above ground biomass water content (Plant parameter) ke extinction coefficient (plant parameter) laicroi growth rate of lai (plant parameter) laitb base temperaturefor lai calculation (plant parameter) laiwksen sensitivity of lai to water stress (plant parameter) p01 coefficient for maintenance effect on conversion. Plant parameter. p04 coefficient for diffused radiation effect on conversion. Plant parameter. pflor maximum observed % of flowering (plant parameter) pstrudec Extinction coefficient of daily fraction of millable stalk dry mas allocated to structures Plant parameter pstrufin Final daily fraction of millable stalk dry mass allocated to structures Plant parameter g/g pstrutb Temperature threshold from which fraction of millable stalks dry mass allocated to structures is decreasing. Plant parameter pstrutcroi Temperature effect on daily fraction of millable stalks dry mas allocated to structures /øC. Plant parameter ptigdeb Beginning of millable stalk dry mass appearance (Plant parameter (g/m2) ptigdec Extinction coefficient of daily fraction of aboveground dry mass allocated to millable stalk (Plant parameter) ptigfin Final daily fraction of aboveground dry mass allocated to millable stalk (Plant parameter) ruemax conversion coefficient of intercepted photosynthetic radiation into total dry mass (gr/MJ. Plant parameter) ruetopt Optimum temperature for conversion. Plant parameter. ruetk Effect of temperature on conversion. Plant parameter. sthydbio Sensitivity to water stress index (swdf1) for mass accumulation. Plant parameter sthydcroi Sensitivity to water stress index (swdf2) for growth. Plant parameter taldebtt TT (termal time) to reach appearance of first stalks. Plant parameter talfinval Final value of alive stalks (/m2). Plant parameter talpeaktt TT to reach tillering peak. Plant parameter talpeakval Value of tillering peak. Plant parameter taltb base temperature for stalk appearance. Plant parameter
