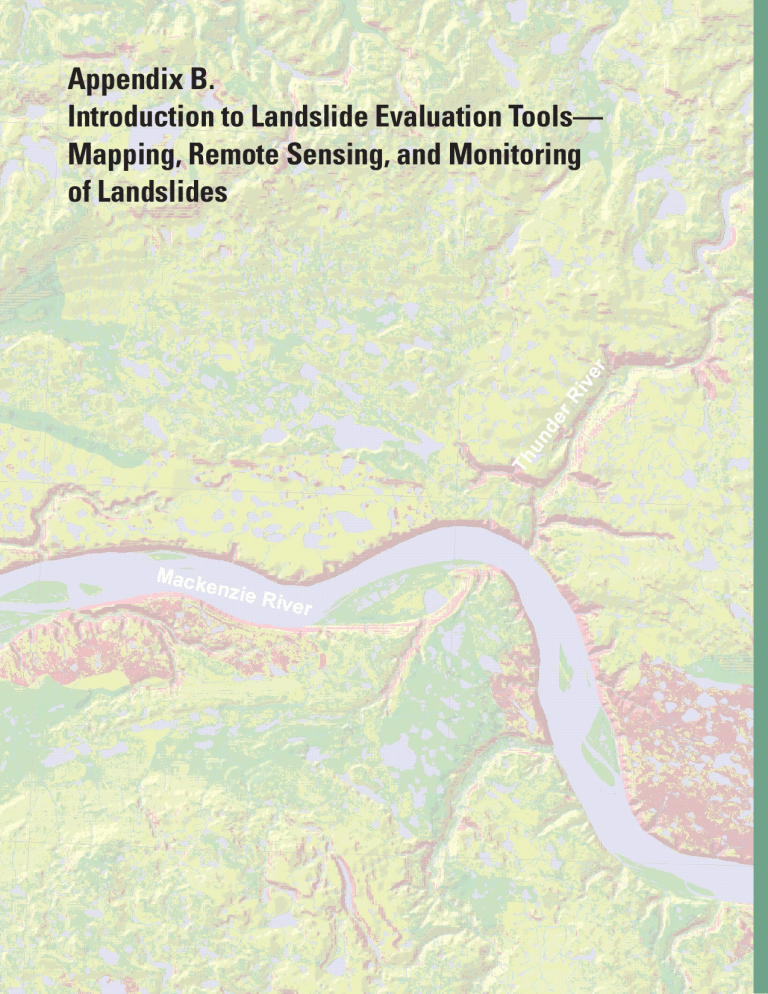
Appendix B. Introduction to Landslide Evaluation Tools— Mapping, Remote Sensing, and Monitoring of Landslides 66 The Landslide Handbook­—A Guide to Understanding Landslides Part 1. Mapping Maps are a useful and convenient tool for presenting information on landslide hazards. They can present many kinds and combinations of information at different levels of detail. Hazard maps used in conjunction with land-use maps are a valuable planning tool. Commonly, there is a three-stage approach to landslide hazard mapping. The first stage is regional or reconnaissance mapping, which synthesizes available data and identifies general problem areas. This regional scale (sometimes called “small-scale”) mapping is usually performed by a Provincial, State, or Federal geological survey. The next stage is community-level mapping, a more detailed surface and subsurface mapping program in complex problem areas. Finally, detailed site-specific large-scale maps are prepared. If resources are limited, it may be more prudent to bypass regional mapping and concentrate on a few known areas of concern. We discuss three types of general mapping; (1) Regional, (2) Community level, and (3) Site specific. Regional mapping Regional or reconnaissance mapping supplies basic data for regional planning by providing baseline information for conducting more detailed studies at the community and site-specific levels and for setting priorities for future mapping. Such maps are usually simple inventory or susceptibility maps and are directed primarily toward the identification and delineation of regional landslide problem areas and the conditions under which they occur. They concentrate on those geologic units or environments in which additional movements are most likely. The geographical extent of regional maps can vary from a map of a State or Province to a national map, which delineates an entire country. Such mapping relies heavily on photogeology (the geologic interpretation of aerial photography), reconnaissance field mapping, and the collection and synthesis of all available pertinent geologic data. Map scales at this level are typically at scales ranging from 1:10,000 down to 1:4,000,000 or even smaller. Community-level mapping This type of mapping identifies both the three-dimensional potential of land sliding and considers its causes. Guidance concerning land use, zoning, and building, and recommendations for future site-specific investigations also are made at this stage. Investigations should include subsurface exploratory work in order to produce a map with cross sections. Map scales at this level typically vary from 1:1,000 to 1:10,000. Site-specific mapping Site-specific mapping is concerned with the identification, analysis, and solution of actual site-specific problems, often presented in the size of a residential lot. It is usually undertaken by private consultants for landowners who propose site development and typically involves a detailed drilling program with downhole logging, sampling, and laboratory analysis in order to procure the necessary information for design and construction. Map scales vary but usually are about 1:600 or 25 mm (1 inch) equal to 16 m (50 feet). Part 1. Mapping 67 Three Important Criteria for Landslide Maps The three types of landslide maps most useful to planners and the general public are (1) landslide inventories, (2) landslide susceptibility maps, and (3) landslide hazard maps. Landslide inventory maps Inventories denote areas that are identified as having failed by landslide processes (fig. B1). The level of detail of these maps ranges from simple reconnaissance inventories that only delineate broad areas where landsliding appears to have occurred to complex inventories that depict and classify each landslide and show scarps, zones of depletion and accumulation, active and inactive slides, geological age, rate of movement, and (or) other pertinent data on depth and kind of materials involved in sliding. Simple inventories give an overview of the areal extent of landslide occurrence and highlight areas where more detailed studies should be conducted. Detailed inventories provide a better understanding of the different landslide processes operating in an area and can be used to regulate or prevent development in landslide-prone areas and to aid the design of remedial measures. They also provide a good basis for the preparation of derivative maps, such as those indicating slope stability, for rating landslide hazard, and to identify land use. One way is to use aerial photography with selective field checking to detect landslide areas and then to present the information in map form using a coded format. The maps show any or all of the following: state of activity, certainty of identification, dominant types of slope movement, estimated thickness of landslide material, type of material, and dates or periods of activity. In the United States, regional maps are most often prepared at a scale of 1:24,000 (1:50,000 in Canada) because high-quality U.S. Geological Survey topographic base maps at this scale are widely available and aerial photographs are commonly of a comparable scale. Other scales commonly used in the United States, for example, include 1:50,000 (county series), 1:100,000 (30 × 60 minute series), and 1:250,000 (1 × 2 degree series). EXPLANATION Study area Drainages Landslides Elevation, in meters 149−251 252−354 355−456 457−559 560−661 662−764 765−866 867−969 970−1,071 1,072−1,174 Figure B1. Example of a landslide inventory map showing the locations of past landslides and including topographical information consisting of elevation (measured in meters) and drainage courses (map from U.S. Geological Survey). 68 The Landslide Handbook­—A Guide to Understanding Landslides Landslide susceptibility maps A landslide susceptibility map goes beyond an inventory map and depicts areas that have the potential for landsliding (fig. B2). These areas are determined by correlating some of the principal factors that contribute to landsliding (such as steep slopes, weak geologic units that lose strength when saturated or disturbed, and poorly drained rock or soil) with the past distribution of landslides. These maps indicate only the relative stability of slopes; they do not make absolute predictions. Landslide susceptibility maps can be considered derivatives of landslide inventory maps because an inventory is essential for preparing a susceptibility map. For example, overlaying a geologic map with an inventory map that shows existing landslides can identify specific landslide-prone geologic units. This information can then be extrapolated to predict other areas of potential landsliding. More complex maps may include additional information such as slope angle and drainage. Figure B2. An example of a landslide susceptibility map. This map shows an area in Canada, the Mackenzie River Valley, Northwest Territories. Graphic by Réjean Couture, Geological Survey of Canada. Part 1. Mapping 69 Landslide hazard maps Hazard maps show the areal extent of threatening processes (fig. B3): where landslide processes have occurred in the past, recent occurrences, and most important, the likelihood in various areas that a landslide will occur in the future. For a given area, hazard maps contain detailed information on the types of landslides, extent of slope subject to failure, and probable maximum extent of ground movement. These maps can be used to predict the relative degree of hazard in a landslide area. Areas may be ranked in a hierarchy such as low, moderate, and high hazard areas. Relative hazard High (more than 75 shallow landslides/km2) Medium (20−75 shallow landslides/km2) Failure locations from landslide database ug et P Low (fewer than 20 shallow landslides/km2) So un d Figure B3. Portion of shallow landslide hazard map showing part of the Magnolia area of the city of Seattle, Washington, USA. (km2 is notation for square kilometers.) For mapping references and further reading: 4, 12, 18, 19, 21, 25, 29, 33, 34, 35, 41 and 46. 70 The Landslide Handbook­—A Guide to Understanding Landslides Part 2. Remote Sensing and Other Tools that Show Features of Landslide Activity Maps and other forms of information are sometimes overlaid on each other using a GIS (Geographical Information System) so that the different types of information can be viewed all at once. In the absence of a GIS computerized system, transparencies can be made of each map and then can be overlaid together. It is important that the maps and data be at the same scale. The following list describes many types of information that might be useful in constructing layers for GIS analysis of landslide potential. • Topographic Map Indicates slope gradient, terrain configuration, drainage pattern. • Terrain Map Identifies material, depth, geological processes, terrain configuration, surface and subsurface drainage, slope gradient (also called surficial geology or Quaternary geology maps). • Bedrock Map Identifies bedrock type, surface and subsurface structure, surficial cover (overburden), and age of rock over a topographic map base. • Engineering Soil Map Identifies surficial material type, drainage, limited engineering characteristics, soils characteristics, vegetation cover. • Forest Cover Map Identifies surface vegetation, topographic features, surface drainage pattern, and in some cases, soil drainage character. • Research Studies May provide information on all of the above, plus quantitative data on controlling factors and possibly local stability risk assessment. • Aerial Photography Remote Sensing (Examples shown in figs. B4 through B7.) Identification can be made of vegetation cover, topography, drainage pattern, soil drainage character, bedrock geology, surficial geology, landslide type, and relationship to other factors. Careful study of a given area of terrain with the aid of oblique aerial photographs and vertical stereo pairs can yield significant information on landslide type and frequency and the effects of management practices. A review of recent and past aerial photographs of the area should be undertaken whenever possible, as older slides may not be evident on more recent photographs. Features discernible on aerial photographs can help users identify landslide type and develop a reasonable assessment of overburden characteristics. These, in turn, provide a means for estimating the landslide hazard at a site. • InSAR Imaging InSAR is an acronym for Interferometric Synthetic Aperture Radar. Both InSAR and LIDAR (description follows) use active sensors emitting a pulse of energy (from a satellite) and recording its return, from the ground, at the sensor. Most InSAR equipment is able to penetrate fog and rain and can be used in areas difficult to access by foot. By bouncing signals from a radar satellite off the ground, digital elevation model (DEM) maps can be produced that will show the ground terrain. Two images of the same place are taken at different times then merged, forming a map called an interferogram. The merging of the two images shows the ground displacement (if any) that would indicate any movement that has occurred between the time the two images were taken. In this way, one can determine if a hillside, for example, has moved. Ordinary radar on a typical Earth-orbiting satellite has a very poor ground resolution of about 3 to 4 miles because of the restricted size of the antenna on the satellite. Synthetic Aperture Radar (SAR) takes advantage of the motion of the spacecraft along its orbital track to mathematically reconstruct (synthesize) an operationally larger antenna and yield high-spatialresolution imaging capability on the order of hundreds of feet. Part 2. Remote Sensing and Other Tools that Show Features of Landslide Activity 71 Figure B4. An example of an aerial photograph of the La Conchita landslide in California, USA, taken in 2005. Blue line delineates an older landslide, yellow a more recent landslide. (Photograph courtesy of AirPhoto USA and County of Ventura, California, and Randy Jibson, U.S. Geological Survey.) Figure B5. Schematic showing satellite passes over an area of the Earth’s surface (graphic modified from Reference 41.) 72 The Landslide Handbook­—A Guide to Understanding Landslides Figure B6. Interferogram from InSAR imaging process showing the area of uplift (1997–2001) at the Three Sisters volcanoes (red triangles) in the Cascade Range in central Oregon, USA (circles show locations of earthquakes). (Photograph modified from Reference 41.) Part 2. Remote Sensing and Other Tools that Show Features of Landslide Activity 73 • LiDAR Imaging LiDAR is an acronym for Light Detection and Ranging, also known as ALSM or Airborne Laser Swath Mapping. Using a narrow laser beam to probe through dense ground cover, such as trees, LiDAR can produce accurate terrain maps even where forest cover gets in the way of traditional photography. The technique produces a very accurate Digital Elevation Model map (DEM) (fig. B7). Accurate bare-earth DEMs can be produced when the imagery is acquired during the leaf-off season in areas covered by deciduous forests. Essential elements of a LiDAR mapping system are a scanning laser rangefinder mounted in an aircraft, differential Global Positioning System (GPS) to locate the aircraft, and an internal measurement unit (IMU) to measure aircraft orientation. LiDAR is a useful topographic mapping tool for three reasons. First is accuracy, the second is productivity; measurements are made at rates of 10,000 to 80,000 laser pulses per second. Third, LiDAR is monoscopic and provides its own illumination. These characteristics overcome the major liabilities of photogrammetry in forested terrain. The maps produced by LiDAR are very clear and detailed and in many cases reveal evidence of past landslides that are virtually invisible by other means due to heavy vegetation cover. LiDAR is expensive and highly technical and is used mainly by government agencies, universities, and some private entities. One drawback is that many LiDAR systems use a near-infrared laser that does not penetrate fog or rain. Figure B7. An oblique LiDAR image of La Conchita, California, USA, landslide, taken in 2005. Outline of 1995 (blue) and 2005 (yellow) landslides are shown; arrows show examples of other landslides in the area; red line outlines main scarp of an ancient landslide that involved the entire bluff. (Photograph by Airborne 1, El Segundo, California, USA, and Randy Jibson, U.S. Geological Survey.) For remote sensing and other map references and further reading: 4, 12, 14, 15, 18, 19, 21, 24, 35, 39, and 41 74 The Landslide Handbook­—A Guide to Understanding Landslides Part 3. Real-Time Monitoring of Landslides and Landslide Instrumentation For more information: References 4, 21, 25, 28, 35, 38, 39, and 46 The immediate detection of landslide activity that is provided by real-time systems can be crucial in saving human lives and protecting property. Traditional field observations, even if taken regularly, cannot detect changes at the moment they occur. Moreover, active landslides can be hazardous to work on, and large movements often occur during storms when visibility is poor. The continuous data provided by remote real-time monitoring permits a better understanding of dynamic landslide behavior that, in turn, enables engineers to create more effective designs to prevent or halt landslides. Landslide monitoring can be expensive, and most monitoring systems require installation by experts. The advantage is that systems that detect landslide movement can be coordinated with warning systems. Figure B8. Measuring landslide movement using an extensometer, an instrument that can detect movement of the ground surface between stable ground and sliding ground. (Photograph by Richard LaHusen, U.S. Geological Survey.) Figure B9. Testing a solar-powered radiotelemetry system for remote transmission of real-time landslide data. (Photograph by Mark Reid, U.S. Geological Survey.) Slope movement sensor Monitoring Instruments nt eme n ctio Rain gage Dire ov of m Shallow pore pressure Battery Geophone Deep pore pressure Figure B10. Example of a network for measurement and transmission of real-time landslide data. (Schematic from U.S. Geological Survey.)

