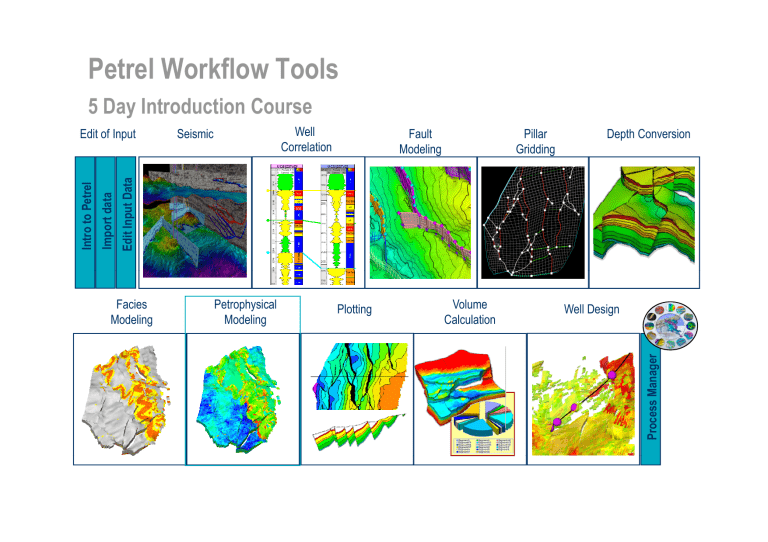
Petrel Workflow Tools 5 Day Introduction Course Well Correlation Seismic Fault Modeling Pillar Gridding Depth Conversion Edit Inpu ut Data Facies Modeling Petrophysical Modeling Plotting Volume Calculation Well Design Process M Manager Import d data Intro to P Petrel Edit of Input Petrophysical Modeling Objectives Discuss Different Petrophysical Modeling Techniques – Deterministic techniques – Stochastic techniques Learn How to Use Common Settings – Setting filters – Using many realizations Learn How to Use Zone Settings – Define zones Use The Different Algorithms – Sequential Gaussian Simulation – QC results lt Property Calculator Overview • • If well logs g are up-scaled, p , theyy can be used in Deterministic and Stochastic modelingg If no logs are available, deterministic methods cannot be used, only unconditional stochastic methods. Deterministic Interpolation with smooth effect Kriging, Moving average Petrophysical p y Stochastic Regenerate local variation Sequential Gaussian Simulation SGS Common Settings Two main buttons are available: • Common • Zone Settings Define Common settings for all zones: • Use filter • Ensure that all cells gget a value • Number of realizations Zone Settings 1. Define Zone settings for each zone: A A. P Press the th Zones Z b tt button. B. Select zone of interest from the dropdown menu. 1A 1B 2. Select proper modeling technique: A. Press the padlock button to open the settings for the selected zone B. Select a method from the drop-down menu for the zone 2 A 2 B Sequential Gaussian Simulation (SGS) – Set Up 1A 11. Property and zone selection A. Make sure to pick the correct upscaled property ([U] as suffix). B. Select SGS as method for the zone. 2B 1B 2. Variogram tab: A. Specify Range, Nugget and Type B. or get a variogram from Data Analysis 3. Distribution tab: • S l t Standard Select St d d andd From F Upscaled U l d logs l 2A Used if upscaled logs Used if no/few upscaled logs From distribution function 3 Sequential Gaussian Simulation (SGS) – Results SGS is a krig-based stochastic method • Needs a variogram. • Will honor h the th distribution di t ib ti of the input data (upscaled logs). • Petrel will automatically do a Normal score transformation before the simulation, and will backt transform f th the ddata. t • The output is distributed in a blurry manner. QC Results QC results in a histogram: • Go to the Settings for the Property and select Histogram tab • Check that the Histogram follows th di the distribution t ib ti ffrom: 1) Raw logs 2) Upscaled cells 3) 3D grid Filter: 4) Use Zone filter 5) Filter on other property values by pressing the filter button and go to Property filter in Settings for the Properties folder. folder 1-3 4 5 Property Calculator – SW Property Example SW is a function of height above fluid contact, contact permeability and porosity. Two main options: 1) Type in a simple expression expression. This requires: • Above Contact property from Geometrical modeling. • Function (imported or made in Petrel (SW vs. height)). x 2) Load a more advanced expression (.mac/.txt file): • Toggle From file, browse and Run. = EXERCISE Petrophysical Modeling
