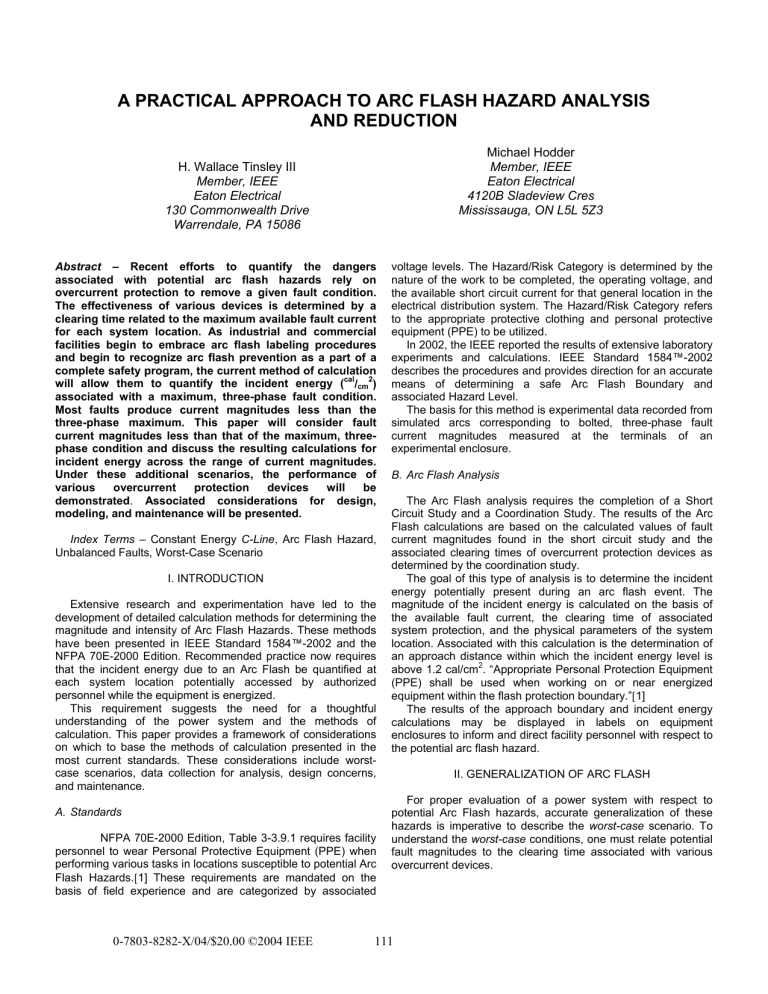
A PRACTICAL APPROACH TO ARC FLASH HAZARD ANALYSIS AND REDUCTION Michael Hodder Member, IEEE Eaton Electrical 4120B Sladeview Cres Mississauga, ON L5L 5Z3 H. Wallace Tinsley III Member, IEEE Eaton Electrical 130 Commonwealth Drive Warrendale, PA 15086 Abstract – Recent efforts to quantify the dangers associated with potential arc flash hazards rely on overcurrent protection to remove a given fault condition. The effectiveness of various devices is determined by a clearing time related to the maximum available fault current for each system location. As industrial and commercial facilities begin to embrace arc flash labeling procedures and begin to recognize arc flash prevention as a part of a complete safety program, the current method of calculation will allow them to quantify the incident energy (cal/cm2) associated with a maximum, three-phase fault condition. Most faults produce current magnitudes less than the three-phase maximum. This paper will consider fault current magnitudes less than that of the maximum, threephase condition and discuss the resulting calculations for incident energy across the range of current magnitudes. Under these additional scenarios, the performance of various overcurrent protection devices will be demonstrated. Associated considerations for design, modeling, and maintenance will be presented. Index Terms – Constant Energy C-Line, Arc Flash Hazard, Unbalanced Faults, Worst-Case Scenario I. INTRODUCTION Extensive research and experimentation have led to the development of detailed calculation methods for determining the magnitude and intensity of Arc Flash Hazards. These methods have been presented in IEEE Standard 1584™-2002 and the NFPA 70E-2000 Edition. Recommended practice now requires that the incident energy due to an Arc Flash be quantified at each system location potentially accessed by authorized personnel while the equipment is energized. This requirement suggests the need for a thoughtful understanding of the power system and the methods of calculation. This paper provides a framework of considerations on which to base the methods of calculation presented in the most current standards. These considerations include worstcase scenarios, data collection for analysis, design concerns, and maintenance. A. Standards NFPA 70E-2000 Edition, Table 3-3.9.1 requires facility personnel to wear Personal Protective Equipment (PPE) when performing various tasks in locations susceptible to potential Arc Flash Hazards.[1] These requirements are mandated on the basis of field experience and are categorized by associated 0-7803-8282-X/04/$20.00 ©2004 IEEE voltage levels. The Hazard/Risk Category is determined by the nature of the work to be completed, the operating voltage, and the available short circuit current for that general location in the electrical distribution system. The Hazard/Risk Category refers to the appropriate protective clothing and personal protective equipment (PPE) to be utilized. In 2002, the IEEE reported the results of extensive laboratory experiments and calculations. IEEE Standard 1584™-2002 describes the procedures and provides direction for an accurate means of determining a safe Arc Flash Boundary and associated Hazard Level. The basis for this method is experimental data recorded from simulated arcs corresponding to bolted, three-phase fault current magnitudes measured at the terminals of an experimental enclosure. B. Arc Flash Analysis The Arc Flash analysis requires the completion of a Short Circuit Study and a Coordination Study. The results of the Arc Flash calculations are based on the calculated values of fault current magnitudes found in the short circuit study and the associated clearing times of overcurrent protection devices as determined by the coordination study. The goal of this type of analysis is to determine the incident energy potentially present during an arc flash event. The magnitude of the incident energy is calculated on the basis of the available fault current, the clearing time of associated system protection, and the physical parameters of the system location. Associated with this calculation is the determination of an approach distance within which the incident energy level is above 1.2 cal/cm2. “Appropriate Personal Protection Equipment (PPE) shall be used when working on or near energized equipment within the flash protection boundary.”[1] The results of the approach boundary and incident energy calculations may be displayed in labels on equipment enclosures to inform and direct facility personnel with respect to the potential arc flash hazard. II. GENERALIZATION OF ARC FLASH For proper evaluation of a power system with respect to potential Arc Flash hazards, accurate generalization of these hazards is imperative to describe the worst-case scenario. To understand the worst-case conditions, one must relate potential fault magnitudes to the clearing time associated with various overcurrent devices. 111 A. Fault Magnitudes IEEE Standard 1584TM-2002 cautions, “it is important to determine the available short–circuit current for modes of operation that provide both the maximum and the minimum available short-circuit currents.”[2] The importance of this statement is demonstrated when an off-peak maintenance scenario is compared with the full load operating condition. A hazardous arc flash condition may arise from various causes, and often occurs during maintenance. Maintenance tasks are often performed at times when the facility and/or its processes are not fully operational. Although the power system is energized, some of the contributing motor loads may be shut down. Therefore, during maintenance operations, when the propensity for arc flash conditions is high, the available fault current may be significantly lower than the calculated maximum. UTIL-0001 69000 V Figure 1 Max. Fault Conditions 2 customers supplied by a single utility substation. BUS-0001 69000 V 3P Mom 2.537 kA CBL-0011 Length 500.0 ft XF2-0009 10000.0 kVA Pri 69000 V Sec 13800 V CBL-0001 Length 500.0 ft @ Typical 480V Substation: Max I a (Arcing Fault Current) = 29kA BUS-0021 13800 V 3P Mom 6.108 kA Customer #1 Utility Substation XF2-0001 10000.0 kVA Pri 69000 V Sec 13800 V BUS-0003 13800 V 3P Mom 6.108 kA Customer #2 CBL-0015 Length 600.0 ft CBL-0012 Length 200.0 ft BUS-0022 13800 V MTRI-0009 3P Mom 6.098 kA 1000.0 hp CBL-0013 CBL-0014 Length 600.0 ft Length 600.0 ft CBL-0005 Length 600.0 ft 1000.0 hp CBL-0003 Length 600.0 ft XF2-0012 2500.0 kVA Pri 13800 V Sec 480 V XF2-0010 2500.0 kVA Pri 13800 V Sec 480 V XF2-0011 2500.0 kVA Pri 13800 V Sec 480 V XF2-0004 2500.0 kVA Pri 13800 V Sec 480 V XF2-0002 2500.0 kVA Pri 13800 V Sec 480 V XF2-0003 2500.0 kVA Pri 13800 V Sec 480 V BUS-0026 480 V 3P LV 57.983 kA BUS-0010 480 V 3P LV 57.983 kA BUS-0007 480 V 3P LV 57.983 kA BUS-0008 480 V 3P LV 57.983 kA BUS-0028 480 V 3P LV 57.983 kA MTRI-0012 2200.0 hp BUS-0025 480 V 3P LV 57.983 kA MTRI-0010 2200.0 hp CBL-0002 Length 200.0 ft MTRI-0001 MTRI-0011 2200.0 hp MTRI-0004 2200.0 hp UTIL-0001 69000 V Figure 2 Min. Fault Conditions 2 customers supplied by a single utility substation. Customer #1 BUS-0001 69000 V 3P Mom 2.060 kA CBL-0011 Length 500.0 ft XF2-0009 10000.0 kVA Pri 69000 V Sec 13800 V MTRI-0002 2200.0 hp CBL-0001 Length 500.0 ft @ Typical 480V Substation: Min I a (Arcing Fault Current) = 21kA BUS-0004 13800 V 3P Mom 6.098 kA CBL-0004 Length 600.0 ft MTRI-0003 2200.0 hp Utility Substation XF2-0001 10000.0 kVA Pri 69000 V Sec 13800 V BUS-0021 13800 V 3P Mom 4.423 kA BUS-0003 13800 V 3P Mom 4.423 kA CBL-0012 Length 200.0 ft BUS-0022 13800 V 3P Mom 4.412 kA CBL-0002 Length 200.0 ft Customer #2 BUS-0004 13800 V 3P Mom 4.412 kA CBL-0015 Length 600.0 ft CBL-0013 Length 600.0 ft CBL-0014 Length 600.0 ft CBL-0005 Length 600.0 ft CBL-0003 Length 600.0 ft CBL-0004 Length 600.0 ft XF2-0012 2500.0 kVA Pri 13800 V Sec 480 V XF2-0010 2500.0 kVA Pri 13800 V Sec 480 V XF2-0011 2500.0 kVA Pri 13800 V Sec 480 V XF2-0004 2500.0 kVA Pri 13800 V Sec 480 V XF2-0002 2500.0 kVA Pri 13800 V Sec 480 V XF2-0003 2500.0 kVA Pri 13800 V Sec 480 V BUS-0026 480 V 3P LV 39.046 kA BUS-0010 480 V 3P LV 39.046 kA BUS-0007 480 V 3P LV 39.046 kA BUS-0008 480 V 3P LV 39.046 kA BUS-0028 480 V 3P LV 39.046 kA MTRI-0012 220.0 hp BUS-0025 480 V 3P LV 39.046 kA MTRI-0010 220.0 hp MTRI-0011 220.0 hp MTRI-0004 220.0 hp Figures 1 & 2 112 MTRI-0002 220.0 hp MTRI-0003 220.0 hp To demonstrate the effect of various scenarios, we have modeled a sample system that represents three facilities that are supplied by a single utility substation. A portion of this system is shown in Figures 1 and 2. In the Figure 1, all contributing motors are in service and the utility contribution is at a maximum. In Figure 2, the low voltage motors have been reduced to 10% of full-load and the medium voltage motors have been removed. The same is true for the adjacent neighbors and the total fault contribution at a typical 480V substation is significantly decreased. The magnitude of the available bolted fault current is decreased from Figure 1 to Figure 2 by approximately 30%. The arcing current is also reduced by approximately 30% between the two figures. For the calculation of incident energy, we should consider the range defined by this minimum calculation and this maximum calculation for any given location. determined by the actual magnitude of arcing fault current for a given occurrence. For a given location, there exists a series of potential arcing fault current magnitudes and theoretical clearing times for which incident energy remains constant. Several of these series are shown in Figure 3. On a log-log plot, these combinations of constant energy points with respect to time and current appear as a linear line segments. For a typical low-voltage, grounded, enclosed substation, these selected lines correspond to the PPE classes outlined in IEEE Standard 1584TM-2002. The lowest line shown in Figure 3 represents a constant energy of 1.2cal/cm2. This corresponds to the upper limit of PPE Class 0. The uppermost line represents the maximum value of 40 2 cal/cm for which PPE Class 4 provides sufficient protection. Above this line, no PPE class has been presently described in the NFPA 70E-2000 Edition. B. Constant Energy CURRENT IN AMPERES TM By the method presented in IEEE Standard 1584 -2002, incident energy (E) is calculated for specific system locations. This calculated value of energy is determined by the physical environment at the given location and the duration of a previously calculated magnitude of arcing fault current. The duration of the fault condition is dependent on the clearing time of the upstream overcurrent protection. This clearing time is 1000 100 Arcing Fault Current Magnitude: 1.0kA Incident Energy: 52.2 cal/cm2 Constant Energy with respect to Time and Current 100.00 10 5 cal/cm2 PPE Class 4 Arcing Fault Current Magnitude: 1.5kA Incident Energy: 10.6 cal/cm2 8 cal/cm2 PPE Class 3 FUSE-200A 25 cal/cm2 40 cal/cm2 10.00 1 Time (sec) PPE Class 2 PPE Class 1 TIME IN SECONDS 1.2 cal/cm2 Arcing Fault Current Magnitude: 3.0kA Incident Energy: 1.5 cal/cm2 Arcing Fault Current Magnitude: 4.0kA Incident Energy: 0.8 cal/cm2 0.10 1.00 PPE Class 0 0.01 0.5 1 10 100 1K 10K Ref. Voltage: 480 Current Scale x10^2 0.10 Figure 4 C. Overcurrent Device Responses 0.1 1 10 Arcing Fault Current (kA) Figure 3 0.01 100 For the majority of system locations that are protected by a fuse, the minimum available arcing fault current is the basis of the worst-case calculation for incident energy. (See Figure 4.) For a system location protected by a circuit breaker, the worstcase calculations vary with the regions of the clearing characteristic. When the considered range of fault current 113 magnitudes falls completely within any region of the timecurrent curve (TCC) across which the time remains constant, the maximum available fault current will result in the calculation of the worst-case incident energy. Such regions include definitetime relays and definite-time delay regions of electronic trip unit characteristics. (See Figure 5.) For regions of the TCC where 2 4 the tripping characteristic is inverse or based on the I t or I t model, the lower arcing fault values will correspond to longer clearing times; resulting in the worst-case scenario. (See Figure 5.) CURRENT IN AMPERES 1000 100 CB-200A Arcing Fault Current Magnitude: 1.0kA Incident Energy: 3.0 cal/cm2 Arcing Fault Current Magnitude: 1.5kA Incident Energy: 1.9 cal/cm2 1 TIME IN SECONDS 10 E = (4.184) ⋅ Cf ⋅ 10 (K1 + K 2 + 1.081⋅ log (Ia ) + 0.0011 G)⋅ ( t t E Cf Arcing Fault Current Magnitude: 4.0kA Incident Energy: 0.7 cal/cm2 Instantaneous (Definite Time) Tripping K1 K2 0.5 1 10 100 1K 10K Ia Ref. Voltage: 480 Current Scale x10^2 Figure 5 G x D III. TIME, CURRENT, & ENERGY RELATIONSHIP 0.20 ) ⋅ (610 x Dx ) Where: E is energy in Joules/cm2. Cf is a calculation factor, equal to 1.0 for voltages above 1kV and 1.5 for voltages at or below 1kV. K1 is -0.792 for open configurations (no enclosure) and is -0.555 for closed configurations (enclosed). K2 is 0 for ungrounded and HRG systems and is -0.133 for grounded systems. Ia the magnitude of the arcing fault current (kA) that may be determined according to IEEE 1584TM-2002, equation (1). G is the gap between conductors (mm). t is the duration of the arc (seconds). x is the distance exponent. D is the distance from the arc to the worker (mm.) t= 0.10 0.01 Equation (1): Equation (2): Arcing Fault Current Magnitude: 3.0kA Incident Energy: 0.5 cal/cm2 Short Time (I2t) Tripping and calories has also been included so that the units of Energy 2 (E) in Equation (2) are cal/cm . (4.184) ⋅ Cf ⋅ 10 E ⋅ (0.20 ) ⋅ 4.1667 x ⎛ ⎞ ⋅ ⎜ 610 x ⎟ D ⎝ ⎠ (K1 + K 2 + 1.081⋅ log (I a ) + 0.0011 G) is the duration of the arc (seconds). 2 is energy in cal/cm . is a calculation factor, equal to 1.0 for voltages above 1kV and 1.5 for voltages at or below 1kV. is -0.792 for open configurations (no enclosure) and is -0.555 for closed configurations (enclosed). is 0 for ungrounded and HRG systems and is -0.133 for grounded systems. the magnitude of the arcing fault current (kA) that may be determined according to IEEE 1584TM-2002, equation (1). is the gap between conductors (mm). is the distance exponent. is the distance from the arc to the worker (mm.) A. Relationship Equations In order to demonstrate the worst-case arc-flash scenario across a given range of arcing fault currents, constant-energy lines can be plotted on the TCC plot in conjunction with tripping characteristics of various devices. TM For voltage levels less than 15kV, the IEEE 1584 -2002 presents the equation for incident energy as shown in Equation (1) [2]. The values for the variables shown in this equation are presented in Table 1. In equation (1), the units of energy are Joules/cm2. Equation (2) shows Equation (1) algebraically rearranged in order to calculate values for time with respect to a given set of parameters. The conversion factor between Joules Equation (3) shows the linear relationship between time and arcing current with respect to a given energy and specific system parameters shown in Table 1. With the aid of curvefitting software [3], this relationship was found consistent for all system configurations considered. Equation (3): t = k ⋅ (I a ) b Where: t is time in seconds. 114 k is a unique constant based on specific system parameters (See Table 1 for a summary and the discussion below for details.) Ia is the magnitude of arcing fault current b is a constant value = -1.081. Constant k is determined for each system location according to system parameters and a distance factor related to the equipment type and the system location voltage. This determination was made according to the following steps: 1. For each system location considered, a finite series of time-current ordered pairs (Ia, t) was found, for which incident energy remains constant. (See Equation (1) and Figure 3) 2. This series of ordered pairs (Ia, t) was provided as input for the curve-fitting software [3]. 3. The resulting time versus current plot was consistently fitted with a curve of the form shown in Equation (3). The constant b (-1.081) remained constant regardless of the system parameters. The constant k was found to be unique for each new set of parameters. The system parameters are shown in Table 1 and include: system voltage, equipment type, bus gap (mm), working distance (mm), enclosure configuration, and grounding. For some typical system locations, Table 1 shows the resulting values for the unique constant k. With a point defined on a TCC plot by the magnitude for arcing fault current and the associated clearing time for a specific device; it is useful to define a corresponding line that represents all combinations of time and arcing current for which energy remains constant with respect to the given point. This line on the TCC plot is called a C-line, and the points (Ia, t) along this line of constant energy can be defined by the constant C in Equation (4). Equation (4): C= t k ⋅ (I a ) -1.081 For a given system location (defined by k), C is a unique constant describing the relationship of a finite series of time and current combinations for which energy remains constant. For increasing energy, C is also increasing. Using this relationship, any two regions on a TCC can be compared to determine the “worst-case” scenario. Consider the clearing time for both the maximum and minimum fault conditions and let the ordered pair, (Ia1, t1), represent the maximum arcing fault current and the associated clearing time. Let the ordered pair, (Ia2, t2), represent the minimum arcing fault current and the associated clearing time. Compare as follows: Set C1 = t 1 k ⋅ (I a1 ) -1.081 and C 2 = t 2 k ⋅ (I a2 ) -1.081 Table 1 System Voltage (kV) Calculation Factor (Cf) Equipment Type Gap (G) (mm) Working Distance factor Distance (D) (x) (mm) Enclosure Configuration (K1) 10 2.000 455 -0.792 40 2.000 455 -0.792 Switchgear 32 1.473 610 -0.555 MCC and Panels 25 1.641 455 -0.555 Cable 13 2.000 455 -0.792 Open Air 102 2.000 455 -0.792 13 0.973 910 -0.555 102 0.973 910 -0.555 13 2.000 455 -0.792 13 2.000 455 -0.792 153 2.000 455 -0.792 Switchgear 153 0.973 910 -0.555 Cable 13 2.000 455 -0.792 Open Air* 0.208 - 1 >1 - 5 1.5 1.0 Switchgear* Cable Open Air* >5 - 15 1.0 * Minumum and maximum values are shown for a range of typical bus gaps (G). TM System parameter values are based on IEEE Standard 1584 -2002, Tables 2, 3, & 4. 115 Grounded or Unique Constant Ungrounded (k) (K2) -0.113 0.6945 0 0.5354 -0.113 0.6437 0 0.4962 -0.113 0.6841 0 0.5274 -0.113 0.4304 0 0.3318 -0.113 0.6893 0 0.5314 -0.113 0.8252 0 0.6362 -0.113 1.5890 0 1.2250 -0.113 1.2683 0 0.9778 -0.113 1.0339 0 0.7970 -0.113 1.0339 0 0.7970 -0.113 0.7252 0 0.5591 -0.113 1.1146 0 0.8593 -0.113 1.0339 0 0.7970 If C1 > C2, then E1 > E2 and vice versa. The larger value for C will correspond to the energy (E) greater value. Using the relationship one can quickly determine the worstcase condition between any number of scenarios (time and arcing current) at a given location. B. Software Application On a standard time-current curve (TCC), software packages could use a location-specific C-Line to provide a visual representation for the severity of several incident energy calculations within the range of possible arcing fault conditions at a given location. Provided with the values shown for k in Table 1, a C-line can be generated for each device with respect to the bus location immediately downstream or with respect to a selected bus downstream of several devices. To aid in overcurrent device coordination, the unique C-Line will visually demonstrate which setting regions might be adjusted to reduce the arc flash hazard. Figure 6 shows the tripping characteristics of two devices. The electronic-trip circuit breaker is shown as the 480V main breaker of a typical unit substation. The fuse characteristic is representative of the primary device on the 13.8kV side of the source transformer. PRI-FUSE CURRENT IN AMPERES 1000 XFMR-PRI XFMR After determining maximum and minimum magnitudes of the available bolted fault currents at the substation bus, the corresponding arcing fault magnitudes can be calculated. These arcing fault current magnitudes are calculated according to TM IEEE Standard 1584 -2002 using specific system parameters. Given these parameters, the appropriate value for k may be selected from Table 1 or alternatively, k can be calculated for system parameters not found in the table. In Figure 6, the maximum arcing fault current magnitude (Ia1) of 15.7kA is shown. For an arc flash event at the substation bus, the associated clearing time of the main breaker will be used to determine the incident energy for this ordered pair (Ia1, t1). A clearing time of 0.323 seconds is shown for t1. Similarly, for an arc flash event on the line side of the main breaker or the secondary terminals of the substation transformer, the incident energy is determined by the clearing time of the primary fuse. This point on the plot for the maximum arcing current and associated clearing time is shown as (15.7kA, 4.1s). Figure 6 also shows the minimum magnitude of the available arcing fault current at the substation bus. This minimum value of available fault current (Ia2 = 9.1kA) relates to the systemoperating scenario when motor contributions are the lowest. The time required to clear the potential arc flash event from the substation bus is 2.7 seconds, and is shown in the long-delay region of the circuit breaker trip unit. Likewise, for an event on the line side of the substation main breaker or the secondary PRI-FUSE XFMR-SEC CURRENT IN AMPERES LV-CU-BUS PRI-FUSE XFMR-PRI 1000 LV-SUB-MAIN XFMR LV-SUB-BUS 100 XFMR-SEC Fuse clearing time for minimum arcing fault current (Ia2): 90s LV-SUB-MAIN PRI-FUSE LV-CU-BUS LV-SUB-MAIN 100 [D] (9.1kA, 90s) LV-SUB-MAIN 10 C-Line for primary fuse Fuse clearing time for maximum arcing fault current (Ia1): 4.1s Breaker clearing time for minimum arcing fault current (Ia2): 2.7s TIME IN SECONDS TIME IN SECONDS LV-SUB-BUS 1 [C] (15.7kA, 4.1s) [B] (9.1kA, 2.7s) 1 C-Line for LV substation main breaker Breaker clearing time for maximum arcing fault current (Ia1): 0.323s 0.10 10 [A] (15.7kA, 0.323s) Minimum arcing fault magnitude: 9.1kA 0.10 Maximum arcing fault magnitude: 15.7kA 0.01 0.5 1 Minimum arcing fault magnitude: 9.1kA Maximum arcing fault magnitude: 15.7kA 10 100 1K 0.01 0.5 1 10K C-Line Example Ref. Voltage: 480 Current Scale x10^2 10 100 1K C-Line Example Ref. Voltage: 480 Current Scale x10^2 Figure 6 Figure 7 116 10K terminals of the transformer, the time required for the primary fuse to clear the fault is found to be 90 seconds. Using the points that correspond to the maximum value of arcing fault current, a unique C-line is drawn for each protective device characteristic in Figure 7. From Equation (4), the C-line for each device is determined with the value of k selected from Table 1 and the time-current pairs associated with the maximum available arcing fault current. By visual inspection of Figure 7, it is shown that, for both protective devices, the greatest incident energy is present under the minimum fault condition. This is evident because the point on the tripping characteristic of each device that is associated with the minimum arcing fault magnitude is shown above the Cline that passes through the similar point associated with the maximum available fault current. Each time-current point on a TCC that is above a given C-Line has a corresponding value for incident energy (E) that is greater than the value of incident energy (E) associated with all points shown on or below this CLine. The tripping characteristic of the main breaker is plotted in Figure 8. The breaker’s maximum clearing time at the maximum arcing fault current of 15.7kA is shown to be 0.323 seconds. 2. Select (Ia1, t1) to correspond to the maximum arcing fault current and the associated clearing time: (15.7kA, 0.323). 3. Calculate C from Equation (4) C= 0.323 t ⇒C= ⇒ C = 16.213 ⋅ 103 k ⋅ (Ia )-1.081 0.6841 ⋅ (15.7 ⋅ 103 )-1.081 Remember, C is only an energy specific constant. 4. Select Ia2: 9.1kA This value can be any other current value on the plot, but it is convenient to use the calculated minimum value. 5. Calculate t2 using Equation (4): PRI-FUSE C = 16.213 ⋅ 103 = CURRENT IN AMPERES XFMR-PRI t2 0.6841 ⋅ (9.1 ⋅ 103 )-1.081 ⇒ t 2 = 0.583s 1000 XFMR 6. Connect the two points with a line segment. This is the C-Line associated with the substation main breaker. XFMR-SEC LV-CU-BUS 100 LV-SUB-MAIN PRI-FUSE LV-SUB-MAIN CURRENT IN AMPERES XFMR-PRI LV-SUB-BUS 1000 TIME IN SECONDS XFMR XFMR-SEC 10 PRI-FUSE LV-CU-BUS LV-SUB-MAIN 100 LV-SUB-MAIN Step #1: From Table 1, select k = 0.6841 1 Step #6: Draw C-Line & extend LV-SUB-BUS Step #2: Select (Ia1, t1) = (15.7kA, 0.323s) Original C-Lines from Figure 7 0.50 0.10 Step #5: Calculate t2 = 0.583s) TIME IN SECONDS 0.30 Step #3: Calculate C = 16.213*103 Minimum arcing fault magnitude: 9.1kA Maximum arcing fault magnitude: 15.7kA 0.01 0.5 1 Step #4: 10 Select Ia2 = 9.1kA 100 1K 10 [D] (9.1kA, 4.0s) 1 [A] (15.7kA, 0.24s) [B] (9.1kA, 0.24s) 10K [C] (15.7kA, 0.21s) C-Line Example Ref. Voltage: 480 Current Scale x10^2 0.10 Figure 8 Minimum arcing fault magnitude: 9.1kA Maximum arcing fault magnitude: 15.7kA The plotting of the C-Line line may be automated within a software package, but can be quickly plotted, by hand. For the main substation breaker in this particular scenario, the following steps are demonstrated in Figure 8: 0.01 0.5 1 10 100 1K C-LINE EXAMPLE Ref. Voltage: 480 Current Scale x10^2 1. For a typical, solidly grounded, low voltage switchgear location, select the value for k from Table 1: 0.6841. 117 Figure 9 10K Using the C-Line in Figure 8, one can be visually observe that the minimum arcing fault condition has a higher incident energy that the maximum arcing condition. Following the determination of the worst-case scenario, system changes may be recommended or specified to reduce the incident energy potentially present at the substation bus. Figure 9 shows a change in settings for the main breaker and a change in fuse type for the primary device. In both cases, the original C-lines are still shown for comparison. For the electronic-trip circuit breaker, the maximum magnitude for arcing fault current now corresponds to with the worst-case scenario. For the primary fuse, the minimum magnitude for arcing fault current remains the worst-case scenario, but the potential incident energy has been reduced in comparison to the primary fuse type that is shown in Figures 6 and 7. Figures 6 to 9 represent only one specific scenario. Coordination with upstream and downstream devices, the protection of the transformer damage curve, and other considerations have not be plotted or included in this example. The results of this method of analysis will vary for each system location studied. tests have only described the magnitude of the arcing fault currents associated with 3-phase faults, we do understand that hazardous arcing conditions can occur under unbalanced faults. As a “rule of thumb” IEEE Std 141-1993 describes the arcing current magnitudes with respect to the calculated 3-phase fault current.[5] The magnitudes of unbalanced arcing faults are significantly lower than those arcs associated with 3-phase faults. As previously noted, the worst-case scenario may be represented by the fault condition supplying the maximum magnitude of fault current to a location or it may be the minimum magnitude condition that results in the most dangerous calculation with respect to incident energy. While many unbalanced faults may escalate, after some interval of time, to a 3-phase fault, requirements for personnel protection should be established on the worst-case scenario. While no standard currently provides direction in this area, the associated hazards should not be ignored and continued research and testing should further quantify these conditions. In additional to this visual tool, software packages should be able to provide a comparison between multiple scenarios, cases, or revisions of a project. At the user’s discretion, the system could be analyzed according to the maximum available fault current and with respect the minimum available fault currents. The resulting energy levels for each location could be compared between the two scenarios and the resulting worstcase calculations could be reported and used for the arc flash labeling of the equipment. In order to perform a careful arc flash hazard analysis, the generally accepted approaches to short circuit and coordination studies should be modified. With respect to a device evaluation study, maximum available fault currents are always considered.[6] For this type of study, “extreme precision [in data collection] is unnecessary.”[5] For arc flash hazard analysis, the safety of the facility personnel is directly related to the precision of the data collection. Inaccuracies and conservative assumptions during the collection of data may result in a compromised situation for workers for whom a particular Class of PPE has been prescribed. The accepted philosophy for coordination of protective devices must also be reconsidered when performing an arc flash hazard analysis. For a coordination study “effort…is directed toward minimizing the impact of short circuits on system components and the industrial process the system serves.”[4] This is accomplished by considering the appropriate compromise between selectivity and system continuity and the careful analysis of the relationship between “primary and backup protection.” [4] With the additional analysis required for the reduction of potential arc flash hazards, personnel protection is now considered (in addition to system and equipment protection). Properly coordinated settings now require an appropriate compromise between selectivity, system continuity, and the greatest reasonable reduction of incident energy. III SYSTEM MODELS AND ANALYSIS Successful determination of the appropriate range of fault magnitudes requires careful consideration during the development of the system model. A. Data Collection In order to provide accurate calculations for incident energy, the system data should be as accurate as possible. System [2] cables should be modeled with accurate lengths. For existing equipment, this distance cannot be measured, but must be estimated. The more accurately this distance is estimated, the more accurately the equipment can be labeled to protect facility personnel. Transformer impedances should be modeled according to nameplate impedance values. While design impedances may differ only slightly, the smallest variation of available fault current may significantly effect the magnitude of the incident energy calculated for a given location. Contributions from utility substations may fluctuate during various switching scenarios or maintenance procedures. A range of possible contributions should be obtained and evaluated to facilitate the determination of the worst-case scenario. B. Unbalanced Faults Of the various types of fault geometry a power system may experience – 3-phase, line-to-line, single-line-to-ground, and double-line-to-ground; single-line-to-ground faults are the most common.[4] For a given power system, the magnitudes of these various fault conditions may be calculated. While extensive C. Analysis Philosophy IV. CONSIDERATIONS AND SOLUTIONS The challenge of reducing potential arc flash hazards; affords engineers, designers, and maintenance staff the opportunity to implement creative solutions to protect personnel. For new systems, the design process should be an integral component in the reduction of incident energy at various system locations. Transformer sizing and the thoughtful distribution of contributing loads will reduce the levels of available fault current throughout the system. Subsequently, the incident energy levels may be further reduced by properly specifying and sizing overcurrent protection. Current-limiting circuit breakers and fuses may be a possible solution if the arcing fault current causes them to operate in their current limiting range. Additional protection schemes, such as differential relays and zone-interlocking 118 should be considered as a part of the system design. Engineers responsible for system studies should carefully utilize the available devices and thoughtfully consider the recommended sizing and settings for various means of system protection. Maintenance personnel may find creative solutions to allow for a more practical class of PPE. Remote racking equipment for breakers and small, pre-installed apertures for IR cameras are among the practical solutions currently available. [3] [3] [4] [5] V. CONCLUSIONS In conclusion, the worst-case scenario for an Arc Flash Hazard cannot be stated with a simple generalization. Dependent on the clearing time characteristics of overcurrent devices, the worst-case scenario must be determined across the range of possible fault current magnitudes. Continued research and testing will further enhance the understanding of the worst-case conditions for each system location. Unbalanced arcing faults present a particularly important area for continued research. Creative use of existing system protection devices provides some relief from the potential intensity of an arc flash hazard, and careful sizing and loading of equipment increases the safety of facility personnel. Research and development efforts should continue to develop arc flash protection capable of responding to the unique qualities of an arc flash condition. Until then, overcurrent protection is an effective means of reducing the intensity of arc flash hazards. Various tools, such as the constant energy Clines presented in this paper, should be employed to aid engineers, designers, and facility personnel in the sizing and calibrating of overcurrent devices for the protection of equipment and personnel. ACKNOWLEDGEMENT The authors thank W. S. Vilcheck for his sponsorship, advice, and encouragement; and D. M. Wood, J. Rankin, and T. Dionise for their comments. REFERENCES [1] Electrical Safety Requirements for Employee Workplaces, NFPA 70E 2000 Ed. [2] IEEE Guide for Performing Arc-Flash Hazard Calculations, IEEE Std 1584TM-2002. [3] D. Hyams, CurveExpert 1.38. [4] IEEE Recommended Practice for Protection and Coordination, IEEE Std 242-2001. [5] IEEE Recommended Practice for Electrical Power Distribution, IEEE Std 141-1993. [6] IEEE Recommended Practice for Industrial and Commercial Power Systems Analysis, IEEE Std 399-1990. [1] [2] 119

