2. ANALYTICAL TOOLS
Goals: After reading this chapter, you will
1. Know the basic concepts of statistics: expected value, standard deviation, variance,
covariance, and coefficient of correlation.
2. Use Maple effectively to solve portfolio related problems.
2.1
Video 01B, Statistical Quantities
Before we can study portfolio theory in earnest, it is desirable to develop some useful
tools that will make the study a little easier. The subject of statistics plays a vital role in
describing the uncertain outcomes of events. For example, we may not know the exact
return of an investment, but we can say something about its expected return. We can say
that the expected return of Ford stock is 15%, but we are not sure about it. To assess the
accuracy of our estimate we can use another parameter called the standard deviation of
returns.
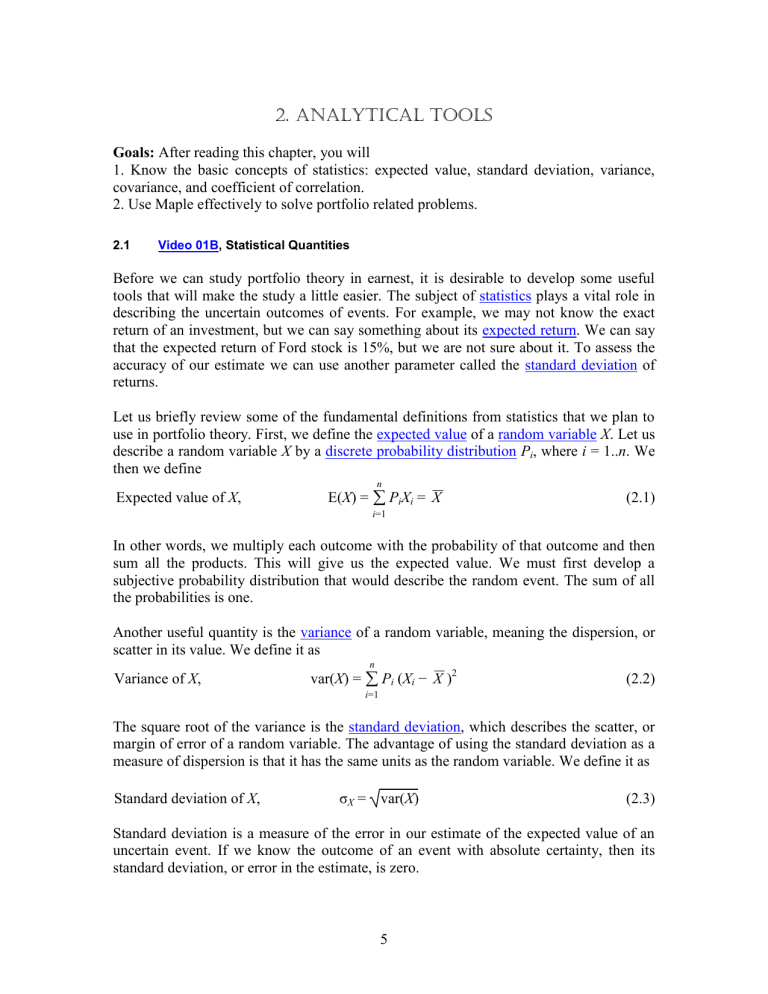
Let us briefly review some of the fundamental definitions from statistics that we plan to
use in portfolio theory. First, we define the expected value of a random variable X. Let us
describe a random variable X by a discrete probability distribution Pi, where i = 1..n. We
then we define
n
Expected value of X,
E(X) = PiXi = X
(2.1)
i=1
In other words, we multiply each outcome with the probability of that outcome and then
sum all the products. This will give us the expected value. We must first develop a
subjective probability distribution that would describe the random event. The sum of all
the probabilities is one.
Another useful quantity is the variance of a random variable, meaning the dispersion, or
scatter in its value. We define it as
n
Variance of X,
var(X) = Pi (Xi − X )2
(2.2)
i=1
The square root of the variance is the standard deviation, which describes the scatter, or
margin of error of a random variable. The advantage of using the standard deviation as a
measure of dispersion is that it has the same units as the random variable. We define it as
Standard deviation of X,
σX = var(X)
(2.3)
Standard deviation is a measure of the error in our estimate of the expected value of an
uncertain event. If we know the outcome of an event with absolute certainty, then its
standard deviation, or error in the estimate, is zero.
5
Portfolio Theory
2. Analytical Tools
_____________________________________________________________________________
Quite often, two random events are interrelated. The value of one depends on the other.
For instance, the return of one bank stock may depend upon the return of another bank
stock. This is because the entire banking industry may benefit from lower interest rates,
or lower reserve requirements of the Federal Reserve.
The interdependence of two random variables, or their interaction, is expressed in terms
of their covariance, defined as
n
Covariance between X and Y,
cov(X,Y) = Pi (Xi − X )(Yi − Y )
(2.4)
i=1
The quantity covariance is difficult to use in practice. A more practical parameter is the
quantity rXY , the correlation coefficient between X and Y, which is defined as
rXY =
cov(X,Y)
σ Xσ Y
cov(X,Y) = σXσYrXY
Or,
(2.5)
(2.6)
There are at least two advantages of using the correlation coefficient. First, it is a
dimensionless number, and second, its value lies between +1 and −1. That is
−1 < rXY < 1
(2.7)
The correlation coefficient between two random variables measures their
interdependence. A strong linkage between them will result in a correlation coefficient
close to 1. If the correlation coefficient is exactly 1, then the two variables are perfectly
positively correlated. For correlation coefficient close to zero, the two variables are quite
independent of each other. If the two variables are completely negatively correlated, the
correlation coefficient between them will be −1.
2.2
Continuous Probability
Consider a standardized test, such at SAT. The test scores of a large number of
candidates will tend to show a certain pattern. The scores will tend to bunch around the
mean score, and fall off on both sides. The normal probability distribution function can
describe this pattern in an approximate way. If the mean score is μ and the standard
deviation of the scores is σ, then the normal probability distribution function, P(x) is
P(x) =
2
2
1
e−(x−μ) /2σ
σ 2π
(2.8)
For σ = 1 and μ = 0, it simplifies to the standard normal distribution, n(x)
n(x) =
1 −x2/2
e
2π
6
(2.9)
Portfolio Theory
2. Analytical Tools
_____________________________________________________________________________
An arbitrary normal distribution becomes a standard normal distribution by changing
variables to z = (x − μ)/σ, and dz = dx/σ. Thus
n(x) dx =
1 −z2/2
e
dz
2π
(2.10)
The cumulative normal distribution function N(d) gives the probability that a standard
normal variate assumes a value in the interval [−∞, d], where
1 d −z2/2
N(d) =
dz
e
2π −∞
(2.11)
One can calculate the value of N(d) by using the table in Chapter 13. The plot of n(x) for
−3 < x < 3 is in the following diagram.
Figure 2.1: The normal probability density function n(x) as defined by (2.9).
To understand these concepts, consider the following example.
Example
2.1. A financial analyst has developed the following data about the state of the economy
and the returns of two stocks.
State of the Economy Probability Return on GM Return on Ford
Good
50%
35%
30%
Average
30%
10%
5%
Poor
20%
−30%
−25%
7
Portfolio Theory
2. Analytical Tools
_____________________________________________________________________________
Find: (a) The expected return of both stocks.
(b) The standard deviation of the stocks.
(c) The correlation coefficient between GM and Ford.
(a) The expected value of the return for each stock is
GM:
Ford:
E(R) = .5*.35 + .3*.1 .2*.3 = .145 = 14.5%
E(R) = .5*.3 + .3*.05 − .2*.25 = .115 = 11.5%
(b) We find the standard deviation as
GM: σ(R) = .5(.35 − .145)2 + .3(.1 − .145)2 + .2(−.3 − .145)2 = .2474
Ford: σ(R) = .5(.3 − .115)2 + .3(.05 − .115)2 + .2(−.25 − .115)2 = .2122
The somewhat higher σ of GM implies that there is greater uncertainty in the returns of
this stock.
(c) Next, we calculate the covariance between the stocks. We do it as
cov(G,F) = .5(.35−.145)(.3−.115) + .3(.1−.145)(.05−.115) + .2(−.3−.145)( −.25−.115)
= .052325
From (2.6), we have
rGF =
cov(G,F)
.052325
=
σGσF
.2474 * .2122 = .9967
The extremely high value of correlation coefficient, which is nearly 1, says that the two
companies are almost carbon copies of one another. The impact of the economic
conditions on the two companies is almost identical.
2.3
Excel
It is important that the students are able to set up finance problems using Excel, which is
now a standard of business and industry. A good working knowledge of this software
should be an integral part of every business student’s education. Almost all business
programs offer courses in the use of this software. If you want to brush up your skill in
the use of Excel, you may go the following Microsoft website for a variety of tutorials.
http://office.microsoft.com/en-us/training/CR100479681033.aspx
To get started on Excel, consider one of the previous problems that we solved by using
the logarithm function.
1.2. Solve for x:
1.113x = 2.678
8
Portfolio Theory
2. Analytical Tools
_____________________________________________________________________________
Set up the table shown below. Adjust the number in the green cell B2 until the numbers
in cells B3 and B4 come very close together. B2 gives the answer.
1
2
3
4
A
Base =
Unknown power =
Result (given) =
Result(calculated) =
B
1.113
9.201184226
2.678
=B1^B2
It is possible to embed an Excel table within a Word document. To do that, go the Insert
tab in a Word document. When it opens, click on Table. In the Table menu, click on
Excel Spreadsheet near the bottom. An Excel sheet opens up, where you can do your
work. When you finish your Excel work, click anywhere on the Word document, and you
can leave Excel. To go back into the Excel spreadsheet, double-click on the table, which
will reveal all the calculations and formulas.
Next, consider example 2.1 on page 7 again. Set it up on Excel as follows. The numerical
results of the formulas in cells B5:B10 are given in green cells C5:C10. The principal
advantage of Excel is that it can handle large tables of numbers.
1
2
3
4
5
6
7
8
9
10
2.4
A
State of the Economy
Good
Fair
Poor
E(G)
E(F)
Cov(G,F)
sigma(G)
sigma(F)
r(G,F)
B
Probability
60%
30%
10%
=B2*C2+B3*C3+B4*C4
=B2*D2+B3*D3+B4*D4
=B2*(C2-B5)*(D2-B6)+B3*(C3-B5)*(D3-B6)+B4*(C4-B5)*(D4-B6)
=SQRT(B2*(C2-B5)^2+B3*(C3-B5)^2+B4*(C4-B5)^2)
=SQRT(B2*(D2-B6)^2+B3*(D3-B6)^2+B4*(D4-B6)^2)
=B7/B8/B9
C
Return on GM
35%
10%
-30%
0.145
0.115
0.052325
0.247436861
0.212190952
0.996593337
D
Return on Ford
30%
5%
-25%
Video 01C Maple
Maple is a powerful computer software that can do complex mathematical calculations.
Working with Maple is quite easy. You simply turn the computer on, click on the Maple
button, and you are ready to work. The help facility is extremely valuable and it can
guide the user through different steps with illustrative examples. It makes working with
Maple exciting and fun. Maple is an extremely versatile analytical tool. It is used
extensively in science, mathematics, engineering, and finance. Any time spent in learning
this program can pay rich dividends in greater accuracy and higher productivity. The
following instructions should get you started in the use of Maple.
Since Maple interprets capital and lower case letters distinctly, we should use the
symbols carefully. Maple has many built in mathematical functions and constants, such
as
ln, exp, Pi, sin, sqrt
9
Portfolio Theory
2. Analytical Tools
_____________________________________________________________________________
Maple can do exact arithmetic calculations and displays the answer in its totality. For
example, we need the exact value of 264, or the factorial of 50, or the value of π to 50
significant figures. We do this as follows: enter the commands at the > prompt, end each
line with a semicolon, and strike the return key.
2^64;
18446744073709551616
50!;
30414093201713378043612608166064768844377641568960512000000000000
evalf(Pi,50);
3.1415926535897932384626433832795028841971693993751
Here
evalf
calculates the result in floating point with 50 significant figures. Maple can also do
algebraic calculations. For instance, to solve the equations
5x + 6y = 7
6x + 7y = 8
for x and y, we enter the instructions as follows:
eq1:=5*x+6*y=7;
eq1 := 5 x + 6 y = 7
eq2:=6*x+7*y=8;
eq2 := 6 x + 7 y = 8
solve({eq1,eq2},{x,y});
{y = 2, x = –1}
The symbol
:=
is used specifically to define objects in Maple. In other words, if we type in
eq1;
then the computer will recall the equation defined as eq1 and display it as
5x+6y=7
10
Portfolio Theory
2. Analytical Tools
_____________________________________________________________________________
Maple can also do differentiation and integration. Consider the function
ln x
x3 + x
To differentiate this function with respect to x, we type in
diff(x^3+ln(x)/x,x);
1 ln(x)
3 x2 + x2 − x2
To integrate the result with respect to x, recreating the original function, we enter
int(%,x);
ln x
x3 + x
Here we use
%
as a symbol to designate the previous expression.
We can also use Maple to plot functions. For instance, if we want to see the visual
representation of the well-known sine wave, we write
plot(sin(x),x=0..2*Pi);
which gives the diagram shown below.
Fig. 2.2: Plot of sin x for 0 < x < 2π
It is possible to add text in the plots, draw three-dimensional or animated plots, or draw
plots in color. All plots in this book are drawn with the help of Maple.
11
Portfolio Theory
2. Analytical Tools
_____________________________________________________________________________
2.5
Wolfram|Alpha
Mathematica is another analytical software, which has capabilities similar to Maple. It
can perform all the mathematical problems equally well. Mathematica has a website at
Wolfram|Alpha, which is free to use. The instructions at Wolfram|Alpha are almost
identical to those in Maple. You should explore this website and use it when you do not
have access to Maple.
For instance, to solve the equations
5x + 6y = 7
6x + 7y = 8
for x and y, enter the instructions as follows:
5x+6y=7,6x+7y=8
When you click on the = sign, it provides the solution as x = −1, y = 2.
To see the sine wave of Figure 1.1, write
Plot[Sin[x],{x,0,2Pi}]
Example
2.2. A portfolio made of stocks of Oslo Company and Quito Company has E(Rp) = 12%
and βp = 1.3. The β of Oslo is 1.4 and that of Quito 1.1. The risk-free rate is 8%. Find the
expected return on the market, and the weights of the two stocks in the portfolio.
To set it up on Maple, we proceed as follows.
ERp := .12;
betap := 1.3;
beta1 := 1.4;
beta2 := 1.1;
RF := .08;
eq1 := ERp = w1*ER1 + w2*ER2;
eq2 := betap = w1*beta1 + w2*beta2;
eq3 := ERp = RF + betap*(ERm - RF);
eq4 := ER1 = RF + beta1*(ERm - RF);
eq5 := ER2 = RF + beta2*(ERm - RF);
solve({eq1,eq2,eq3,eq4,eq5},{w1,w2,ER1,ER2,ERm});
The desired result is
w1 = .6667, w2 = .3333, E(R1) = 12.31%, E(R2) = 11.38%, and E(Rm) = 11.08%. ♥
12
Portfolio Theory
2. Analytical Tools
_____________________________________________________________________________
Problems
2.3. You have developed the following data about the state of the economy and the
returns of two stocks.
State of the Economy Probability Return on Dell Return on Intel
Good
50%
25%
35%
Average
30%
5%
5%
Poor
20%
−35%
0%
Find: (a) The expected return of both the stocks.
(b) The standard deviation of the stocks.
(c) The correlation coefficient between Dell and Intel
7%, 19% ♥
22.72%, 16.09% ♥
85.35% ♥
2.4. Write a set of Maple instructions to solve problem 2.3.
n:=3;
P:=array(1..n, [.5,.3,.2]);
R1:=array(1..n, [.25,.05,-.35]);
R2:=array(1..n, [.35,.05,0]);
ER1:=sum(P[i]*R1[i],i=1..n);
ER2:=sum(P[i]*R2[i],i=1..n);
SD1:=sqrt(sum(P[i]*(R1[i]-ER1)^2,i=1..n));
SD2:=sqrt(sum(P[i]*(R2[i]-ER2)^2,i=1..n));
Cov12:= sum(P[i]*(R1[i]-ER1)*(R2[i]-ER2),i=1..n);
r12:=Cov12/SD1/SD2;
Solve the following equations with the help of Maple:
2.5.
16x – 54 = 15x – 32
2.6.
(x +1) (x – 2) = (x – 1) (x + 2)
2.7.
(10 x + 3) (3 x + 4) = (5 x + 6) (6 x + 7)
2.8.
x−2 x−7
x−3=x−9
x = −3 ♥
2.9.
x+4 x+6
x+5=x+8
x = −2 ♥
2.10.
2.11.
x = 22 ♥
x=0♥
x = −15/11 ♥
2x + 6y = 32
5x + 8y = 45
x = 1, y = 5 ♥
3x + 4y = 15
5x + 8y = 45
x = −15, y = 15 ♥
13
Portfolio Theory
2. Analytical Tools
_____________________________________________________________________________
2.12.
(1 + x)3.2 = 8.4
x = 0.9446 ♥
2.13.
1.767x = 3.876
x = 2.38 ♥
2.14.
3.909x = 15.99
x = 2.033 ♥
2.15.
2x2 + 7x − 9 = 0
x = 1, −9/2 ♥
2.16.
3x2 + 4x − 7 = 0
x = 1, −7/3 ♥
Multiple-Choice Question
1. An example of a correct Maple instruction is
A. z:=ln(a*x)/x^4
B. U:=ln(5W)/7-exp(-W);
C. plot(y^3/4+y^2/sin(y),y=1..2;
D. solve({5*x+y=6,x*y+y=2},{x,y});
14
