HLA antigens in amerindian groups of two different linguistic briceno1996
Anuncio
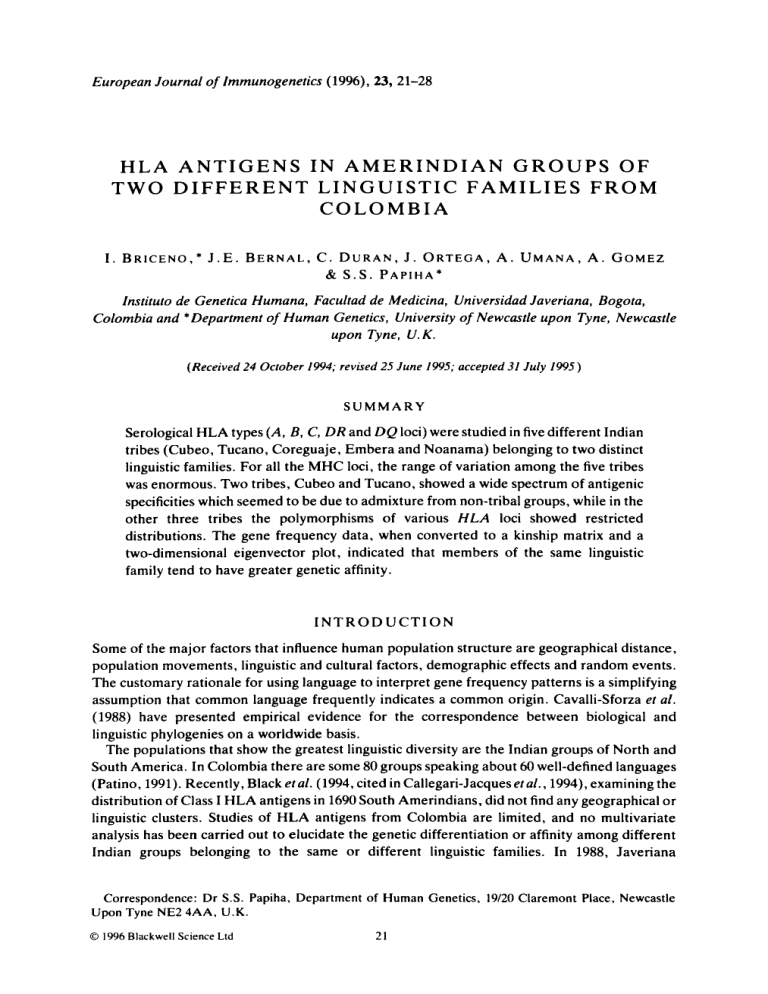
European Journal of Immunogenetics (1996), 23, 21-28 H L A A N T I G E N S IN A M E R I N D I A N G R O U P S O F TWO DIFFERENT LINGUISTIC FAMILIES FROM COLOMBIA I . B R I C E N O ,J*. E . B E R N A LC, . D U R A NJ, . O R T E G AA , . U M A N AA , . GOMEZ & S.S. P A P I H A * lnstituto de Genetica Humana, Facultad de Medicina, Universidad Javeriana, Bogota, Colombia and *Department of Human Genetics, University of Newcastle upon Tyne, Newcastle upon Tyne, U . K . (Received 24 October 1994; revised 25 June 1995; accepted 31 July 1995) SUMMARY Serological HLA types ( A , B, C , DR and DQ loci) were studied in five different Indian tribes (Cubeo, Tucano, Coreguaje, Embera and Noanama) belonging to two distinct linguistic families. For all the MHC loci, the range of variation among the five tribes was enormous. Two tribes, Cubeo and Tucano, showed a wide spectrum of antigenic specificities which seemed to be due to admixture from non-tribal groups, while in the other three tribes the polymorphisms of various HLA loci showed restricted distributions. The gene frequency data, when converted to a kinship matrix and a two-dimensional eigenvector plot, indicated that members of the same linguistic family tend to have greater genetic affinity. INTRODUCTION Some of the major factors that influence human population structure are geographical distance, population movements, linguistic and cultural factors, demographic effects and random events. The customary rationale for using language to interpret gene frequency patterns is a simplifying assumption that common language frequently indicates a common origin. Cavalli-Sforza et al. (1988) have presented empirical evidence for the correspondence between biological and linguistic phylogenies on a worldwide basis. The populations that show the greatest linguistic diversity are the Indian groups of North and South America. In Colombia there are some 80 groups speaking about 60 well-defined languages (Patino, 1991). Recently, Black etal. (1994, cited in Callegari-Jacquesef al., 1994), examining the distribution of Class I HLA antigens in 1690South Amerindians, did not find any geographical or linguistic clusters. Studies of HLA antigens from Colombia are limited, and no multivariate analysis has been carried out to elucidate the genetic differentiation or affinity among different Indian groups belonging to the same or different linguistic families. In 1988, Javeriana Correspondence: Dr S.S. Papiha, Department of Human Genetics, 19/20 Claremont Place, Newcastle Upon Tyne NE2 4AA. U.K. 0 1996 Blackwell Science Ltd 21 I . Briceno et al. 22 I I I I 2W 400 600 4 800h FIG.1. Map of Colombia showing sample collection sites. University, Bogota, launched a 5-year programme, ‘Expedicion Humana’, 3 collect essential biomedical data from different Amerindian groups. Several groups were examined for the HLA-A, B, C, D R and DQ loci. This paper examines genetic variation and affinities derived from HLA data on five Amerindian groups (Fig. 1) belonging to two distinct linguistic families. Area, language and populations Of the five Indian groups studied, Cubeo, Tucano and Coreguaje are of Macro-Tucano linguistic stock, which is further divided into three linguistic families. The Cubeo belong to the Central Tucano family, while the Tucano and Coreguaje belong to the Oriental and Occidental Tucano families, respectively. The other two Indian groups, Embera-Epena and Noanama (Waunana), speak the Noanama language. A brief demographic description of each Indian group is given below. Cubeo. The Cubeo Indians number nearly 4OOO individuals living near the banks of the rivers Vaupes, Quduyari and Querari in the tropical rain forest of South-east Colombia. The Cubeo are mainly endogamous, but intertribal marriages with neighbouring groups also occur. Tucano. The Tucano Indians also inhabit the Vaupes region and are greater in number than the Cubeo (population >6000). Their dialect is widespread along the Vaupes river. Like many other 0 I996 Blackwell Science Ltd, European Journal of Immunogenelics 23.21-28 HLA antigens in Amerindians 23 groups of this area, the Tucano are relatively exogamous. For both the Cubeo and Tucano Indians, samples for HLA typing were obtained from Mandi and San Javier, near the banks of the Quduyari river. Coreguaje. The Coreguaje are 1400 in number and distributed in 14 settlements along the rivers Orteguaza, Peneya and Caqueta. For the purpose of this investigation, samples were collected from the Coreguaje living near the Orteguaza river. Embera-Epena. The Embera-Epena Indians are part of the wider Embera family that also includes the Chami and Catio tribes. The Embera-Epena, numbering nearly 1500 individuals, speak Epena-Pedee, a language related to Noanama. For the purpose of this study the Embera-Epena living in Guangui, a small settlement on the Saija river, were investigated. Noanama (Waunana). The population size of this group is 2000 in Colombia, although additional members of the group live in Panama. Both of these Noanama-speaking tribes live in an area near the Pacific coast of the south-west of Colombia (Fig. 1). MATERIAL AND METHODS On two different field trips, blood samples were collected from Mandi, San Javier, Guangui and settlements along the rivers Orteguaza and San Juan (Fig. 1). Collection involved random sampling of both males and females from different villages, except for the Embera sample which was mainly collected in Guangui. The Embera samples cannot be regarded as a collection from a single village because Embera from neighbouring villages travelled to our camp for medical help. Most individuals included in this survey were apparently healthy, although some with minor medical complaints were also included. 307 individuals (Cubeo = 39, Tucano = 129, Coreguaje = 70, Noanama = 37 and Embera = 32) were tested for the number of specificitiesgiven below. Due to field conditions and the non-availability of antisera, uniform analysis of all samples of the different groups was not possible. Although all population groups were tested with broad specificities such as A9, A10, A19, B5, B16, B17 and B40, in the present study the split specificitieswere used in gene frequency (g.f.)calculations wherever the split antisera were used. The samples were processed and HLA-typed locally using commercially available antisera (Boehringwerke A.G.). Details of the typing have been described previously (Bernal el al., 1988). In all, 14 specificities were examined at the HLA-A locus (21 for Coreguaje and Tucano), 23 at the B locus (44 for Coreguaje and Tucano), four at the C locus (10 for Coreguaje and Tucano) and nine in the D region (eight at the DR locus and one at the DQ locus). In all, 77 antisera were used to type the HLA region. All specimens could not be analysed uniformly due to difficulties in obtaining sufficient antisera and some further technical problems. Gene frequencies and Hardy-Weinberg equilibrium were calculated using a computer program based on the method described by Nam & Grat (1976). Genetic affinity and differentiation among populations were computed by the method of Harpending & Jenkins (1973), while the two-dimensional plot was constructed with the first two eigenvectors using principal component analysis. RESULTS A N D DISCUSSION The observed antigen numbers and gene frequencies of the HLA-A, B, C, DR and DQ loci in the five Amerindian groups are given in Table 1. Significant deviations from Hardy-Weinberg 0 1996 Blackwell Science Ltd, European Journal of Immunogmetics 23,21-28 N 6 93 3 9 f 2' fi CD ; 'D 5- 8 @ B44 B45 B51 Blocus B7 B8 B14 B13 B18 B27 B35 B37 B38 B39 B41 B42 A1 A2 A3 A1 1 A23 A24 A25 A26 A28 A29 A30 ~ 3 1 Blank A locus Specificity 0 10 0 NT NT NT 0 0 6 NT 0 1 4 0 6 2 10 0 0 29 0 1 3 10 6 4 4 1 Antigen GF O.oo00 O.oo00 O.oo00 O.oo00 0.1394 O.oo00 0.0131 0.0533 O.oo00 0.081 1 O.oo00 O.oo00 0.081 1 0.0126 0.4827 O.oo00 0.0126 0.0384 0.1346 0.0784 0.0515 0.0515 O.oo00 0.0254 0.1346 -0.0223 (n= 39) cube0 44 1 3 0 7 4 4 14 1 2 6 0 0 0 1 1 109 0 4 8 32 7 7 7 3 12 22 5 Antieen GF 0.0030 0.01 14 O.oo00 0.0268 0.0152 0.0152 0.0545 0.0030 0.0076 0.0230 O.oo00 O.oo00 O.oo00 0.0032 0.1830 0.0033 0.5185 O.oo00 0.0134 0.0269 0.1136 0.0235 0.0235 0.0235 0.0100 0.0407 0.0763 0.1268 Tucano* (n = 129) 0 0 0 0 0 0 0 0 0 0 0 0 0 11 0 0 6 1 30 0 0 36 4 0 1 1 0 0 . . . . m m m m 0 . m 0 . m 0 . m 0 . m 0 . m 0 . m 0 . m 0 . m 0 . m 0 . m 0 . m 0 . m 0 . m 0 . m 0.0806 0.0784 0.0069 0.5833 0 0 0 0 0.0069 0.0069 0 . m 0 . m 0.2900 0.0276 Antigen GF Coreguaje' (n = 70) 4 1 0 NT 0 0 0 0 0 0 0 0 15 NT 0 1 6 1 9 7 1 0 19 0 NT 0 20 0 Antigen GF O.oo00 0.0136 0.0555 O.oo00 O.oo00 O.oo00 0.2285 O.oo00 O.oo00 O.oo00 O.oo00 O.oo00 O.oo00 O.oo00 0.3024 O.oo00 0.0128 0.0795 0.0128 0.1221 0.0934 0.0930 O.oo00 0.2840 O.oo00 Noanama (n= 37) 0 0 0 3 NT 0 NT 0 0 0 0 0 0 0 0 7 0 13 0 NT 0 4 0 0 10 0 1 7 Antigen Embera ( n = 32) TABLE1. Observed numbers and gene frequencies for the HLA-A locus in five Amerindian populations of Colombia ~ O.oo00 O.oo00 O.oo00 O.oo00 O.oo00 O.oo00 O.oo00 0.0598 O.oo00 O.oo00 O.oo00 O.oo00 O.oo00 O.oo00 0.0626 O.oo00 O.oo00 0.1655 O.oo00 0.0153 0.1125 0.4218 O.oo00 0.2223 O.oo00 GF E 2 30 B g. 9 !i2 10 5 7 8 NT 22 16 7 5 3 5 14 NT NT NT 11 10 NT 8 14 7 3 0 4 4 3 4 0.1305 0.1466 0.2881 0.1977 0.0806 0.0568 0.0928 0.0806 0.0568 0.2600 0. I850 0.1417 0.1277 0.1850 0.1006 0.0954 0.0533 O.oo00 0.0533 0.0533 0.0399 0.3368 20 3 17 9 NT 30 32 7 9 32 29 68 34 20 26 12 2 0 8 11 2 21 0 6 19 18 24 0.0808 0.1282 0.1374 0.0285 0.0367 0.5498 0.0121 0.0706 0.0367 0.1845 O.oo00 0.0452 0.0074 0.1009 0.0766 0.1345 0.0413 0.1134 0.2%2 0.0076 0.0822 O.oo00 0.0230 0.0747 0.0706 0.3960 NT NT NT NT NT NT NT NT NT NT 0 . m 0.7439 0.0071 1 0 . m 0 . m 0 . m 0.0964 0.0286 0.0507 0.0733 0.0579 0.1777 0.66% 0 . m 0 . m 0.0142 0 . m 0 41 0 0 0 13 10 4 7 0 2 0 0 9 26 34 7 9 7 5 14 15 2 2 9 1 NT NT NT NT 16 0 NT 4 7 12 0 8 0 0 6 3 8 0.0995 0.0228 0.0228 0. 1078 0.0113 0.1883 0.1743 0.0582 0.1078 0.3067 0.6653 0.0559 0.1OoO 0.1788 O.oo00 8 1 0 0 5 8 6 7 11 8 NT NT NT NT 18 1 11 NT 2 4 5 10 0.0413 0.4621 0.0845 2 6 0 2 3 O.oo00 0.1145 O.oo00 O.oo00 0.1340 O.oo00 O.oo00 0.0892 0.1472 0.1081 0.1274 0.2096 0.1472 0.1713 0.7058 0.0309 0.0629 0.1851 0.0153 0.0394 0.1238 O.oo00 0.0394 0.0598 0.1019 0.5759 'Tucano and Coreguaje were also tested with A32, A33, A34, A36, A66, A68, A69, B46, B47, B48, BSO, B52, B53, B54, B57, B59, B63, B67 and B70antisera, but no positive reaction was observed. DQ 1 DQ locus DRI DR2 DR3 DR4 DR7 DRI 1 DR52 DR53 Blank DR locus c locus CWI cw2 cw3 cw4 cw5 CW6 cw7 CW8 CWll Blank B55 B60 B62 B73 Bw4 Bw6 Blank 26 I. Briceno et al. equilibrium were observed in Coreguaje for the HLA-B and C loci, in Noanama for the HLA-C locus and in Tucano for the HLA-D locus. Considering the large number of loci and antigens tested, deviation in those loci may be a result of chance. However, there is a suggestion that selection due to heterosis in South American Indians has operated (Black & Salzano, 1981), producing fewer homozygote alleledhaplotypes, which may be responsible for the present deviation from the null hypothesis. For the HLA-A locus, both the Noanama-speaking tribes and the Coreguaje showed a very restricted distribution pattern of antigens compared to the Cubeo and Tucano. The most frequent specificity found in all five groups was A2, and its frequency ranged from 23 to 61%. Other frequent antigens found at the A locus were A24 (split of A9) and A31 (split of A19). The genetic variation in Tucano-speaking tribes was statistically significant for antigens A2, A24 and A25, while differences among Noanama speakers were significant for A24. In the Coreguaje tribe the A3 antigen, which is generally absent in American Indians (Salzano & Callegari-Jacques, 1988). was present. At the B locus, there was a predominance of the B35, B51 and B60 antigens, but of interest is the presence of B8 and B17 (broad specificity) in Cubeo and Tucano and B27 in Tucano; these are rarely seen in American Indians (Black, 1980a; Belich et al., 1992). The presence of these antigens may suggest admixture in Cubeo and Tucano. In the Coreguaje, the B locus antigens were restricted to only a few of the commonly observed specificities in Amerindians (B51, B60, BW4 and BW6) while in Noanama and Embera the additional specificities B35 and B45 were also observed. These specificities are typical of those found in north and central Amerindians (Cavalli-Sforza et al., 1994). At the C locus, all five groups were consistently tested for Cw2, Cw3, Cw4 and Cw5 antigens. Specificity Cw3 was the most common in all five tribes (range 6-30%). Cw4 was found in four tribes and showed a narrow range of gene frequency (13-19y0). The Cw6 frequencies in Cubeo andTucano were significantly different (P<O.OOl). DR and DQ typing could not be performed in the Coreguaje, but all specificities tested were found in all four tribes and DR7 and D R l l were the most common. The Embera tribe showed the highest frequency for DR4 (ISYO), DR52 (21%), and DR53 (14%) specificities. DQ1 was present in all the four tribes tested, with frequencies ranging between 8 and 13%. For all the MHC loci and for several specificities tested, the variation among the five tribes was enormous. For analysis of genetic affinity among these five tribes belonging to two different linguistic families, locus-by-locus comparison of gene frequencies not only proved to be difficult, but could also be misleading. The gene frequency data consistently analysed in five groups were converted to a single value, giving the kinship between the different groups. The kinship matrix (R) was computed using the method of Harpending & Jenkins (1973). The R matrix is based on the mean standard deviation of gene frequencies in each group from the total mean, and on the average covariance of the gene frequencies in a pair of subgroups relative to the mean. The R matrix based on the HLA data of the five Amerindian groups is given in Table 2. The highest positive value of 0.027 was found between the Cubeo and Tucano, suggesting an above-average affinity between these two groups. The R estimate between the Noanama speakers was also found to be positive (0.012). However, the Coreguaje showed low positive values with Noanama speakers, but high negative values with members of its own linguistic family, Cubeo and Tucano. The Coreguaje tribe therefore shows below-average relationship and is genetically distinct from the other four groups. This multidimensional R matrix was reduced to a two-dimensional eigenvector plot (Fig. 2). This shows a relatively close relationship between the Noanama-speaking tribes and between the Cubeo and Tucano, but the Coreguaje, who speak oriental and occidental Tucano, as expected are genetically distinct and are separated from the other groups in the lower part of the plot. The diagonal element of the R matrix indicates the 0 1996 Blackwell Science Lld. European Journal of Immunogenelics 23.21-28 27 HLA antigens in Amerindians TABLE 2. R Matrix for five Amerindian groups Population Cubeo Cubeo 0.0159 Tucano 0.0268 Tucano Coreguaje Noanama Embera 0.0554 Coreguaje -0.0186 -0.0433 Noanama -0.0104 -0.0238 0.0064 0.0122 Embera -0.021 1 -0.0410 0.0046 0.0232 0.0185 0.0232 Mean diagonal element = Rs.1. = 0.0246. O€MBERA WOANAMA OTUCANO ,CUBE0 eigenvectorl +3 -3 0 COREGUAJE eigenvector2 FIG.2. Eigenvector plot of the R matrix for the five Colombian Amerindian tribes degree of isolation characteristic of a particular subgroup. The highest diagonal value is for the Tucano (0.055) and lowest for the Noanama (0.012). The mean diagonal element (RsT) provides an index of genetic differentiation among populations. The Rsr value is 0.025, which shows a moderately high level of genetic differentiation among these groups. In summary, the genetic diversity at the HLA loci in the Amerindian groups studied is vast. One possible reason for this diversity is admixture in some groups, which tends to provide a wide spectrum of antigenic specificities, as observed in the Cubeo and Tucano, in both of which there seems to be admixture from non-Indian groups. Unlike the findings of Black et al. (1994, cited in Callegari-Jacques et al. 1994), our results suggest that members of the same linguistic family tend 0 1996 Blackwell Science Ltd. European Journal of lmmunogenerics 23,2 1-28 I. Briceno et al. 28 to share greater affinity, while other groups, such as the Coreguaje, who speak a slightly different version of the Tucano language and are geographically distant from other members of the same linguistic group, still retain the restricted HLA distribution pattern seen in most of the Indian groups. ACKNOWLEDGMENTS Thanks are due to the Instituto Colombiano de Cultura Hispanica, Colciencias and to the Academic de Ciencias Exactas, Fiscias Y Naturates de Madrid for their financial support and to the Hospital and authorities of Mitu and the Sisters of Mama Bwe in the Orteguaza River for their help. We are grateful to Dr D.J. Pritchard for his critical perusal of the manuscript. REFERENCES BELICH, M.P., MADRIGAL, J.A., HILDEBRAND, W.H., ZEMMOUR, J., WILLIAMS, C., Luz, R., PETZI-ERLER, P. (1992) Unusual HLA-B alleles in two tribes of Brazilian Indians. Nature, 357,326. M.L. & PARHAM, BERNAL, J.E., DURAN, C. & PAPIHA, S.S. (1988) HLA antigens in the Huitoto indians and an urban population of Colombia. Human Heredity, 38,337. BLACK, F.L. & SALZANO, F.M. (1981) Evidence for heterosis in the HLA system. American Journal of Human Genetics, 33, 894. BLACK, F.L.. LEE,L.B. & GABBAY, Y.(1980) HLA antigens in South American Indians. Tissue Antigens, 16,368. CALLEGARI-JACOUES, S.M.,SELZANO, K.M., WEIMER, T.A., HULL H.H., BLACK,F.L., SANTO,S.E.B., GLIERREIRO, J.F., MESTINER,M.A. & PANDEY, J.P. (1994) Further blood group studieson Amazonian diversity - data from four Indian groups. Annals of Human Biology, 21,465. CAVALLI-SFORZA, L.L., PIAZZA,A., MENOUI,P. & MONTAIN.J. (1988) Reconstruction of human evolution: Bringing together genetic, archaeological and linguistic data. Proceedings of the National Academy of Science USA, 85,6002. CAVALLI-SFORZA, L.L., MENOZZI, P. & PIAZZA, A. (1994) The History and Geography of Human Genes. Princeton University Press, Princeton, NJ, USA. HARPENDING, H.C. & JENKINS, T. (1973) Genetic distances among Southern African populations. In Methods and theories of Anthropological Genetics (ed. by M.H. Crawford & P.L. Workman), p. 177. University of New Mexico Press, Albuquerque. NAM,J.M. & GRAT,J.J. (1976) Bernsteins and gene counting methods in generalised ABO-link systems. Annals of Human Genetics, 39, 361. PATINO, C. (1991) Espanol, lenguas indigenmy lenguas criollas en Colombia. lnstituto Caro y Cuervo, Santa F6 de Bogota. SALZANO, F.M. & CALLEGARY-JACOUES, S.M. (1988) South American Indians. A Case Study in Evolution. Clarendon Press, Oxford. 0 1996 Blackwell Science Ltd. European Journal of Immunogenetics 23.2 1-28
