solucion primera pratica calificada
Anuncio
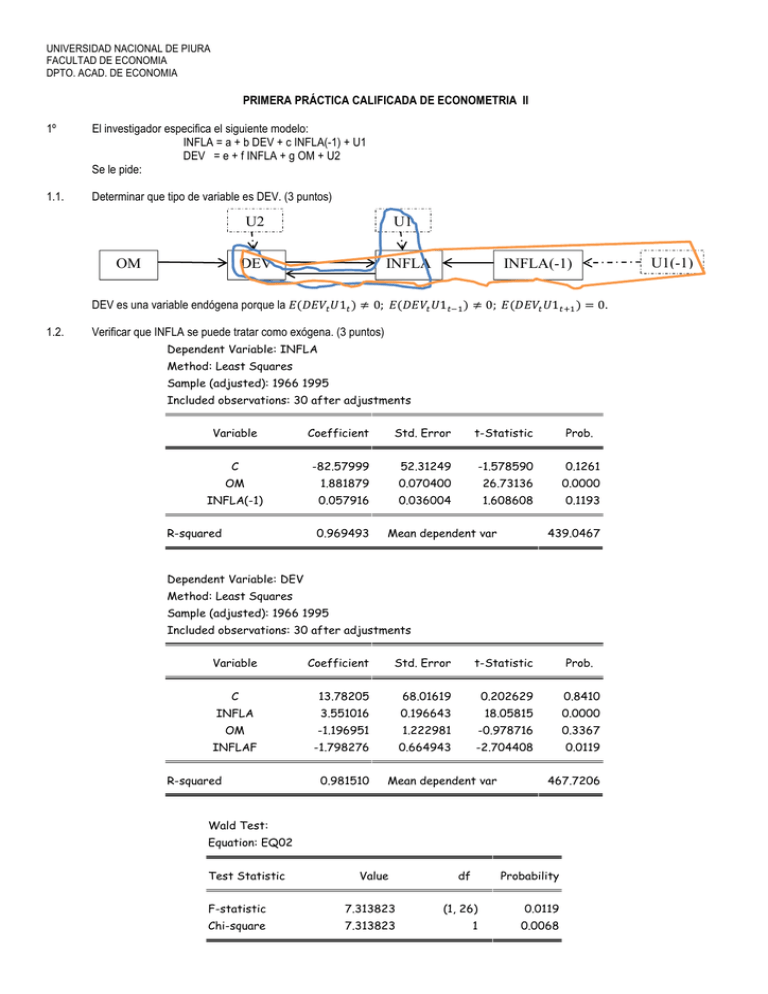
UNIVERSIDAD NACIONAL DE PIURA FACULTAD DE ECONOMIA DPTO. ACAD. DE ECONOMIA PRIMERA PRÁCTICA CALIFICADA DE ECONOMETRIA II 1º El investigador especifica el siguiente modelo: INFLA = a + b DEV + c INFLA(-1) + U1 DEV = e + f INFLA + g OM + U2 Se le pide: 1.1. Determinar que tipo de variable es DEV. (3 puntos) U2 OM U1 DEV INFLA INFLA(-1) DEV es una variable endógena porque la 1 ≠ 0; 1 ≠ 0; 1 = 0. 1.2. Verificar que INFLA se puede tratar como exógena. (3 puntos) Dependent Variable: INFLA Method: Least Squares Sample (adjusted): 1966 1995 Included observations: 30 after adjustments Variable Coefficient Std. Error t-Statistic Prob. C -82.57999 52.31249 -1.578590 0.1261 OM 1.881879 0.070400 26.73136 0.0000 INFLA(-1) 0.057916 0.036004 1.608608 0.1193 R-squared 0.969493 Mean dependent var 439.0467 Dependent Variable: DEV Method: Least Squares Sample (adjusted): 1966 1995 Included observations: 30 after adjustments Variable Coefficient Std. Error t-Statistic Prob. C 13.78205 68.01619 0.202629 0.8410 INFLA 3.551016 0.196643 18.05815 0.0000 OM -1.196951 1.222981 -0.978716 0.3367 INFLAF -1.798276 0.664943 -2.704408 0.0119 R-squared 0.981510 Mean dependent var 467.7206 Wald Test: Equation: EQ02 Test Statistic Value df Probability F-statistic 7.313823 (1, 26) 0.0119 Chi-square 7.313823 1 0.0068 U1(-1) 2 Por lo tanto, INFLA no se puede tratar como exógena (0.0119 < 0.05). 1.3. Determine si DEV precede a INFLA. (2 puntos) Pairwise Granger Causality Tests Sample: 1965 1995 Lags: 1 Null Hypothesis: DEV does not Granger Cause INFLA Obs F-Statistic Probability 30 37.2895 1.6E-06 29 96.3697 3.4E-12 28 254.866 1.1E-16 27 239.977 2.4E-15 26 259.265 5.3E-14 25 238.378 9.2E-12 24 113.790 4.7E-08 Lags: 2 DEV does not Granger Cause INFLA Lags: 3 DEV does not Granger Cause INFLA Lags: 4 DEV does not Granger Cause INFLA Lags: 5 DEV does not Granger Cause INFLA Lags: 6 DEV does not Granger Cause INFLA Lags: 7 DEV does not Granger Cause INFLA Por lo tanto, DEV precede a INFLA. 1.4. Estimar la inflación por mínimos cuadrados bietápicos y verifique si los residuos son ruido blanco. (5 puntos) Dependent Variable: INFLA Method: Two-Stage Least Squares Sample (adjusted): 1966 1995 Included observations: 30 after adjustments Instrument list: C INFLA(-1) OM Variable Coefficient Std. Error t-Statistic Prob. 34.69346 121.1971 0.286257 0.7769 DEV 0.895496 0.078979 11.33837 0.0000 INFLA(-1) -0.032987 0.088073 -0.374546 0.7109 C R-squared 0.830432 Mean dependent var 439.0467 3 Sample: 1966 1995 Included observations: 30 Autocorrelation ******| . . |**. | Partial Correlation ******| . | ****| . AC | | PAC Q-Stat Prob 1 -0.706 -0.706 16.478 0.000 2 18.799 0.000 0.260 -0.473 Breusch-Godfrey Serial Correlation LM Test: Obs*R-squared 19.04021 Probability 0.000013 Dependent Variable: RESID Method: Two-Stage Least Squares Variable Coefficient Std. Error t-Statistic Prob. C 0.164135 3.965196 0.041394 0.9673 DEV 0.096410 0.059906 1.609353 0.1196 INFLA(-1) 0.061732 0.081109 0.761095 0.4534 RESID(-1) -0.757757 0.182295 -4.156761 0.0003 R-squared 0.634674 Mean dependent var -4.74E-14 Breusch-Godfrey Serial Correlation LM Test: Obs*R-squared 25.41995 Probability 0.000003 Dependent Variable: RESID Method: Two-Stage Least Squares Variable Coefficient Std. Error t-Statistic C 0.262797 2.614112 0.100530 0.9207 DEV -0.099776 0.051623 -1.932780 0.0647 INFLA(-1) 0.357758 0.073319 4.879495 0.0001 RESID(-1) -1.916799 0.230260 -8.324508 0.0000 RESID(-2) -0.907620 0.153804 -5.901147 0.0000 R-squared 0.847332 Prob. Mean dependent var -4.74E-14 White Heteroskedasticity Test: F-statistic 18.29038 Probability 0.000000 Obs*R-squared 22.35953 Probability 0.000170 Dependent Variable: RESID^2 Method: Least Squares Sample: 1966 1995 Included observations: 30 4 Variable Coefficient Std. Error t-Statistic Prob. C -404686.6 159624.4 -2.535243 0.0179 DEV 1223.399 498.8658 2.452360 0.0215 DEV^2 -0.209424 0.044965 -4.657488 0.0001 INFLA(-1) 6877.288 1172.786 5.864059 0.0000 INFLA(-1)^2 -0.908351 0.155901 -5.826473 0.0000 R-squared 0.745318 Mean dependent var 353010.9 White Heteroskedasticity Test: F-statistic 128.9509 Probability 0.000000 Obs*R-squared 28.92337 Probability 0.000024 Dependent Variable: RESID^2 Method: Least Squares Sample: 1966 1995 Included observations: 30 Variable Coefficient Std. Error t-Statistic Prob. C -166608.2 64244.77 -2.593335 0.0159 DEV 5303.023 387.6539 13.67979 0.0000 DEV^2 -3.261528 0.252905 -12.89626 0.0000 DEV*INFLA(-1) 8.505432 0.703145 12.09628 0.0000 INFLA(-1) -917.8264 785.6013 -1.168311 0.2542 INFLA(-1)^2 0.025842 0.097632 0.264693 0.7935 R-squared 0.964112 Mean dependent var 353010.9 ARCH Test: F-statistic 5.864728 Probability 0.022439 Obs*R-squared 5.175066 Probability 0.022913 Dependent Variable: RESID^2 Method: Least Squares Sample (adjusted): 1967 1995 Included observations: 29 after adjustments Variable Coefficient Std. Error t-Statistic C 210907.4 236635.2 0.891277 0.3807 RESID^2(-1) 0.422434 0.174435 2.421720 0.0224 R-squared 0.178451 Mean dependent var Prob. 365161.7 5 ARCH Test: F-statistic 3.404235 Probability 0.049257 Obs*R-squared 5.993283 Probability 0.049955 Dependent Variable: RESID^2 Method: Least Squares Sample (adjusted): 1968 1995 Included observations: 28 after adjustments Variable Coefficient Std. Error t-Statistic C 265455.7 248505.6 1.068208 RESID^2(-1) 0.509999 0.195457 2.609260 0.0151 RESID^2(-2) -0.211910 0.195458 -1.084170 0.2886 R-squared 0.214046 Mean dependent var Prob. 0.2956 378181.6 25 Series: Residuals Sample 1966 1995 Observations 30 20 15 10 Mean Median Maximum Minimum Std. Dev. Skewness Kurtosis -4.74e-14 -25.18521 2586.527 -1678.946 604.3043 1.918302 14.27546 Jarque-Bera Probability 177.3195 0.000000 5 0 -2000 -1000 0 1000 2000 3000 Modh = modrho*sqr(modt/(1-modt*modvb3)) = -4.411001 2º Comente y fundamente su respuesta. (7 puntos) 2.1. En todo modelo multiecuacional se puede aplicar la prueba de causalidad y de exogeneidad. 2.2. La superexogeneidad requiere que exista precedencia.
