1 EJC 18: Correlograma, FAC y FAP El siguiente cuadro representa
Anuncio

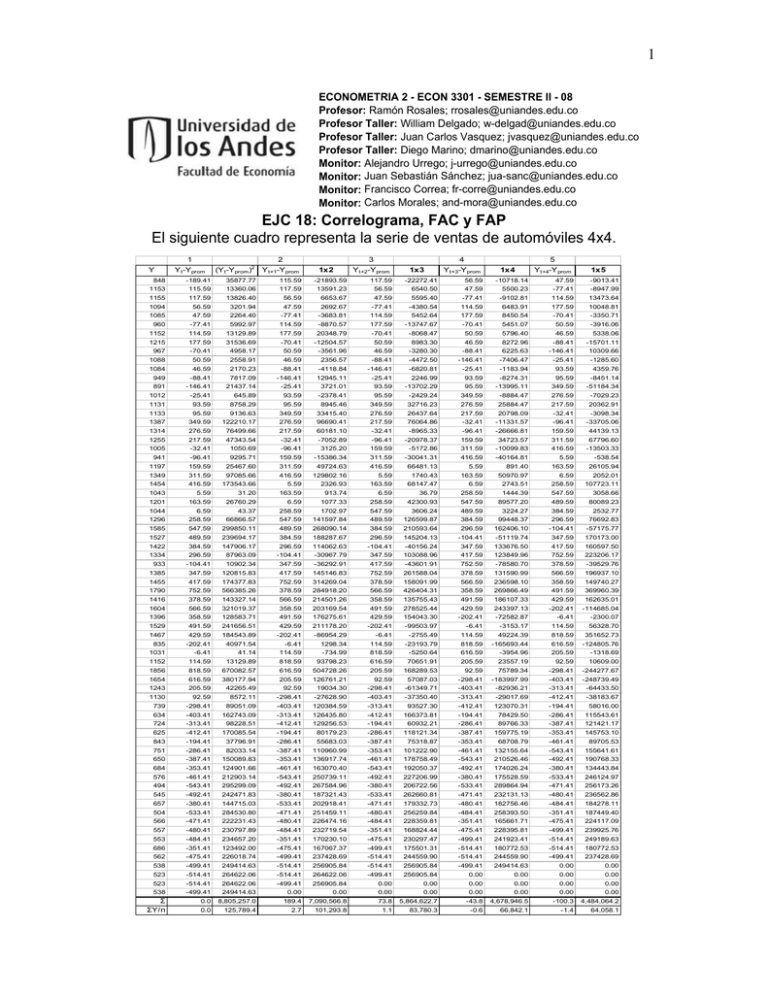
1 ECONOMETRIA 2 - ECON 3301 - SEMESTRE II - 08 Profesor: Ramón Rosales; rrosales@uniandes.edu.co Profesor Taller: William Delgado; w-delgad@uniandes.edu.co Profesor Taller: Juan Carlos Vasquez; jvasquez@uniandes.edu.co Profesor Taller: Diego Marino; dmarino@uniandes.edu.co Monitor: Alejandro Urrego; j-urrego@uniandes.edu.co Monitor: Juan Sebastián Sánchez; jua-sanc@uniandes.edu.co Monitor: Francisco Correa; fr-corre@uniandes.edu.co Monitor: Carlos Morales; and-mora@uniandes.edu.co EJC 18: Correlograma, FAC y FAP El siguiente cuadro representa la serie de ventas de automóviles 4x4. Y 848 1 Yt -Y prom -189.41 (Yt -Y prom )2 2 Y t+1-Yprom 1x2 35877.77 115.59 -21893.59 3 Y t+2-Y prom 117.59 -22272.41 56.59 1x4 -10718.14 5 Yt+4-Y prom 47.59 1x5 -9013.41 115.59 13360.06 117.59 13591.23 47.59 5500.23 -77.41 -8947.99 1155 117.59 13826.40 56.59 6653.67 47.59 5595.40 -77.41 -9102.81 114.59 13473.64 1094 56.59 3201.94 47.59 2692.67 -77.41 -4380.54 114.59 6483.91 177.59 10048.81 47.59 6540.50 4 Yt+3-Y prom 1153 1085 56.59 1x3 2264.40 -77.41 -3683.81 114.59 5452.64 177.59 8450.54 -70.41 -3350.71 960 -77.41 5992.97 114.59 -8870.57 177.59 -13747.67 -70.41 5451.07 50.59 -3916.06 1152 114.59 13129.89 177.59 20348.79 -70.41 -8068.47 50.59 5796.40 46.59 5338.06 1215 177.59 31536.69 -70.41 -12504.57 50.59 8983.30 46.59 8272.96 -88.41 -15701.11 50.59 -3561.96 967 -70.41 4958.17 -3280.30 -88.41 6225.63 -146.41 10309.66 1088 50.59 2558.91 46.59 2356.57 -88.41 -4472.50 -146.41 -7406.47 -25.41 -1285.60 1084 46.59 2170.23 -88.41 -4118.84 -146.41 46.59 -6820.81 -25.41 -1183.94 93.59 4359.76 949 -88.41 7817.09 -146.41 12945.11 -25.41 2246.99 93.59 -8274.31 95.59 -8451.14 -51184.34 891 -146.41 21437.14 -25.41 3721.01 93.59 -13702.29 95.59 -13995.11 349.59 1012 -25.41 645.89 93.59 -2378.41 95.59 -2429.24 349.59 -8884.47 276.59 -7029.23 1131 93.59 8758.29 95.59 8945.46 349.59 32716.23 276.59 25884.47 217.59 20362.91 1133 95.59 9136.63 349.59 33415.40 276.59 26437.64 217.59 20798.09 -32.41 -3098.34 1387 349.59 122210.17 276.59 96690.41 217.59 76064.86 -32.41 -11331.57 -96.41 -33705.06 1314 276.59 76499.66 217.59 60181.10 -32.41 -8965.33 -96.41 -26666.81 159.59 1255 217.59 47343.54 -32.41 -7052.89 -96.41 -20978.37 159.59 34723.57 311.59 67796.60 1005 -32.41 1050.69 -96.41 3125.20 159.59 -5172.86 311.59 -10099.83 416.59 -13503.33 941 -96.41 9295.71 159.59 -15386.34 311.59 -30041.31 416.59 -40164.81 5.59 -538.54 1197 159.59 25467.60 311.59 49724.63 416.59 66481.13 5.59 891.40 163.59 26105.94 1349 311.59 97085.66 416.59 129802.16 5.59 1740.43 163.59 50970.97 6.59 2052.01 1454 416.59 173543.66 5.59 2326.93 163.59 68147.47 6.59 2743.51 258.59 107723.11 1043 5.59 31.20 163.59 913.74 6.59 36.79 258.59 1444.39 547.59 3058.66 1201 163.59 26760.29 6.59 1077.33 258.59 42300.93 547.59 89577.20 489.59 80089.23 1044 6.59 1296 258.59 66866.57 547.59 141597.84 489.59 126599.87 384.59 99448.37 296.59 76692.83 1585 547.59 299850.11 489.59 268090.14 384.59 210593.64 296.59 162406.10 -104.41 -57175.77 1527 489.59 239694.17 384.59 188287.67 296.59 145204.13 -104.41 -51119.74 347.59 170173.00 1422 384.59 147906.17 296.59 114062.63 -104.41 -40156.24 347.59 133676.50 417.59 160597.50 87963.09 -104.41 1334 296.59 43.37 258.59 1702.97 -30967.79 547.59 347.59 3606.24 103088.96 489.59 417.59 3224.27 123849.96 384.59 44139.13 752.59 2532.77 223206.17 933 -104.41 10902.34 347.59 -36292.91 417.59 -43601.91 752.59 -78580.70 378.59 -39529.76 1385 347.59 120815.83 417.59 145146.83 752.59 261588.04 378.59 131590.99 566.59 196937.10 1455 417.59 174377.83 752.59 314269.04 378.59 158091.99 566.59 236598.10 358.59 149740.27 1790 752.59 566385.26 378.59 284918.20 566.59 426404.31 358.59 269866.49 491.59 1416 378.59 143327.14 566.59 214501.26 358.59 135755.43 491.59 186107.33 429.59 162635.01 1604 566.59 321019.37 358.59 203169.54 491.59 278525.44 429.59 243397.13 -202.41 -114685.04 1396 358.59 128583.71 491.59 176275.61 429.59 154043.30 -202.41 -72582.87 -6.41 -2300.07 1529 491.59 241656.51 429.59 211178.20 -202.41 -99503.97 -6.41 -3153.17 114.59 56328.70 1467 369960.39 429.59 184543.89 -202.41 -86954.29 -6.41 -2755.49 114.59 49224.39 818.59 351652.73 835 -202.41 40971.54 -6.41 1298.34 114.59 -23193.79 818.59 -165693.44 616.59 -124805.76 1031 -6.41 41.14 114.59 -734.99 818.59 -5250.64 616.59 -3954.96 205.59 -1318.69 1152 114.59 13129.89 818.59 93798.23 616.59 70651.91 205.59 23557.19 92.59 10609.00 1856 818.59 670082.57 616.59 504728.26 205.59 168289.53 92.59 75789.34 -298.41 -244277.67 1654 616.59 380177.94 205.59 126761.21 92.59 57087.03 -298.41 -183997.99 -403.41 -248739.49 1243 205.59 42265.49 92.59 19034.30 -298.41 -61349.71 -403.41 -82936.21 -313.41 -64433.50 1130 92.59 8572.11 -298.41 -27628.90 -403.41 -37350.40 -313.41 -29017.69 -412.41 -38183.67 739 -298.41 89051.09 -403.41 120384.59 -313.41 93527.30 -412.41 123070.31 -194.41 58016.00 634 -403.41 162743.09 -313.41 126435.80 -412.41 166373.81 -194.41 78429.50 -286.41 115543.61 724 -313.41 98228.51 -412.41 129256.53 -194.41 60932.21 -286.41 89766.33 -387.41 121421.17 625 -412.41 170085.54 -194.41 80179.23 -286.41 118121.34 -387.41 159775.19 -353.41 145753.10 843 -194.41 37796.91 -286.41 55683.03 -387.41 75318.87 -353.41 68708.79 -461.41 751 -286.41 82033.14 -387.41 110960.99 -353.41 101222.90 -461.41 132155.64 -543.41 155641.61 650 -387.41 150089.83 -353.41 136917.74 -461.41 178758.49 -543.41 210526.46 -492.41 190768.33 684 -353.41 124901.66 -461.41 163070.40 -543.41 192050.37 -492.41 174026.24 -380.41 134443.84 576 -461.41 212903.14 -543.41 250739.11 -492.41 227206.99 -380.41 175528.59 -533.41 246124.97 494 -543.41 295299.09 -492.41 267584.96 -380.41 206722.56 -533.41 289864.94 -471.41 256173.26 545 -492.41 242471.83 -380.41 187321.43 -533.41 262660.81 -471.41 232131.13 -480.41 236562.86 657 -380.41 144715.03 -533.41 202918.41 -471.41 179332.73 -480.41 182756.46 -484.41 184278.11 504 -533.41 284530.80 -471.41 251459.11 -480.41 256259.84 -484.41 258393.50 -351.41 187449.40 566 -471.41 222231.43 -480.41 226474.16 -484.41 228359.81 -351.41 165661.71 -475.41 224117.09 557 -480.41 230797.89 -484.41 232719.54 -351.41 168824.44 -475.41 228395.81 -499.41 239925.76 553 -484.41 234657.20 -351.41 170230.10 -475.41 230297.47 -499.41 241923.41 -514.41 249189.63 686 -351.41 123492.00 -475.41 167067.37 -499.41 175501.31 -514.41 180772.53 -514.41 180772.53 562 -475.41 226018.74 -499.41 237428.69 -514.41 244559.90 -514.41 244559.90 -499.41 237428.69 538 -499.41 249414.63 -514.41 256905.84 -514.41 256905.84 -499.41 249414.63 0.00 0.00 523 -514.41 264622.06 -514.41 264622.06 -499.41 256905.84 0.00 0.00 0.00 0.00 523 -514.41 264622.06 -499.41 256905.84 0.00 0.00 0.00 0.00 0.00 0.00 538 -499.41 249414.63 0.00 0.00 0.00 0.00 0.00 0.00 0.00 0.00 Σ ΣY/n 0.0 8,805,257.0 189.4 7,090,566.8 73.8 5,864,622.7 -43.8 4,678,946.5 -100.3 4,484,064.2 0.0 125,789.4 2.7 101,293.8 1.1 83,780.3 -0.6 66,842.1 -1.4 64,058.1 89705.53 2 FAC: está representada por las autocorrelaciones simples: 70 ∑ (Y ρ t ,t +1 = − Y )(Yt +1 − Y ) t t =1 Cov(Yt , Yt +1 ) = Var (Yt ) n n ∑ (Y t =1 t − Y )2 n 70 ∑ (Y t t =1 ρ1, 2 = − Y )(Yt +1 − Y ) 70 n ∑ (Y t t =1 − Y )2 7090567 70 = =0.80527 8805257 70 70 FAP: representa la Autocorrelación parcial (FAP) ( φ ). Para la estimación de las funciones de autocorrelación parcial, se utilizan las autocorrelaciones simples estimadas anteriormente. Método de Yule-Walker φ11 = r1 = 0.80527 −1 −1 ⎡φ 21 ⎤ ⎡ 1 ⎢φ ⎥ = ⎢r ⎣ 22 ⎦ ⎣ 1 r1 ⎤ ⎡ r1 ⎤ ⎡ 1 0.805⎤ ⎡0.80500⎤ ⎡0.765⎤ = ⎢ = ⎥ ⎢ ⎥ 1 ⎦ ⎣r2 ⎦ ⎣0.805 1 ⎥⎦ ⎢⎣0.66604⎥⎦ ⎢⎣0.050⎥⎦ ⎡φ31 ⎤ ⎡ 1 ⎢φ ⎥ = ⎢ r ⎢ 32 ⎥ ⎢ 1 ⎢⎣φ33 ⎥⎦ ⎢⎣r2 r1 1 r1 r2 ⎤ r1 ⎥⎥ 1 ⎥⎦ ⎡φ 41 ⎤ ⎡ 1 ⎢φ ⎥ ⎢ r ⎢ 42 ⎥ = ⎢ 1 ⎢φ 43 ⎥ ⎢r2 ⎢ ⎥ ⎢ ⎣φ 44 ⎦ ⎣r3 r1 1 r2 r1 r1 r2 1 r1 −1 ⎡ r1 ⎤ ⎢r ⎥ = ⎢ 2⎥ ⎢⎣ r3 ⎥⎦ r3 ⎤ r2 ⎥⎥ r1 ⎥ ⎥ 1⎦ −1 −1 0.80527 0.66604⎤ ⎡0.80527⎤ ⎡ 0.76761 ⎤ ⎡ 1 ⎢0.80527 1 0.80527⎥⎥ ⎢⎢0.66604⎥⎥ = ⎢⎢ 0.09018 ⎥⎥ ⎢ ⎢⎣0.66604 0.80527 1 ⎥⎦ ⎢⎣0.53138⎥⎦ ⎢⎣− 0.05249⎥⎦ 0.80527 0.666 0.531⎤ ⎡ r1 ⎤ ⎡ 1 ⎢r ⎥ ⎢0.805 1 0.805 0.666⎥⎥ ⎢ 2⎥=⎢ ⎢r3 ⎥ ⎢0.666 0.805 1 0.805⎥ ⎥ ⎢ ⎥ ⎢ 1 ⎦ ⎣r4 ⎦ ⎣0.531 0.666 0.805 −1 ⎡0.805⎤ ⎡ 0.7802 ⎤ ⎢0.666⎥ ⎢ 0.0686 ⎥ ⎢ ⎥=⎢ ⎥ ⎢0.531⎥ ⎢− 0.2359⎥ ⎢ ⎥ ⎢ ⎥ ⎣0.509⎦ ⎣ 0.2390 ⎦ 3 Método de Yule – Walter. Autocorrelación Parcial. FAP k 1.2 0 1 2 3 4 1 0.8 0.6 0.4 Phi 1.000 0.805 0.050 -0.052 0.239 0.2 0 -0.2 0 1 2 3 4 5 -0.4 Rezagos Método de Durbin K −1 φ KK = rK − ∑ φ K −1, J .rK − J J =1 K −1 1 − ∑ φ K −1, J .rJ , donde φ KJ = φ K −1, J − φ KK φ K −1, K − J J = 1,2,..., K − 1 J =1 Para φ11 = r1 − φ0,1r0 r1 − 0 = = r1 = 0.80527 1 − φ0,1r0 1 − 0 r2 − φ1,1r1 r2 − r12 0.666 − (0.8052) 2 φ 22 = = = =0.04976 1 − φ1,1r1 1 − r12 1 − (0.8052) 2 φ33 = r3 − (φ 2,1r1 + φ 2, 2 r1 ) 0.53138 − [(0.765035) (0.666) + 0.05 (0.8053)] = = - 0.0524 1 − (φ 2,1r1 + φ 2, 2 r2 ) 1 − [(0.765035) (0.8053) + 0.05 (0.666)] 4 Método de Durbin. Autocorrelación (FAC ó AC) CORRELOGRAMA DE Y Date: 10/29/08 Time: 19:07 5 Date: 10/29/08 Time: 19:10 Sample: 1 70 Included observations: 70 Autocorrelation Partial Correlation . |****** | . |***** | . |**** | . |**** | . |**** | . |**** | . |**** | . |**** | . |*** | . |*** | . |****** | .|. | .|. | . |** | . |** | .|. | .|. | .|. | .|. | .*| . | 1 2 3 4 5 6 7 8 9 10 AC PAC Q-Stat Prob 0.805 0.666 0.531 0.509 0.562 0.561 0.546 0.488 0.435 0.358 0.805 0.050 -0.052 0.239 0.282 -0.041 0.038 0.022 -0.020 -0.165 47.365 80.244 101.48 121.29 145.79 170.59 194.47 213.83 229.49 240.23 0.000 0.000 0.000 0.000 0.000 0.000 0.000 0.000 0.000 0.000 Método de regresión: Yt = φ11Yt − 1 Yt = φ 21Yt − 1 + φ 22Yt − 2 Yt = φ 31Yt − 1 + φ 32Yt − 2 + φ 33Yt − 3 . . . Yt = φk1Yt − 1 + φk 2Yt − 2 + φk 3Yt − 3 + ..... + φkkYt − k Estimadas estas regresiones y observando los resultados de las regresiones con cuatro rezagos, se ve que Yt − 2 y Yt − 3 , no son estadísticamente significativas; en tanto que Yt − 4 si lo es. Dependent Variable: Y Method: Least Squares Date: 10/29/08 Time: 19:14 Sample(adjusted): 2 70 Included observations: 69 after adjusting endpoints Variable Coefficient Std. Error t-Statistic Prob. C Y(-1) 174.2162 0.828930 78.32220 0.071048 2.224352 11.66714 0.0295 0.0000 R-squared Adjusted R-squared S.E. of regression Sum squared resid Log likelihood Durbin-Watson stat 0.670149 0.665226 207.7748 2892414. -465.1074 2.053027 Mean dependent var S.D. dependent var Akaike info criterion Schwarz criterion F-statistic Prob(F-statistic) 1040.159 359.1014 13.53934 13.60410 136.1222 0.000000 6 Dependent Variable: Y Method: Least Squares Date: 10/29/08 Time: 19:15 Sample(adjusted): 3 70 Included observations: 68 after adjusting endpoints Variable Coefficient Std. Error t-Statistic Prob. C Y(-1) Y(-2) 151.0134 0.788768 0.058173 83.02756 0.122261 0.123999 1.818834 6.451487 0.469143 0.0735 0.0000 0.6405 R-squared Adjusted R-squared S.E. of regression Sum squared resid Log likelihood Durbin-Watson stat 0.679607 0.669748 207.7478 2805346. -457.8238 2.002197 Mean dependent var S.D. dependent var Akaike info criterion Schwarz criterion F-statistic Prob(F-statistic) 1038.500 361.5047 13.55364 13.65156 68.93776 0.000000 Dependent Variable: Y Method: Least Squares Date: 10/29/08 Time: 19:16 Sample(adjusted): 4 70 Included observations: 67 after adjusting endpoints Variable Coefficient Std. Error t-Statistic Prob. C Y(-1) Y(-2) Y(-3) 159.0598 0.786672 0.095341 -0.043155 88.53735 0.125898 0.158877 0.126263 1.796527 6.248508 0.600088 -0.341785 0.0772 0.0000 0.5506 0.7337 R-squared Adjusted R-squared S.E. of regression Sum squared resid Log likelihood Durbin-Watson stat 0.679940 0.664699 210.7438 2798016. -451.4998 1.972182 Mean dependent var S.D. dependent var Akaike info criterion Schwarz criterion F-statistic Prob(F-statistic) 1036.761 363.9465 13.59701 13.72863 44.61272 0.000000 Dependent Variable: Y Method: Least Squares Date: 10/29/08 Time: 19:18 Sample(adjusted): 5 70 Included observations: 66 after adjusting endpoints Variable Coefficient Std. Error t-Statistic Prob. C Y(-1) Y(-2) Y(-3) Y(-4) 95.63003 0.800154 0.074517 -0.259693 0.283000 90.90083 0.122881 0.156188 0.155324 0.123403 1.052026 6.511627 0.477099 -1.671939 2.293302 0.2969 0.0000 0.6350 0.0997 0.0253 R-squared Adjusted R-squared S.E. of regression Sum squared resid Log likelihood Durbin-Watson stat 0.705476 0.686163 205.4102 2573794. -442.5008 2.182545 Mean dependent var S.D. dependent var Akaike info criterion Schwarz criterion F-statistic Prob(F-statistic) 1035.894 366.6656 13.56063 13.72651 36.52853 0.000000


