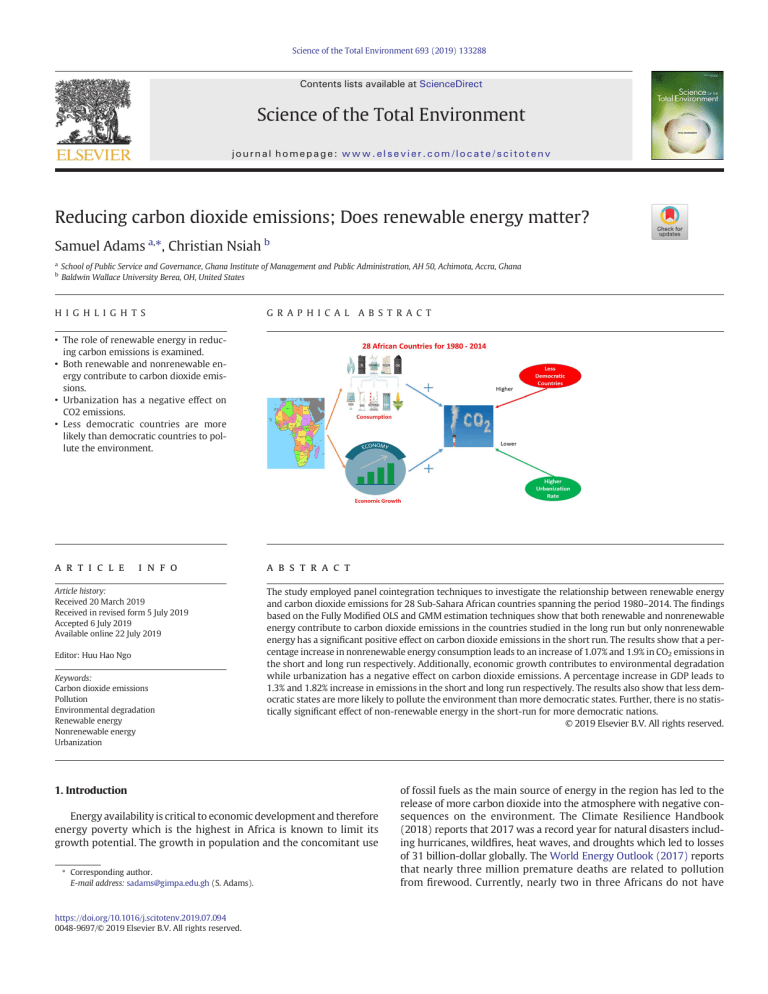
Science of the Total Environment 693 (2019) 133288 Contents lists available at ScienceDirect Science of the Total Environment journal homepage: www.elsevier.com/locate/scitotenv Reducing carbon dioxide emissions; Does renewable energy matter? Samuel Adams a,⁎, Christian Nsiah b a b School of Public Service and Governance, Ghana Institute of Management and Public Administration, AH 50, Achimota, Accra, Ghana Baldwin Wallace University Berea, OH, United States H I G H L I G H T S G R A P H I C A L A B S T R A C T • The role of renewable energy in reducing carbon emissions is examined. • Both renewable and nonrenewable energy contribute to carbon dioxide emissions. • Urbanization has a negative effect on CO2 emissions. • Less democratic countries are more likely than democratic countries to pollute the environment. a r t i c l e i n f o Article history: Received 20 March 2019 Received in revised form 5 July 2019 Accepted 6 July 2019 Available online 22 July 2019 Editor: Huu Hao Ngo Keywords: Carbon dioxide emissions Pollution Environmental degradation Renewable energy Nonrenewable energy Urbanization a b s t r a c t The study employed panel cointegration techniques to investigate the relationship between renewable energy and carbon dioxide emissions for 28 Sub-Sahara African countries spanning the period 1980–2014. The findings based on the Fully Modified OLS and GMM estimation techniques show that both renewable and nonrenewable energy contribute to carbon dioxide emissions in the countries studied in the long run but only nonrenewable energy has a significant positive effect on carbon dioxide emissions in the short run. The results show that a percentage increase in nonrenewable energy consumption leads to an increase of 1.07% and 1.9% in CO2 emissions in the short and long run respectively. Additionally, economic growth contributes to environmental degradation while urbanization has a negative effect on carbon dioxide emissions. A percentage increase in GDP leads to 1.3% and 1.82% increase in emissions in the short and long run respectively. The results also show that less democratic states are more likely to pollute the environment than more democratic states. Further, there is no statistically significant effect of non-renewable energy in the short-run for more democratic nations. © 2019 Elsevier B.V. All rights reserved. 1. Introduction Energy availability is critical to economic development and therefore energy poverty which is the highest in Africa is known to limit its growth potential. The growth in population and the concomitant use ⁎ Corresponding author. E-mail address: sadams@gimpa.edu.gh (S. Adams). https://doi.org/10.1016/j.scitotenv.2019.07.094 0048-9697/© 2019 Elsevier B.V. All rights reserved. of fossil fuels as the main source of energy in the region has led to the release of more carbon dioxide into the atmosphere with negative consequences on the environment. The Climate Resilience Handbook (2018) reports that 2017 was a record year for natural disasters including hurricanes, wildfires, heat waves, and droughts which led to losses of 31 billion-dollar globally. The World Energy Outlook (2017) reports that nearly three million premature deaths are related to pollution from firewood. Currently, nearly two in three Africans do not have 2 S. Adams, C. Nsiah / Science of the Total Environment 693 (2019) 133288 electricity (over 500 million people) and it is estimated that the region will need about US $ 12 billion to ensure universal access by 2025 (Africa Progress Panel [APP], 2015; African Development Bank, 2012). The situation is more serious for the African region because of poverty, and more importantly over half of the population depends on climate driven businesses such as smallholder farming, peasant mining, agriculture and hawking (Ngwenya et al., 2018; Frimpong et al., 2017; Fawcett et al., 2015). The abundance of renewable energy sources has led many international donor organizations and analysts to advocate for the use of renewable energy (RENE) which produces less carbon emissions. Indeed, the Sustainable Development Goals and especially SDG seven (7) advocated by the United Nations encourage the use of clean energy and the use of cleaner fossil fuel technology by 2030. The International Renewable Energy Agency [IRENA] (2017) and the Africa Progress Panel (2015, 2017) reports indicate that the use of renewable energy in Africa will help to limit global warming. Obviously, the abundance of renewable energy sources (especially wind and solar) makes it imperative (Wesseh and Lin, 2017). For example, the installed capacity of solar energy increased nearly 30, 000 times between 2000 and 2015, while the SSA region increased from 500 MW to 2100 for the period 2013–2015, with largest capacity being installed in South Africa (Surroop and Raghoo, 2018). In the past few years, the decline in the generation cost of renewable energy especially for Solar panels, which is the most abundant saw a reduction of N60% while the cost of generation of wind and battery cost also reduced over 25% which have all helped to boost interest in renewable energy (World Energy Outlook, 2017; Apergis et al., 2018; World Energy Outlook, 2013, 2015, 2017; Sarkodie and Adams, 2018; Pueyo, 2018). The problem, however, is that most of its RENE is untapped and the sector has been stifled by funding constraints (Pueyo et al., 2015) due mainly to shortages of capital, skills and governance deficits (Collier and Venables, 2012). Though renewables have increased over 60%, its relative share is only about 2%, which is an indication of Africa's vast potential for renewable energy production and therefore it is important to examine its benefits. Obviously, the great increase in renewable energy development use necessitates an investigation into its benefits to the environment to provide evidence informed policy to countries whose economies are driven by fossil fuels in the region. This gap motivates this study. The main objective of the study therefore is to explore the effect of renewable energy on carbon dioxide emissions and more importantly examine the differential effects, if any, between renewable energy (RENE) and nonrenewable (NRENE) on carbon dioxide emissions. To reduce the problem of omitted variable bias and to improve the consistency in our estimates, we control for two variables (urbanization and regime type or level of democracy). Urbanization is considered not only as a socioeconomic concept but also as a social process in SSA which has environmental consequences (Franco et al., 2017; Foresight Africa, 2017; Wang and Dong, 2019: Zoundi, 2017). Furthermore, climate change and energy use are politically determined (Surroop and Raghoo, 2018). The assumption is that different political institutional environments are likely to lead to different incentives for the implementation of environmental energy policies (Bernauer and Koubi, 2009; Sarkodie and Adams, 2018). Evidently, the focus on Africa is understandable because the sustainable development goals have a high chance of success if they succeed in Africa. Furthermore, Wesseh and Lin (2017) note that many of the SSA citizenry would not be able to pay for air conditioning or respond appropriately to flooding associated with global warming. Inglesi-Lotz and Dogan (2018) also explain that the traditional and agriculturally oriented focus of the SSA countries deepen their vulnerability to changing weather conditions. The paper is relevant to the environmental pollution literature in four ways. First, the differential effects of RENE and NRENE are examined. Second, the influence of the political system on the climate change is explored. Third, the facilitating role of urbanization in the energy – emissions linkage is investigated for SSA countries spanning the 1980–2014 period. Fourth, the panel cointegration techniques which control for heterogeneity and endogeneity are employed to improve the consistency of the estimates. The key assumption behind the importance of RENE is related to its low carbon content and therefore lower polluting capability. Accordingly, many analysts advocate for its use as an alternative to fossil fuels in reducing energy poverty (Elliot, 2007). The African Progress Panel (2017) notes that renewable energy could be described as the ‘golden thread’ to all the SDGs as it helps to connect growth, equity and environmental sustainability. Kivyiro and Arminen (2014) examine the drivers of environmental pollution for six SSA countries and find support for the argument that openness to trade promotes environmental pollution. Wang et al. (2018) studied the causes of carbon emissions for 170 countries and report that urbanization and energy consumption contribute to environmental pollution. A few other studies go beyond total energy to decompose into the renewable and nonrenewable energy shares to identify their differential effects. For example, InglesiLotz and Dogan (2018) employ panel estimation techniques on the energy–carbon dioxide relationship for the ten biggest electricity producers in SSA over the period 1980–2011 and report that while RENE reduces emissions, NRENE had the opposite effect. Similarly, Jebli et al. (2015) investigate the case for 24 SSA countries over a 31 year period (1980–2010) and demonstrate that RENE and trade have a positive effect on environmental quality. Sinha et al. (2017) investigate drivers of carbon dioxide emission sin N-11 countries over a fifteen year period (1990–2014) and find support for N-shaped EKC. Additionally, the results show that RENE and trade have positive effects on environmental quality but biomass, NRENE and urbanization have a negative effect. Likewise, Balsalobre-Lorente et al. (2018) show N-shaped EKC for his study on the five major European countries. The results show that renewable electricity consumption improves environmental quality, but economic growth had the opposite effect. Some studies, however, do not find significant impact of RENE on carbon dioxide emissions, while some studies do not find any difference between RENE and NRENE in terms of their effect on environmental quality. For example, Bilgili et al. (2016) show that both RENE and NRENE have adverse effect on carbon environmental degradation in the MENA region, while Jebli and Youssef (2017) demonstrate similar results for the North African countries, even though agricultural production contributed positively to environmental quality. Mert & Bölük (2016) find similar results for the EU region, however the authors note that NRENE contributed two times the amount of carbon emissions generated by RENE. On the other hand, Jebli and Youssef (2015) investigate the case of Tunisia during the period 1980–2009 and report that RENE does not have a significant impact on emissions but trade and NRENE do have detrimental effects on environmental quality. Pata (2018) demonstrated support for the EKC with structural breaks for Turkey over the period 1974–2014 and also found that urbanization had adverse effects on the environment but RENE did not have a significant impact. Some studies have investigated how the institutional or governance infrastructure affects the energy-carbon emissions link. For example, Sarkodie and Adams (2018) explore the impact of energy consumption on carbon emissions in South Africa for the period 1971–2017 and find that while fossil fuel increases carbon dioxide emissions, RENE and political institutional variables had a contrary effect. Bhattacharya et al. (2017) also report that both RENE and political institutional quality (measured as economic freedom) have positive effect on environmental quality. The results based on FMOLS and the GMM techniques show that institutions facilitate the speed of adoption of technologies for RENE. Employing the FMOLS estimation technique, Al-Mulali and Ozturk (2015) show that political stability lessens pollution of the environment for MENA countries. These studies are supportive of the importance of political dynamics in explaining the carbon dioxide emissions and environmental policy more broadly. Accordingly, the study seeks to examine how renewable energy affects CO2 after controlling for the S. Adams, C. Nsiah / Science of the Total Environment 693 (2019) 133288 institutional environment and urbanization to improve the consistency in the estimates. The methodology and data used to achieve the research objectives are discussed next. 2. Estimation models and data 2.1. Models To thoroughly analyze the impact of renewable energy on CO2 emisions, we first employ Fisher-type Unit-root test to check for the stationarity of the time series data. After ensuring that our data are stationary, we use panel cointegration techniques to test for the presence of a long-run relationship between the pollution and the explanatory variables. Further, we employ panel causality tests to cover all angles and ensure the use of the best fit estimation models to analyze the direction of causality between our variables of interest and pollution. 2.2. Unit-root tests Stationarity of the data was investigated using Stata's suite of unitroot tests. The suite of tests allows one to employ a variety of unit root tests for panel data where we specifically estimate model with the Fisher-type options Dickey-Fuller (dfuller) tests, which require the estimation algorithm on each panel to be performed by the ADF unit-root tests. The model employed is panel estimator with a first-order autoregressive component of the type presented in Eq. (1). ΔY it ¼ ∅i Y i;t−1 þ z0it Y i þ εit ð1Þ where i denotes country and t denotes time; yit is variable being tested for stationarity, and εit is stationary error term. Depending on options selected by the analysis, the Zit can represent four possibilities including panel specific mans with a time trend, only panel-specific means, or nothing at all. To ensure cross sectional independence, we use Levin et al.'s (2002) methodology in demeaning our series by subtracting the cross-sectional averages from our data series. For this estimation, our null hypothesis is Ho: ρi = 1 for all i cross sections versus the alternative Ha: ρi b 1. Note that depending on the type of test, our alternate hypothesis may be true for a country, some of the countries, or all of the countries represented in our dataset. The alternate hypothesis for the Fisher-type test we employ is that the data for at least one country in our panel is stationary. Note that the Fisher-type test we employ provides four unit-root testes analogous to those from Choi (2002) including the tests that uses the inversenormal, inverse-logit, modified χ2 or inverse χ2 transformations of the associated p-values. We test for stationarity at levels and also in first difference noting that the modified inverse chi-square transformation is appropriate only when the number of periods approaches infinity. 2.3. Cointegration test Regressing two non-stationary variables can result in a spurious outcome, however, if the two variables are proven to be cointegrated, then spurious regression is no longer an issue. In spite of the fact that we checked for stationarity of our variables, we want to ensure that our variables do have a stable long-run relationship before performing any other analysis. As such we employ STATA's xtcointtest estimation algorithm to test for cointegration. This STATA function allows us to specify three different cointegration tests including the Kao, Pedroni & Westerlund cointegration tests. All three criteria are derived from the panel estimation model presented in Eq. (2) where it is assumed that yit is stationary after first differencing (I(1)). yit ¼ x0it βi þ z0it γi þ εit ð2Þ whereas Xit denotes all the covariates, βi is the cointegration factor. Therefore, we assume that for all our countries in our panels, all the 3 variables represented by Xit are I(1) series. The model requires that for panel i, each of our covariates are I(1) series. Further, γi represents a vector of coefficients for our deterministic terms (zit,) which limits linear time trends and panel-specific effects. Finally, εit presents our error term. We will tests several scenarios including running separate tests to analyze separately, the link between NRENE and RENE consumption and pollution on one hand, while modeling with and without the proxy for governance, on the other hand. 2.4. Causality test We take another step in building a holistic picture of the link between energy usage and other covariates on one hand, and pollution on the other by checking for the direction of causality. We deploy the panel vector autoregression (PVAR) approach as introduced by Abrigo and Love (2016) with its accompanying PVARGRANGER test. The PVAR tests through a multivariate panel regression fits homogeneous panel vector autoregression (VAR) models of our dependent variable on its own lags and that of all other dependent variables via the GMM approach. Also, PVAGRANGER routine performs pairwise Granger causality tests after PVAR. 2.5. Long and short-run elasticities After establishing stationarity of our data and the long run relationship between our covariates and Carbon dioxide emissions which we are using as our proxy for pollution, we turn our attention to estimating both the short and long-run elasticities of our covariates. In this case, we deploy the fully modified ordinary least squares (FMOLS) estimation in a panel framework. Here we specify a dynamic panel autoregressive distributive lag (ARDL) model presented in Eq. (3) below: Sit ¼ p X γ ij Si;t− j þ j¼1 q X δ0ij xi;t− j þ μ i þ εit ð3Þ j¼0 where Sit denotes the level of emissions for a particular country i at time t respectively. Further, Xit denotes a K x 1vector of our explanatory variables employed. Also, the γij ′ s are scalars, whereas δit is a K x 1 vector of coefficients. It is assumed in Eq. (3) that if the variables are I(1) and cointegrated, then the error term is expected to be I(0) process for the various panels. Essentially, cointegrated variables tend to return to the long-run steady state after a shock, thus, suggesting the appropriateness of the use of an error-correcting model which allows short-run changes in our variables of interest to readjust to its long-run steady state. This feature of error correction, provides us with the ability to rewrite Eq. (3) in an error correction format as presented in Eq. (4), where ∅iis the adjustment term of the error-correction speed: q−1 X X p−1 γ it ΔY i;t−1 þ δ0ij ΔX i;t− j þ μ i þ εit ΔSit ¼ ∅i Si;t−1 θ0i X it þ j¼1 ð4Þ j¼0 ∅i can take on three main forms. For example, ∅i=0 denotes cases of no statistically significant long-run relationship between the variables of interest. On other hand, if assumption of error-correction holds, then we expect a significantly negative parameter ∅i. The vector θ′i presents the long-run relationships (elasticities) between CO2 emissions and our explanatory variable (relative price difference).1 The Panel Fully Modified Ordinary Last Squares (PFMOLS) has two main advantages. First, it is a more dynamic estimation technique unlike the fixed effects models. Second, there is no need for pretesting for stationarity because of the underlying ARDL structure. Additionally, the ARDL framework always yields consistent estimates because it does not matter whether the 1 q ∑ j¼0 δij ð1−∑k γik Þ p ∅ ¼ −ð1−∑ j¼1 γ it Þ; θi ¼ p q ; γij ¼ −∑m¼ jþ1 γim j ¼ 1…::P−1; and δij ¼ −∑m¼ jþ1 δim j ¼ 1……::q−1: 4 S. Adams, C. Nsiah / Science of the Total Environment 693 (2019) 133288 variables of interest are I (1) or I (0) process. It is noteworthy to mention that we suspect that there could be two – way causality between CO2 emissions and energy consumption. Thus, indicating the need to employ estimation models that can handle reverse causality. Another advantage of our model of choice is the fact that so far as the variables in consideration are I (1), reverse causality will not lead to inconsistent and biased estimates. This is mainly due to the act that the model exhibits a super consistent property. The panel fully modified Ordinary Least Squares (PFMOLS) model has three possibilities including the mean group (MG), pooled mean group (PMG), and dynamic fixed effects (DFE) estimators. In our case, we employ the PMG estimator. An advantage of the PMG estimator is that unlike other estimators that eliminate any potential long-run linkages between variables, it estimates dynamic heterogeneous panels due to its consideration of longrun equilibrium relationships. Further, this estimator does not force the restrictive assumption of homogeneous short-run parameters in its estimation of long-run parameters. Concisely, the PFMOLS is preferred over OLS due to its dual advantage of correcting for endogeneity issues, which are difficult or in some cases impossible to deal with when using OLS type estimators. Further, we chose this model over the dynamic OLS model since our focus is to estimate the long and short-run determinants of CO2 emissions to provide policy makers with both short and long-run possible solutions. In order to investigate whether democracy plays a role in how our explanatory variables affects CO2 emissions, in addition to the overall estimation, we separate our sample into high democracy and low democracy countries (using the mean of our democracy variable as the internal cut-off). Table 5 presents the results of this analysis. 2.6. Data The goal of this study is to analyze the effect of NRENE, RENE and regime type on environmental pollution as measured by the amount of Carbon dioxide emissions during 1990–2014 for 28 African countries. The real GDP (Y) and its squared term (Y2) are used to test for environmental Kuznets hypothesis. Other control variables include urban share as % of total population (UPOP), the number of persons engaged or employed (L). The regime type captures the political institutions or space that is represented by the level of democracy. There are many variables that have been used to measure democracy but the most popular are the civil liberties and political rights by Freedom House and the Polity 2 data obtained form the Polity IV database. Of the two, however, many more researchers suggest that the Polity 2 measure is more comprehensive and reliable and have therefore been employed the most (You et al., 2015; Munck and Verkuilen, 2002; Buitenzorgy and Mol, 2011; Kolcava et al., 2019). Accordingly, we use the polity data that represents the regime authority spectrum on a 21-point scale ranging from −10 (fully non-democratic) to +10 (fully democratic). Autocracy is an additive 11 point scale (−10–0) and the Democracy indicator is elevenpoint scale (0–10). There is no perfect autocracy or democracy and therefore can be said to be highly autocratic or democratic. The higher the negative value the higher the level of autocracy and the higher the positive value the higher the level of democracy. Thus, a value of −8 suggest a more autocratic than a value of −6, while a value of 8 is more democratic than a value of 6. Presented in Table 1 are the variable descriptions and their respective summary statistics. Tables 1A and 2A in the Appendix present data sources and also a list of countries represented in our sample. 3. Results and discussion 3.1. Unit root tests We conducted the Fisher–type unit-root test for the independent variables and all of our dependent variables. See Table 2. Choi (2002) recommends the use of normal Z statistic in applied projects because it presents the best trade-off between power and size. For our study, we find that all variables under consideration are stationary in levels and first difference regardless of the statistic used. These results present a strong case for the stationarity of variables and therefore providing compelling support for the sufficient condition of the weak form of PPP for the independent variables and our covariates. 3.2. Cointegration test results Results of cointegration are reported in Table 3 based on three different tests including the Kao, Pedroni, and Westerlund tests. It should be noted that the Kao test also has five different estimation algorithms including the Dickey Fuller, Modified Dickey Fuller, Unadjusted Dickey Fuller, Unadjusted Modified Dickey Fuller, and the Augmented Dickey Fuller tests. As shown by our results, the no cointegration null hypothesis can be rejected for all three major estimation algorithms and also for all five sub-Kao tests. The conclusion of rejecting the null hypotheses remains consistent even for models that both models with and without the proxy for governance. It can therefore be concluded that results exhibit robust support for a long-run linkage between the Carbon dioxide emissions and the covariates. 3.3. Panel granger causality test results We find evidence of a long-run relationship between our dependent variable and the covariates of choice (see Table 4). However, we did not determine the magnitude nor direction of the long-run relationship. To establish the direction of the relationship between our main covariates and our proxy for pollution, we employed the panel vector autoregression model (PVAR) along with its Granger causality option presented by Abrigo and Love (2016). From our overall sample, similar to Mohiuddin et al. (2016), we find that there exist unidirectional causality between nonrenewable energy consumption and emissions. This finding indicates that while energy consumption may directly impact emissions, it is nonrenewable energy consumption that directly worsens emissions. Interestingly, however we find a bidirectional causality between economic activity measured Table 1 Summary statistic. Variable Definition Co2kt RE NRE POPD UPOP Y K L Polityu CO2 emissions (kt) Renewable energy consumption in Quadrillion Btu (British thermal unit) Non-renewable energy consumption in Quadrillion Btu Population density (people per sq. km of land area) Urban population (% of total) Real GDP converted with Purchasing Power Parities (PPP) (constant prices mil. 2011 US$) Capital stock at current PPPs (in mil. 2011 US$) Number of persons engaged or employed (in millions) Regime type (Polity) (Polity is from −10 to 10 depending on the autocratic or democratic nature of the government we recoded to (Polity+11)/21)*100) Observations Mean 990 990 990 990 990 990 990 990 990 Std. dev. Min Max 21,280 70,949 33 503,112 0.02 0.03 0.00 0.16 0.11 0.26 0.00 1.54 82.73 119.19 1.49 618.66 31.74 15.54 4.34 86.37 51,753.80 119,757.80 151.36 919,085.50 92,898.29 216,315.30 106.64 2,020,231.00 6.43 8.37 0.07 53.73 43.33 27.40 4.76 100.00 S. Adams, C. Nsiah / Science of the Total Environment 693 (2019) 133288 5 Table 2 Unit-root test. Variable Description Levels First difference Inverse Inverse chi-squared normal Z (60) P Dependent variables LCo2kt Natural logarithm CO2 emissions (kt) PValue Independent variables LNRE Natural logarithm the non-renewable energy consumption in Quadrillion Btu PValue LRE Natural logarithm of renewable energy consumption in Quadrillion Btu (British thermal unit) PValue LL Natural logarithm of number of persons engaged or employed (in millions) PValue LY Natural logarithm real GDP converted with Purchasing Power Parities (PPP) (constant prices mil. 2011 US$) PValue −10.17 0.00 13.79 0.00 171.86 0.00 −7.88 0.00 −8.46 0.00 10.95 0.00 109.99 −4.03 −4.27 5.10 88.81 −2.78 −2.89 3.10 0.00 0.01 0.01 0.00 0.00 0.00 0.00 0.00 129.08 −4.23 −5.10 6.91 173.00 −7.40 −8.40 11.00 0.00 00 0.00 0.00 0.00 0.00 0.00 0.00 158.22 −5.70 −6.89 9.65 173.00 −7.40 −8.40 11.00 0.00 0 0.00 0.00 0.00 0.00 0.00 0.00 122.09 −4.83 −4.99 6.25 126.10 −5.00 −5.14 6.62 0.00 0.00 0.00 0.00 0.00 0.00 0.00 0.00 241.87 0.00 −0.31 0.38 −2.41 0.01 17.56 0.00 168.98 0.00 −6.17 0.00 −7.30 0.00 10.68 0.00 −11.58 −13.55 19.44 238.38 −11.13 −12.35 17.23 0.00 0.00 0.00 0.00 0.00 0.00 0.00 LGOV Natural logarithm Regime type (Polity). Polity is from −10 to 10 261.74 depending on the autocratic or democratic nature of the government we recoded to (Polity+11)/21)*100 0.00 by real GDP and emissions, which is consistent with the findings of Dritsaki & Dritsaki (2014). This finding confirms the complex relationship between emissions and growth where there is feedback relationship in the growth/emissions nexus in developing countries engaged in high growth activities, most likely due to the type of production processes at play. We also find unidirectional linkages from urban population and labor force size to emissions, a finding consistent with that of Babbar & Babbar (2018). Urban population and labor force growth are good proxies for general and firm level energy demand respectively, Table 3 Panel cointegration test. Kao Modified Dickey-Fuller t Dickey-Fuller t Augmented Dickey-Fuller t Unadjusted modified Dickey-Fuller t Unadjusted Dickey-Fuller t Pedroni Modified Phillips-Perron t Phillips-Perron t Westurlund Variance ratio Inverse Modified inv. chi-squared logit t (154) L* Pm −9.22 0.00 Natural logarithm Urban population (% of total) Model Inverse Inverse chi-squared normal Z (60) P 201.97 0.00 LUPOP PValue PValue Inverse Modified inv. chi-squared logit t (154) L* Pm Model 1 Model 2 Model 3 Model 4 RE & Co2kt NRE &Co2kt RE & Co2kt NRE & Co2kt −4.843 *** −5.116 *** −4.871 *** −5.134 *** −4.607 −2.934 ** −4.736 *** −3.045 *** −4.616 ** −2.951 *** −4.743 *** −3.058 *** *** and as such increases in these indicate increased demand for energy consumption for basic human needs and productivity. This increased need for energy consumption in developing countries may more than likely be fulfilled with increased consumption of nonrenewable energy sources which increase CO2 emissions. In the case of democracy, we do not find a direct causal relationship between democracy and CO2 emissions. In separating our sample into high and low democratic countries, however, we see only a one-way relationship from renewable energy usage to emissions in low-democracy nations. This indicates that some characteristics of countries with low governance structures, makes them more susceptible to the negative impact of the consumption of nonrenewable energy, perhaps due to the usage of much more environmentally unfriendly nonrenewable sources of energy. The bidirectional relationship between economic activity and emissions remains for both high and low-governance nations. We also find a unidirectional link between urban population and employment, on the one hand, to emissions on the other. These results indicate that our resource consumption variables may not be endogenous and therefore, we shouldn't be overly concerned with dealing with the issue of endogeneity when it comes to these variables. −10.325 *** −10.687 *** −10.342 *** −10.687 *** 3.4. Long and short-run elasticities −6.622 *** −6.736 *** −6.622 *** −6.733 *** 1.780 ** * *** 2.601 *** −7.005 −4.824 *** −8.828 *** −6.376 *** −8.658 *** −6.358 *** *** −2.189 ** 1.675 −2.265 3.059 *** −7.188 *** −4.678 ** −2.114 ** −2.241 ** Note: ***, **,* denotes PValues of b0.01, b0.05, and b 0.10 respectively. Models 1 and 2 include all explanatory variables except proxy for governance (polity2). Models 3, 4, include all explanatory variables. The emissions proxy in models 1 and 3 is renewable energy consumption, whereas for models 2 and 4 is non-renewable energy consumption. The dependent variable in each model is a proxy for Co2 emissions (the measuring units is Kiloton). There are 28 countries covering 35 periods. After checking for stationarity, cointegration, and direction of causality, our attention moves to quantifying the long and short-run impacts (elasticities) of our explanatory variables concerning emissions. In particular, our interest was on documenting the differential impacts of renewable and non-renewable energy usage by African countries on the various country's emissions in the long and short-run. We also investigate whether the political regime type of the countries under consideration affects energy consumption's effect. As such apart from estimating models which look at our overall sample for different energy consumption types (presented in models 1 and 2), we also split up our sample into high (above average governance index) and low governance countries (Models 3 to 6). The estimated ∅ parameters in Table 5 are allnegative and significantly signed indicating a cointegration relationship. 6 S. Adams, C. Nsiah / Science of the Total Environment 693 (2019) 133288 Table 4 Panel causality test. Direction of causality Overall Energy consumption & pollution Renewable energy consumption in Quadrillion Btu doesn't cause Co2kt Non-renewable energy consumption in Quadrillion Btu doesn't cause Co2kt Co2kt doesn't cause Renewable energy consumption in Quadrillion Btu Co2kt doesn't cause Non-renewable energy consumption in Quadrillion Btu Economic activity & pollution Real GDP doesn't cause Co2kt Co2kt doesn't cause Real GDP Governance & pollution Governance doesn't cause Co2kt Co2kt doesn't cause governance Population & pollution Urban population doesn't cause Co2kt Co2kt doesn't cause population density Labor force & pollution Employment doesn't cause Co2kt Co2kt doesn't cause employment Consistent with the finding of Shafiei and Salim (2014), Model 1 shows that nonrenewable energy consumption has significant and positive impact on CO2 emissions in both the short and long run. Particularly, we find that a percentage increase in nonrenewable energy consumption leads to an increase of 1.07% and 1.9% in CO2 emissions in the short and long run respectively. This finding suggests that consumption of nonrenewable energy which comes from sources including natural gas, coal and oil result in increase in CO2 emissions and thus contribute significantly to environmental degradation. The results from Model 1 show support for the EKC as the log of GDP and its squared term significantly affect CO2 emissions. We find that a percentage increase in GDP leads to 1.3 and 1.82 percentage increase in emissions in the short and long respectively, whereas the squared term yields −0.07% and −0.058% decline in emissions. This result therefore provides support for the Environmental Kuznets Curve similar to the findings of Kivyiro and Arminen (2014), but contrary to that of Shafieia & Salim (2014). Interestingly, the results show that urban population is negative and significantly related to carbon dioxide emissions in the long run, but the short run results show a positive and insignificant effect. This finding is not too surprising since Chen et al. (2018) find an inverted U-shaped curved relationship between urbanization and CO2 emissions in China. In our case, this finding may support the idea that initially urbanization increase the demand for energy usage, which is filled with nonrenewable energy sources, however as income of the urban population increases, other cleaner energy sources are demanded which lead to a reduction in greenhouse emissions. Additionally, while Model 1 and Model 2 yield very similar results, there are some fascinating, subtle differences between them. Specifically, while nonrenewable (NRENE) and renewable (RENE) have a significant positive impact on emissions in the long run, only NRENE has substantial effects in the short run. Even more interesting is the observation that RENE‘s impact on carbon dioxide emissions in the long run is higher compared to NRENE. This finding contradicts the outcome from some other studies that report otherwise, suggesting that RENE usage is associated with lower levels of carbon dio1ide emissions.2 However, our result aligns with Apergis et al.'s (2010) result that show a significant positive relationship between renewable energy and emissions. Accordingly, the authors report they could not find evidence for the emissions reducing role of RENE in the long run. These results are associated with inadequate storage technology and systematic power-outages, some of the people resort to emission generating renewable energy consumption such as the open burning of firewood. 2 See (Jebli and Youssef, 2017; Zoundi, 2017; Dogan and Seker, 2016a; Dogan and Seker, 2016b; Jebli et al., 2016; and Shafiei and Salim, 2014). High governance Prob N chi2 chi2 chi2 Prob N chi2 Low governance chi2 Prob N chi2 1.413 2.592 1.590 1.825 0.235 0.086 0.207 0.177 0.098 0.992 0.279 2.148 0.754 0.312 0.597 0.143 2.515 5.467 0.164 0.541 0.113 0.019 0.686 0.462 33.812 6.076 0.000 0.014 26.254 7.831 0.000 0.005 11.595 4.211 0.001 0.040 0.650 2.417 0.420 0.120 2.795 1.034 0.095 0.309 0.212 0.027 0.645 0.793 37.774 0.616 0.000 0.432 30.440 0.615 0.000 0.433 6.856 0.027 0.009 0.870 73.581 1.196 0.000 0.274 38.493 7.778 0.000 0.005 30.099 0.176 0.000 0.675 When we differentiate between high democratic and low democratic nations, we find that though non-renewable energy consumption contributes positively to emissions in the long-run for both categories of countries, the impact is larger for low democratic countries than for high democratic nations. The division into low and high democracies was based on the Polity data and Freedom House (2018) discussion of democracy and autocracy, where we used the mean of the scores for the countries as a midpoint to categorize countries into relatively high and low democratic nations. These results are consistent with those of Li and Reuveny (2006), Gellers and Jeffords (2018) and Ghodrati et al. (2018). Further, we find that there is no statistically significant effect of non-renewable energy in the short-run for high democratic nations. Renewable energy, on the other hand, has a significant impact in low democratic countries. 4. Policy implications and conclusion The role of different types of energy and the political system in mitigating environmental degradation are examined in 28 SSA countries. The results based on cointegration techniques show that both RENE and NRENE contribute to carbon dioxide emissions, but urbanization has the opposite effect. The results also support the finding that democracies pollute less than non-democracies. The results lead to three key policy implications. First, the results of the study are supportive of the view that both RENE and NRENE contribute to carbon dioxide emissions. (Bilgili et al., 2016; Farhani and Shahbaz, 2014). It is worthy of note that the RENE contributed more to environmental degradation than NRENE. This could be attributed to the sporadic nature of RENE and inadequate storage technology for RENE. Many other authors suggest that RENE generation has not reached the threshold required (8.39%) to generate positive benefits on the environment (Chiu and Chang, 2009). In the last two decades, many SSA countries have seen an appreciable increase in RENE development, however, the relative share globally stands at just about 2% (Chachoua, 2016), which represents a drop of over 30%. This suggests that the African region has a huge potential for renewable energy development to mitigate the effects of high population growth and energy poverty and their concomitant negative effect on climate change. Evidently, with the abundant sunshine, biomass and wind, RENE can be promoted to ensure energy justice and environmental quality. Second, the results show a positive influence of urbanization on carbon dioxide emissions, which support studies that provide evidence of environmental dividend of urbanization (Behera and Dash, 2017; Li and Lin, 2015; Liu, 2009). The findings of the study are therefore *** −0.384 (0.059) ** ** *** −0.387 (0.061) * *** −0.194 (0.038) *** −0.199 (0.040) ** *** * *** −0.258 (0.052) *** EC Constant LPOL LEMP LUPOP LY2 −0.267 (0.052) * *** * ** 1.299 (0.609) −0.058 (0.030) 0.333 (0.658) −0.035 (0.225) −0.014 (0.030) −0.826 (0.659) *** 1.820 (0.111) −0.067 (0.006) −0.355 (0.207) 0.246 (0.390) −0.009 (0.069) LY LRE Note: ***, **,* denotes PValues of b0.01, b0.05, and b0.10 respectively. Models 1 and 2 include our full sample of countries. Models 3 and 4 on one hand, and 5 and 6 on the other, splits our sample into high and low governance nations respectively. Models 1, 3, and 5 employs non-renewable energy as our proxy for energy consumption, whereas, 2, 4, and 6 employs renewable energy consumption. The dependent variable in each model is a proxy for Co2 emissions (the measuring units is Kiloton). There are 28 countries covering 35 periods. *** ** *** *** *** *** *** *** *** 4.446 (0.861) −0.181 (0.037) 0.473 (0.406) −0.227 (0.554) −0.044 (0.083) ** 4.644 (1.948) 1.694 (0.123) −0.059 (0.007) −0.376 (0.206) 0.287 (0.379) −0.017 (0.068) ** 1.074 (0.513) * 1.901 (1.064) LNRE Long-run *** ** −0.207 (0.579) 1.346 (0.662) −0.061 (0.301) 0.460 (0.633) −0.010 (0.216) 0.460 (0.633) −0.579 (0.591) Short-run Long-run Short-run Model 2 Model 1 Variable Full sample Table 5 Long and short-run elasticities. *** 2.220 (0.271) −0.087 (0.017) −0.316 (0.216) 0.851 (0.452) 0.048 (0.086) −1.119 (0.435) −1.119 (0.338) −1.122 (1.062) −0.168 (0331) −1.122 (1.062) −2.537 (1.593) *** 0.618 (0.435) 1.663 (0.773) ** Short-run Long-run *** 0.995 (1.663) 4.119 (0.987) −0.166 (0.042) 0.461 (0.411) −0.119 (0.577) 0.039 (0.111) Long-run Model 4 *** −0.950 (0.828) −1.177 (0.385) 0.058 (0.017) −1.106 (1.097) −0.133) (0.332) −0.019 (0.031) −2.175 (1.773) Short-run *** 3.017 (1.623) Long-run *** 1.483 (0.379) −0.070 (0.338) 1.368 (0.674) −0.236 (0.360) 1.368 (0.674) 3.669 (1.423) 2.254 (1.286) *** Model 5 Model 3 * Low governance High governance Short-run * *** 9.694 (4.597) 2.006 (0.181) −0.073 (0.012) −0.267 (02.38) 0.696 (0.520) 0.042 (0.090) Long-run Model 6 ** 0.229 (0.734) 1.480 (0.396) −0.068 (0.020) 1.233 (0.654) −0.126 (0.328) −0.020 (0.040) 3.715 (1.409) Short-run *** S. Adams, C. Nsiah / Science of the Total Environment 693 (2019) 133288 7 supportive of the optimist view of urbanization, which suggests that urbanization promotes energy efficiency and consequently improvement in environmental and health outcomes. This is especially important because the sub-Saharan African region is urbanizing at a rate which is exceeded only by that of the Asian region. It is important to mention though that other studies show an insignificant or negative effect of urbanization on the environment (Adams et al., 2016; Foresight Africa, 2016). Further research is needed to examine and validate the findings on how urbanization affects carbon dioxide emissions. Third, the results show that democracies are more likely to be proenvironment than non-democracies and this should give some credence to the democratization process going on in the region. Accordingly, democratization should not be seen as mere conditionality to be achieved to receive donor support but internally driven to help promote sustainable development. As shown in the study, the effect of renewable energy is more pronounced in more democratic states than in less democratic states. However, some studies report that the mere transition to democracy is not enough to ensure the democratic dividend and argue for consolidation of democracy (Huntington, 1993). This is critical for the region as the consolidation or deepening of democracy helps to promote the development of both political and economic institutions that facilitate the proper functioning of society as whole. In concluding, it is worth reiterating the main findings of the study, which suggest that both RENE and NRENE have adverse effects on the environment though the negative effect is more severe in less democratic countries, indicating that democracy is good for the environment. The lack of significant positive effect of renewable energy on environmental quality has been associated with its minimal use in the region and more emphasis should be placed on its use and empirical studies given by future studies to drive the renewable agenda in helping the continent achieve the win benefits of economic growth and environmental quality. Obviously, this energy transition is critical to the SSA region as the continent is endowed with abundant renewable energy sources (Winkler, 2018). Othieno and Awange (2016) and Olutola (2018), for example, have argued that the abundance of renewable energy in the region makes it imperative for the countries in the region to invest in renewable energy technologies to reduce energy poverty on the continent. This is consistent with the idea that the continent cannot achieve the UN Sustainable Development Goals without a renewed focus on clean energy sources including both renewable and nuclear energy. The study focuses on a panel of 28 SSA countries and does not identify country – specific conditions and therefore future studies should be directed at both firm and country-levels to provide detailed information on the energy consumption - environmental degradation nexus. Appendix A Table 1A Sources of data. Variable Definition Source Co2kt CO2 emissions (kt) RE Renewable energy consumption in Quadrillion Btu (British thermal unit) NRE Non-renewable energy consumption in Quadrillion Btu UPOP Urban population (% of total) Y World Development Indicators U.S. Energy Information Administration U.S. Energy Information Administration World Development Indicators PENN World Tables Real GDP converted with Purchasing Power Parities (PPP) (constant prices mil. 2011 US$) Number of persons engaged or employed (in PENN World Tables millions) Regime type (Polity) (Polity is from −10 to 10 Polity IV Database depending on the autocratic or democratic nature of the government we recoded to (Polity +11)/21)*100) L GOV 8 S. Adams, C. Nsiah / Science of the Total Environment 693 (2019) 133288 Table 2A Country list. Angola Burkina Faso Burundi Cameroon The Central African Republic Comoros Congo (Rep) Cote d'Ivoire (Ivory Coast) Egypt Equatorial Guinea Ethiopia Gabon Ghana Guinea Kenya Madagascar Malawi Mali Mauritania Mauritius Mozambique Nigeria Rwanda South Africa Tanzania Togo Zambia Zimbabwe References Abrigo, M.K., Love, I., 2016. Estimation of panel vector autoregression in Stata. Stata Journal, 2016 16 (3), 778–804. Adams, S., Adom, P.K., Klobodu, E.K.M., 2016. Urbanization, regime type and durability, and environmental degradation in Ghana. Environ. Sci. Pollut. Res. 23 (23), 23825–23839. Africa Progress Panel, 2015. Power People Planet: Seizing Africa's Energy and Climate Opportunities. Africa Progress Panel, 2017. Lights, Power, Action: Electrifying Africa. African Development Bank, 2012. Income Inequality in Africa. Briefing Notes for AfDB’s Long Term Strategy Briefing. Note 5. African Development Bank, Tunis. Al-Mulali, U., Ozturk, I., 2015. The effect of energy consumption, urbanization, trade openness, industrial output, and the political stability on the environmental degradation in the MENA (Middle East and North African) region. Energy 84, 382–389. Apergis, N., Payne, J.E., Menyah, K., Wolde-Rufael, Y., 2010. On the causal dynamics between emissions, nuclear energy, renewable energy, and economic growth. Ecol. Econ. 69 (11), 2255–2260. Apergis, N., Jebli, M.B., Youssef, S.B., 2018. Does renewable energy consumption and health expenditures decrease carbon dioxide emissions? Evidence for sub-Saharan Africa countries. Renew. Energy 127, 1011–1016. Babbar, S., Babbar, R., 2018. Causal dynamics of CO 2 source emissions and population in India using Bayesian approach. Model. Earth Syst. Environ. 4 (1), 339–348. Balsalobre-Lorente, D., Shahbaz, M., Roubaud, D., Farhani, S., 2018. How economic growth, renewable electricity and natural resources contribute to CO 2 emissions? Energy Policy 113, 356–367. Behera, S.R., Dash, D.P., 2017. The effect of urbanization, energy consumption, and foreign direct investment on the carbon dioxide emission in the SSEA (South and Southeast Asian) region. Renew. Sust. Energ. Rev. 70, 96–106. Bernauer, T., Koubi, V., 2009. Effects of political institutions on air quality. Ecol. Econ. 68 (5), 1355–1365. Bhattacharya, M., Churchill, S.A., Paramati, S.R., 2017. The dynamic impact of renewable energy and institutions on economic output and CO 2 emissions across regions. Renew. Energy 111, 157–167. Bilgili, F., Koçak, E., Bulut, Ü., 2016. The dynamic impact of renewable energy consumption on CO2 emissions: a revisited Environmental Kuznets Curve approach. Renew. Sust. Energ. Rev. 54, 838–845. Buitenzorgy, M., Mol, A.P., 2011. Does democracy lead to a better environment? Deforestation and the democratic transition peak. Environ. Resour. Econ. 48 (1), 59–70. Chachoua, E. 2016. Power Up: Delivering Renewable Energy in Africa. The Economist Intelligence Unit, https://www.eiuperspectives.economist.com/sites/default/files/ Power%20Up.pdf. Chen, B., Han, M.Y., Peng, K., Zhou, S.L., Shao, L., Wu, X.F., ... Chen, G.Q., 2018. Global landwater nexus: agricultural land and freshwater use embodied in worldwide supply chains. Sci. Total Environ. 613, 931–943. Chiu, C.L., Chang, T.H., 2009. What proportion of renewable energy supplies is needed to initially mitigate CO2 emissions in OECD member countries? Renew. Sust. Energ. Rev. 13 (6), 1669–1674. Choi, I., 2002. Combination unit root tests for cross‐sectionally correlated panels. Mimeo, Hong Kong University of Science and Technology. Collier, P., Venables, A.J., 2012. Greening Africa? Technologies, endowments and the latecomer effect. Energy Econ. 34, S75–S84. Dogan, E., Seker, F., 2016. The influence of real output, renewable and non-renewable energy, trade and financial development on carbon emissions in the top renewable energy countries. Renew. Sust. Energ. Rev. 60, 1074–1085. Dritsaki, C., Dritsaki, M., 2014. Causal relationship between energy consumption, economic growth and CO2 emissions: A dynamic panel data approach. Int. J. Energy Econ. Policy 4 (2), 125–136. Elliot, S., 2007. Environmentally sustainable ICT: a critical topic for IS research? PACIS 2007 Proceedings, p. 114 Farhani, S., Shahbaz, M., 2014. What role of renewable and non-renewable electricity consumption and output is needed to initially mitigate CO2 emissions in MENA region? Renew. Sust. Energ. Rev. 40, 80–90. Fawcett, A.A., Iyer, G.C., Clarke, L.E., Edmonds, J.A., Hultman, N.E., McJeon, H.C., ... Creason, J., 2015. Can Paris pledges avert severe climate change? Science 350 (6265), 1168–1169. Foresight Africa, 2016. Top priorities for the continent in 2016. Brookings Institute. Foresight Africa, 2017. Top Priorities for the Continent in 2016. Brookings Institute, Washington DC. Franco, S., Mandla, V.R., Rao, K.R.M., 2017. Urbanization, energy consumption and urbanization, energy consumption and emissions in the Indian context A review. Renew. Sust. Energ. Rev. 71, 898–907. Freedom House, 2018. Freedom in the World 2018: Democracy in Crisis. Frimpong, K., Eddie Van Etten, E.J., Oosthuzien, J., Nunfam, V.F., 2017. Heat exposure on farmers in northeast Ghana. Int. J. Biometeorol. 61 (3), 397–406. Gellers, J.C., Jeffords, C., 2018. Toward environmental democracy? Procedural environmental rights and environmental justice. Global Environmental Politics 18 (1), 99–121. Ghodrati, S., Harati, J., Nazari, A., 2018. Democracy and environment quality in selected countries: an application of panel data. Iranian Economic Review 22 (1), 21–49. Huntington, S., 1993. The Third Wave of Democratization in the Late Twentieth Century. 3rd ed. University of Oklahoma Press, Norman. Inglesi-Lotz, R., Dogan, E., 2018. The role of renewable versus non-renewable energy to the level of CO2 emissions a panel analysis of sub-Saharan Africa's Βig 10 electricity generators. Renew. Energy 123, 36–43. International Renewable Energy Agency (IRENA), 2017. Rethinking Energy. 2017. IRENA, Abu Dhabi. Jebli, M.B., Youssef, S.B., 2015. The environmental Kuznets curve, economic growth, renewable and non-renewable energy, and trade in Tunisia. Renew. Sust. Energ. Rev. 47, 173–185. Jebli, M.B., Youssef, S.B., 2017. The role of renewable energy and agriculture in reducing CO2 emissions: evidence for North Africa countries. Ecol. Indic. 74, 295–301. Jebli, M.B., Youssef, S., Ozturk, I., 2015. The role of renewable energy consumption and trade: environmental Kuznets curve analysis for sub-Saharan Africa countries. Afr. Dev. Rev. 27 (3), 288–300. Kivyiro, P., Arminen, H., 2014. Carbon dioxide emissions, energy consumption, economic growth, and foreign direct investment: Causality analysis for Sub-Saharan Africa. Energy 74, 595–606. Kolcava, D., Nguyen, Q., Bernauer, T., 2019. Does trade liberalization lead to environmental burden shifting in the global economy? Ecol. Econ. 163, 98–112. Levin, A., Lin, C.-F., Chu, C.-S.J., 2002. Unit root tests in panel data: asymptotic and finitesample properties. J. Econ. 108, 1–24. Li, K., Lin, B., 2015. Impacts of urbanization and industrialization on energy consumption/ CO2 emissions: does the level of development matter? Renew. Sust. Energ. Rev. 52, 1107–1122. Li, Q., Reuveny, R., 2006. Democracy and environmental degradation. Int. Stud. Q. 50 (4), 935–956. Liu, B., 2009. Some research problems in uncertainty theory. J. Uncertain Syst. 3 (1), 3–10. Mert, M., Bölük, G., 2016. Do foreign direct investment and renewable energy consumption affect the CO2 emissions? New evidence from a panel ARDL approach to Kyoto Annex countries. Environ. Sci. Pollut. Res. 23 (21), 21669–21681. Mohiuddin, O., Asumadu-Sarkodie, S., Obaidullah, M., 2016. The relationship between carbon dioxide emissions, energy consumption, and GDP: A recent evidence from Pakistan. Cogent Eng. 3 (1), 1210491. Munck, G.L., Verkuilen, J., 2002. Conceptualizing and measuring democracy: evaluating alternative indices. Comparative political studies 35 (1), 5–34. Ngwenya, B., Oosthuizen, J., Cross, M., Frimpong, K., Chaibva, C.N., 2018. A review of heat stress policies in the context of climate change and its impacts on outdoor workers: evidence from Zimbabwe. Int. J. Soc. Ecol. Sustain. Dev. 9 (1), 1–11 (IJSESD). Olutola, O., 2018. Addressing nuclear in the Africa–European Union energy partnership: issues and perspectives through an African lens. Politikon 1–17. Othieno, H., Awange, J., 2016. Energy Resources in Africa. Springer International Publishing, Basel, Switzerland. Pata, U.K., 2018. Renewable energy consumption, urbanization, financial development, income and CO2 emissions in Turkey: testing EKC hypothesis with structural breaks. J. Clean. Prod. 187, 770–779. Pueyo, A., 2018. What constrains renewable energy investment in Sub-Saharan Africa? A comparison of Kenya and Ghana. World Dev. 109, 85–100. Pueyo, A., Orraca, P., Godfrey-Wood, R., 2015. What Explains the Allocation of Aid and Private Investment for Electrification? (No. IDS Evidence Report; 123). IDS Sarkodie, S.A., Adams, S., 2018. Renewable energy, nuclear energy, and environmental pollution: accounting for political institutional quality in South Africa. Sci. Total Environ. 643, 1590–1601. Shafiei, S., Salim, R.A., 2014. Non-renewable and renewable energy consumption and CO 2 emissions in OECD countries: a comparative analysis. Energy Policy 66, 547–556. Sinha, A., Shahbaz, M., Balsalobre, D., 2017. Exploring the relationship between energy usage segregation and environmental degradation in N-11 countries. J. Clean. Prod. 168, 1217–1229 Stata Panel-data unit-root tests. https://www.stata.com/manuals/ xtxtunitroot.pdf. Surroop, D., Raghoo, P., 2018. Renewable energy to improve energy situation in African island states. Renew. Sust. Energ. Rev. 88, 176–183. Wang, J., Dong, K., 2019. What drives environmental degradation? Evidence from 14 subSaharan African countries. Sci. Total Environ. 656, 165–173. Wang, S., Li, G., Fang, C., 2018. Urbanization, economic growth, energy consumption, and CO2 emissions: empirical evidence from countries with different income levels. Renew. Sust. Energ. Rev. 81, 2144–2159. Wesseh Jr., P.K., Lin, B., 2017. Is renewable energy a model for powering Eastern African countries transition to industrialization and urbanization? Renew. Sust. Energ. Rev. 75, 909–917. S. Adams, C. Nsiah / Science of the Total Environment 693 (2019) 133288 Winkler, M., 2018. Why nuclear power does not make sense for Africa. Conversation May 15, 2018. World Energy Outlook. World Energy Outlook (2015). World Energy Outlook, 2017. International Energy Agency. 9 You, W.H., Zhu, H.M., Yu, K., Peng, C., 2015. Democracy, financial openness, and global carbon dioxide emissions: heterogeneity across existing emission levels. World Dev. 66, 189–207. Zoundi, Z., 2017. CO2 emissions, renewable energy and the environmental Kuznets curve, a panel cointegration approach. Renew. Sust. Energ. Rev. 72, 1067–1075.
